. 2024 Jul 8;15(1):5731.
doi: 10.1038/s41467-024-50121-6.

Targeting the transmembrane cytokine co-receptor neuropilin-1 in distal tubules improves renal injury and fibrosis

Affiliations

Targeting the transmembrane cytokine co-receptor neuropilin-1 in distal tubules improves renal injury and fibrosis

Yinzheng Li et al. Nat Commun. .

Abstract

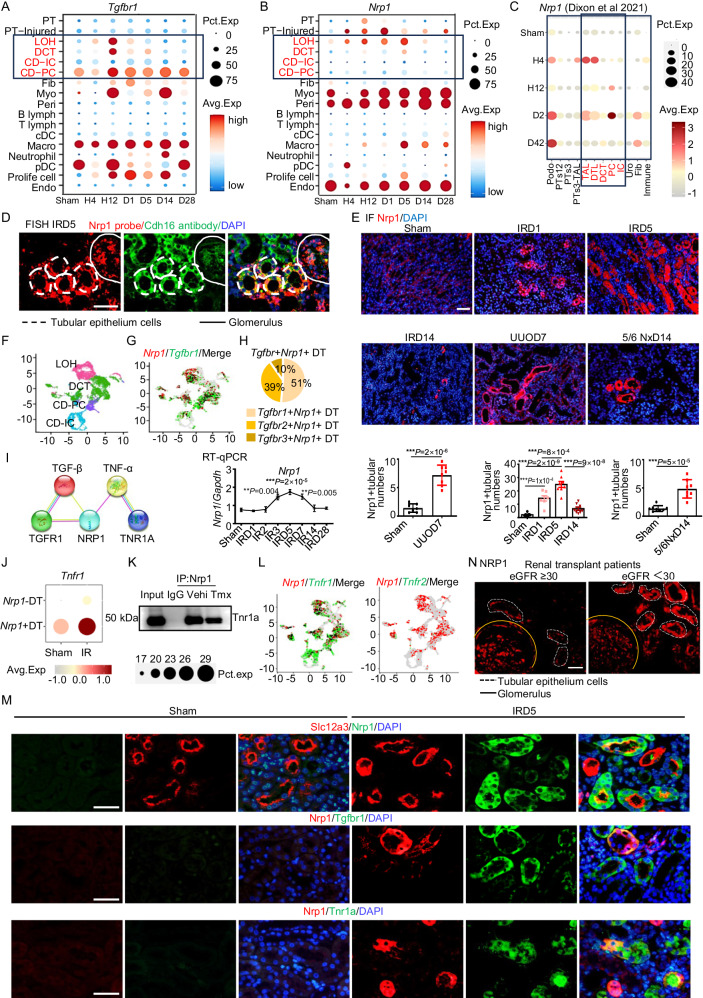
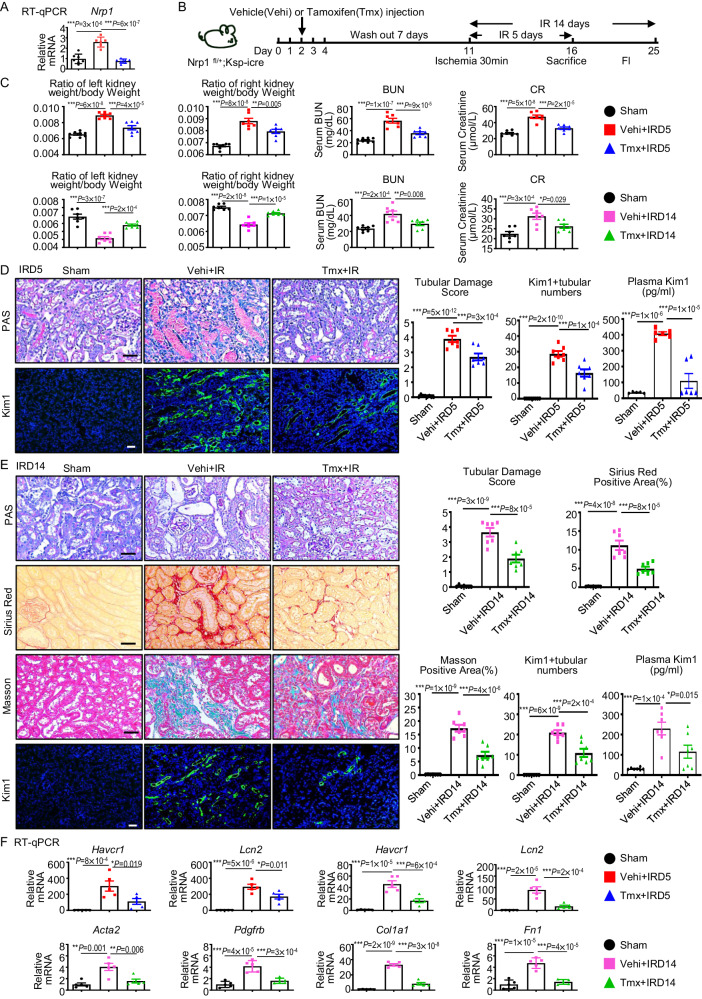
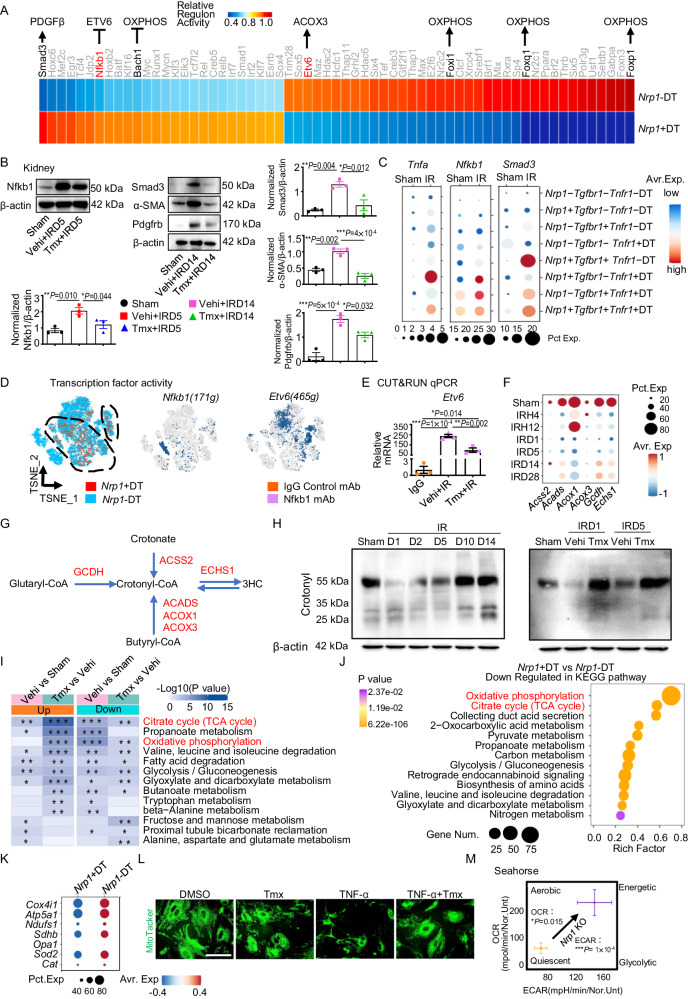
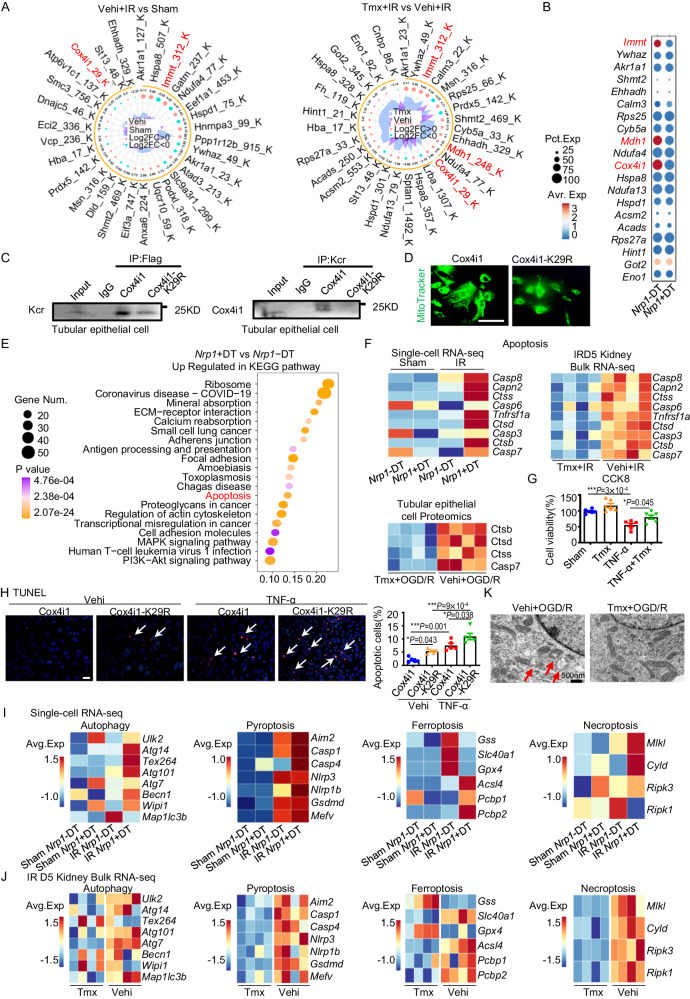
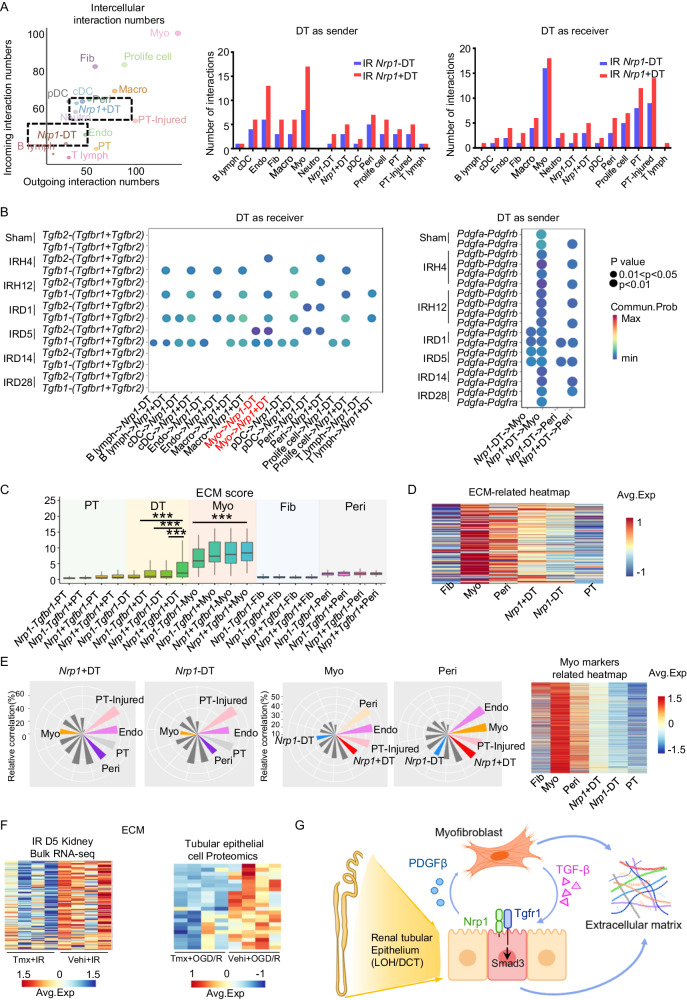
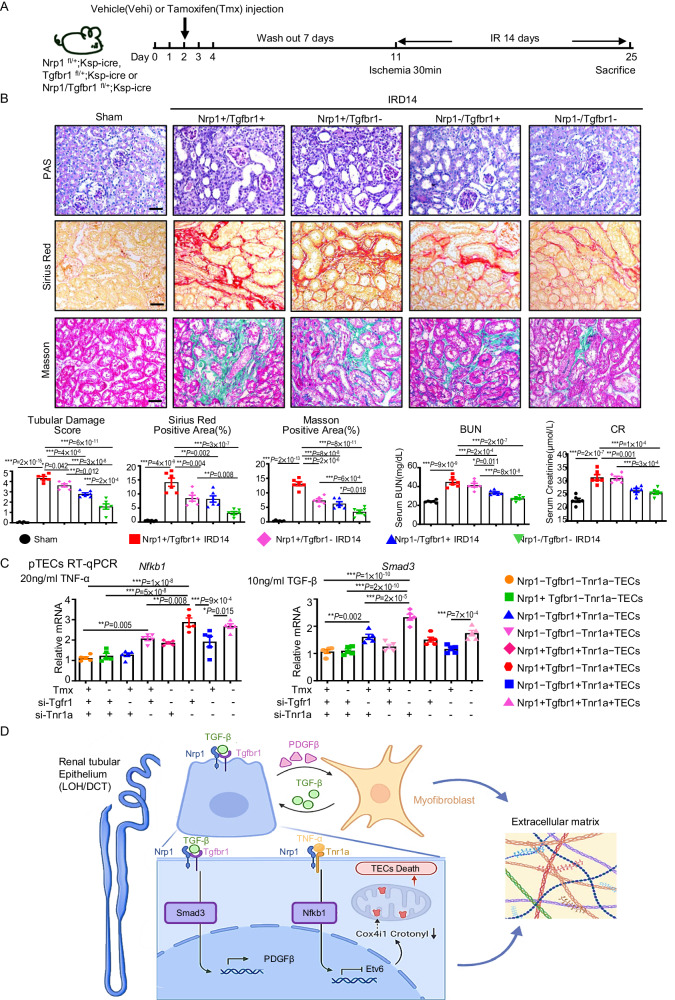
Neuropilin-1 (NRP1), a co-receptor for various cytokines, including TGF-β, has been identified as a potential therapeutic target for fibrosis. However, its role and mechanism in renal fibrosis remains elusive. Here, we show that NRP1 is upregulated in distal tubular (DT) cells of patients with transplant renal insufficiency and mice with renal ischemia-reperfusion (I-R) injury. Knockout of Nrp1 reduces multiple endpoints of renal injury and fibrosis. We find that Nrp1 facilitates the binding of TNF-α to its receptor in DT cells after renal injury. This signaling results in a downregulation of lysine crotonylation of the metabolic enzyme Cox4i1, decreases cellular energetics and exacerbation of renal injury. Furthermore, by single-cell RNA-sequencing we find that Nrp1-positive DT cells secrete collagen and communicate with myofibroblasts, exacerbating acute kidney injury (AKI)-induced renal fibrosis by activating Smad3. Dual genetic deletion of Nrp1 and Tgfbr1 in DT cells better improves renal injury and fibrosis than either single knockout. Together, these results reveal that targeting of NRP1 represents a promising strategy for the treatment of AKI and subsequent chronic kidney disease.


Conflict of interest statement

The authors declare no competing interests.

Figures

Fig. 1
Fig. 1. Nrp1 expression is upregulated in distal TECs of patients with transplant renal insufficiency and mice with IR-induced AKI and CKD.
A Expression levels of Tgfbr1 in kidney after IR surgery. B Expression levels of Nrp1 in kidney after IR surgery. C Expression levels of Nrp1 in kidney after IR surgery. Figure created with humphreyslab.com. D Co-staining Nrp1 and Cdh16 using fluorescence in situ hybridization (FISH). E Representative immunofluorescence images of Nrp1 in IR(For Sham, n = 7; IRD1, n = 7; IRD5, n = 8; IRD14, n = 8), UUO (For Sham, n = 7; UUOD7, n = 8), and 5/6 nephrectomy (n = 8 per group) mice. F UMAP plot displayed the distribution of distal tubular (DT) cells, including loop of Henle (LOH), distal convoluted tubule(DCT), principal cells of collecting duct (CD-PC), and intercalated cells of collecting duct (CD-IC). G, H Co-expression of Nrp1 and TGF-β receptors in DT cells. I Interaction relationships between NRP1, TGF-β and TNF-α, and their receptors using the STRING website (https://string-db.org/). J Expression level of Tnfr1 in DT cells. K Immunoprecipitation experiments of the interaction between Nrp1 and Tnr1a. L Co-expression of Nrp1 and TNF-α receptors in DT cells. M Co-expression of Nrp1 with Tgfr1, Tnr1a and distal tubular marker S12a3 with immunofluorescence staining. The experiments were independently repeated three times. N Immunofluorescence staining of NRP1 in kidney transplant patients. *P < 0.05, **P < 0.01, ***P < 0.001 as determined by one-way ANOVA. Scale bar, 20 μm. Data represent mean ± SEM. Source data are provided as a Source Data file.
Fig. 2
Fig. 2. Knockout of Nrp1 in TECs reduces I-R-induced kidney damage and fibrosis.
A Levels of Nrp1 measured by RT-qPCR (For Sham, n = 7; Vehi+IRD5, n = 6; Tmx+IRD5, n = 7). B A schematic diagram illustrating the experimental scheme of I-R analysis. C Ratio of kidney weight versus body weight of mice. Plasma blood urea nitrogen (BUN) concentrations and creatinine (CR) concentrations in sham, Vehi + IR, or Tmx + IR at 5 days (For Sham, n = 8; Vehi+IRD5, n = 7; Tmx+IRD5, n = 7) and 14 days (n = 7 per group). D Representative micrographs and corresponding statistical scores of periodic acid-Schiff (PAS) (For Sham, n = 8; Vehi+IRD5, n = 7; Tmx+IRD5, n = 7), Kim1 immunofluorescence staining (For Sham, n = 8; Vehi+IRD5, n = 7; Tmx+IRD5, n = 7) and plasma Kim1 detected by enzyme linked immunosorbent assay (ELISA) (For Sham, n = 5; Vehi+IRD5, n = 6; Tmx+IRD5, n = 6) on day 5 after IR in mice. The assessment of renal tubular damage involves evaluating tubular necrosis, cast formation, tubular dilation, and brush border loss. Scores are assigned to indicate the degree of damage: 0 for no damage, 1 for 10% damage, 2 for 11–25% damage, 3 for 26–45% damage, 4 for 46–75% damage, and 5 for more than 76% damage. E Representative micrographs and corresponding statistical scores of PAS, Masson, Sirius red, Kim1 immunofluorescence staining and plasma Kim1 detected by ELISA on day 14 after IR in mice (n = 7 per group). F Expression levels of kidney damage indicators (Havcr1 and Lcn2) and fibrosis-related factors (Acta2, Pdgfrb, Col1a1 and Fn1) at day 14 after IR determined using RT-qPCR (n = 5 per group). *P < 0.05, **P < 0.01, ***P < 0.001 as determined by one-way ANOVA. Scale bar, 20 μm. Data represent mean ± SEM. Source data are provided as a Source Data file.
Fig. 3
Fig. 3. Nrp1 upregulates the Nfkb1 and Smad3 pathway, suppressing Etv6 and Acox3 expression, leading to reduced levels of OXPHOS and TCA in TECs.
A Transcription factor activity analysis heatmap of DT cells. B Western blotting analysis showing the changes in Nfkb1, Smad3, α-SMA and Pdgfrb after IR and Nrp1 knockout (n = 3 per group). C Dotplot of Tnfa, Nfkb1 and Smad3 in DT cells. D T-SNE plots showing the expression region of Nrp1 and transcription factor activity region of Nfkb1 and Etv6 in DT cells. E The amplification levels of Etv6 after binding with the anti-Nfkb1 monoclonal antibody using qPCR (n = 3 per group). F Dotplot of crotonyl-CoA-producing enzymes in kidney. G A schematic diagram illustrating the enzymes involved in the production of crotonyl-CoA. H Western blotting analysis showing the changes in crotonylation lysine modification after I-R and Nrp1 knockout. I Heatmap displaying the Kyoto Encyclopedia of Genes and Genomes (KEEG) pathways enriched in proteins with changing crotonylation modification sites before and after IR treatment, as well as before and after Nrp1 knockout. J Downregulated KEGG pathways in Nrp1 + DT cells compared to Nrp1-DT cells in scRNA-seq data. The statistical analyzes were two-sided and adjustments were made in P value. K Dotplot of genes related to mitochondrial functional status in DT cells. L Immunofluorescent staining of MitoTracker in primary renal tubular epithelial cells (pTECs) treated with TNF-α and Tmx. M Energy map showing increased oxygen consumption rate (OCR) and extracellular acidification rate (ECAR) in pTECs after Nrp1 knockout (n = 5 per group). Data are representative of three independent experiments. *P < 0.05, **P < 0.01, ***P < 0.001 as determined by one-way ANOVA. Scale bar, 50 μm. Data represent mean ± SEM. Source data are provided as a Source Data file.
Fig. 4
Fig. 4. Nrp1 reduces OXPHOS and TCA levels, exacerbating the cell death in TECs by decreasing the level of crotonylated Cox4i1.
A Radiation plot depicting the changes in crotonylation modification sites before and after IR, as well as before and after Nrp1 knockout. B Dotplot showing the gene expression levels of the proteins mentioned in Figure A in DT cells. C Kcr level of Cox4i1 in pTECs verified by IP and Western blotting. The experiments were independently repeated three times. D Immunofluorescent staining of MitoTracker treated with Cox4i1 and Cox4i1-K29R plasmids. The experiments were independently repeated three times. E Upregulated KEGG pathways in Nrp1 + DT cells compared to Nrp1- DT cells in scRNA-seq data. The statistical analyzes were two-sided and adjustments were made in P value. F Heatmaps related to apoptosis from scRNA-seq, IRD5 kidney bulk RNA sequencing, and pTECs proteomics. G Quantification of cell viability was detected using CCK8 (n = 6 per group). H Quantification of apoptosis were detected using terminal deoxynucleotidyl transferase dUTP nick end fluorescent labeling (TUNEL) staining (n = 5 per group). I The heatmap related to autophagy, pyroptosis, ferroptosis, and necroptosis in scRNA-seq. J The heatmap related to autophagy, pyroptosis, ferroptosis, and necroptosis in IRD5 kidney bulk RNA-seq. K The transmission electron microscopy image showed the impact of oxygen glucose deprivation/re-oxygenation (OGD/R) and Nrp1 knockout on mitochondrial damage. The red arrow showed the damaged mitochondrial structure. The experiments were independently repeated three times. *P < 0.05, **P < 0.01, ***P < 0.001 as determined by one-way ANOVA. Scale bar, 50 μm. Data represent mean ± SEM. Source data are provided as a Source Data file.
Fig. 5
Fig. 5. Nrp1 + DT cells communicate with myofibroblasts and secrete collagen to promote renal fibrosis.
A Scatter plot and bar chart of renal intercellular interaction numbers after I-R surgery. B Dotplot showing DT cells receiving TGF-β signals and sending PDGF signals. The statistical analyzes were two-sided and adjustments were made in P value. C The extracellular matrix (ECM) scores of renal tubular epithelial cells and stromal cells (n = 10 per group). In the boxplots, the central line represents median, the bounds of boxes represent the first and third quartiles, and the upper and lower whiskers extend to the highest or the smallest value within 1.5 interquartile range. D The ECM-related and myofibroblasts markers-related heatmap of renal tubular epithelial cells and stromal cells. E Gene expression similarity between Nrp1 + DT and other cell types was presented by fan-shaped bar plot. F ECM-related heatmap in IRD5 Kidney Bulk RNA-seq and pTECs Proteomics (n = 4 per group). G A schematic diagram illustrating the role of Nrp1 in promoting fibrosis. Figure 5G, created with BioRender.com, released under a Creative Commons Attribution-NonCommercial-NoDerivs 4.0 International license. *P < 0.05, **P < 0.01, ***P < 0.001 as determined by one-way ANOVA. Data represent mean ± SEM. Source data are provided as a Source Data file.
Fig. 6
Fig. 6. Dual knockout of Nrp1 and Tgfbr1 in distal TECs better improves renal injury and renal fibrosis compared to either knockout alone.
A A schematic diagram illustrating the experimental scheme. B Representative micrographs and corresponding statistical scores of PAS, Masson, and Sirius red staining on day 14 after I-R in mice with tubular-specific Nrp1 and Tgfbr1 knockout. Plasma BUN concentrations and CR concentrations in sham, vehicle + IR, or Tmx + IR groups at 14 days (n = 6 per group). C Expression levels of Nfkb1 and Smad3 in pTECs treated with TNF-α or TGF-β by RT-qPCR (n = 5 per group). D A schematic diagram illustrating the mechanism by which Nrp1 promotes kidney injury and fibrosis. Figure 6D, created with BioRender.com, released under a Creative Commons Attribution-NonCommercial-NoDerivs 4.0 International license. *P < 0.05, **P < 0.01, ***P < 0.001 as determined by one-way ANOVA. Scale bar, 20 μm. Data represent mean ± SEM. Source data are provided as a Source Data file.

References

    1. Yamamoto T, Nakamura T, Noble NA, Ruoslahti E, Border WA. Expression of transforming growth factor beta is elevated in human and experimental diabetic nephropathy. Proc. Natl Acad. Sci. Usa. 1993;90:1814–1818. doi: 10.1073/pnas.90.5.1814. - DOI - PMC - PubMed
    1. Yoshioka K, et al. Transforming growth factor-beta protein and mRNA in glomeruli in normal and diseased human kidneys. Lab. Invest. 1993;68:154–163. - PubMed
    1. Meng XM, Nikolic-Paterson DJ, Lan HY. TGF-beta: the master regulator of fibrosis. Nat. Rev. Nephrol. 2016;12:325–338. doi: 10.1038/nrneph.2016.48. - DOI - PubMed
    1. Rayego-Mateos S, Valdivielso JM. New therapeutic targets in chronic kidney disease progression and renal fibrosis. Expert Opin. Ther. Targets. 2020;24:655–670. doi: 10.1080/14728222.2020.1762173. - DOI - PubMed
    1. Voelker J, et al. Anti-TGF-beta1 Antibody Therapy in Patients with Diabetic Nephropathy. J. Am. Soc. Nephrol. 2017;28:953–962. doi: 10.1681/ASN.2015111230. - DOI - PMC - PubMed

MeSH terms

LinkOut - more resources