. 2024 Jul 8;15(1):5710.
doi: 10.1038/s41467-024-48515-7.

Heterogeneity in lung macrophage control of Mycobacterium tuberculosis is modulated by T cells

Affiliations

Heterogeneity in lung macrophage control of Mycobacterium tuberculosis is modulated by T cells

Rocky Lai et al. Nat Commun. .

Abstract

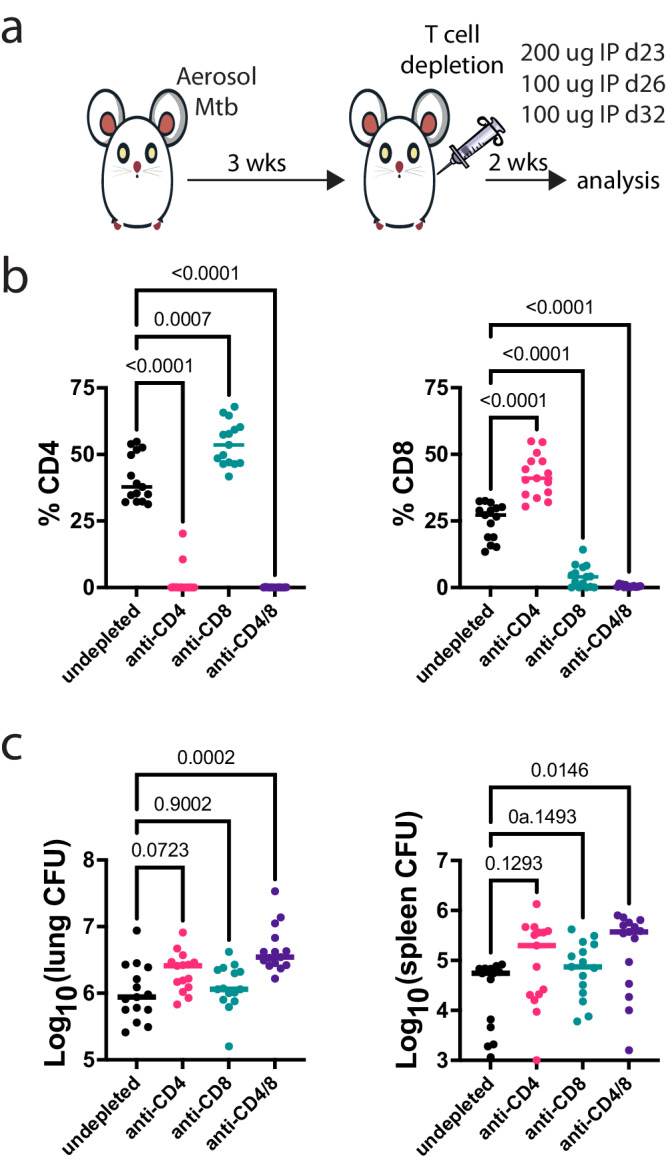
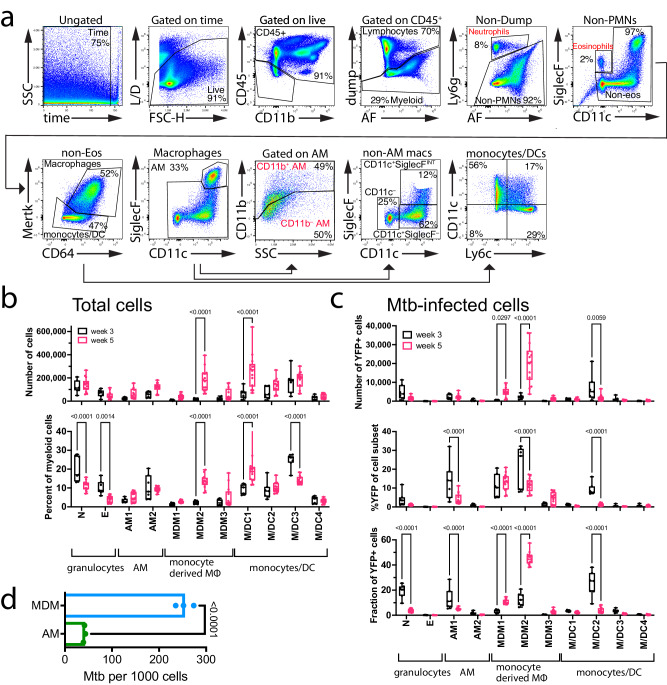
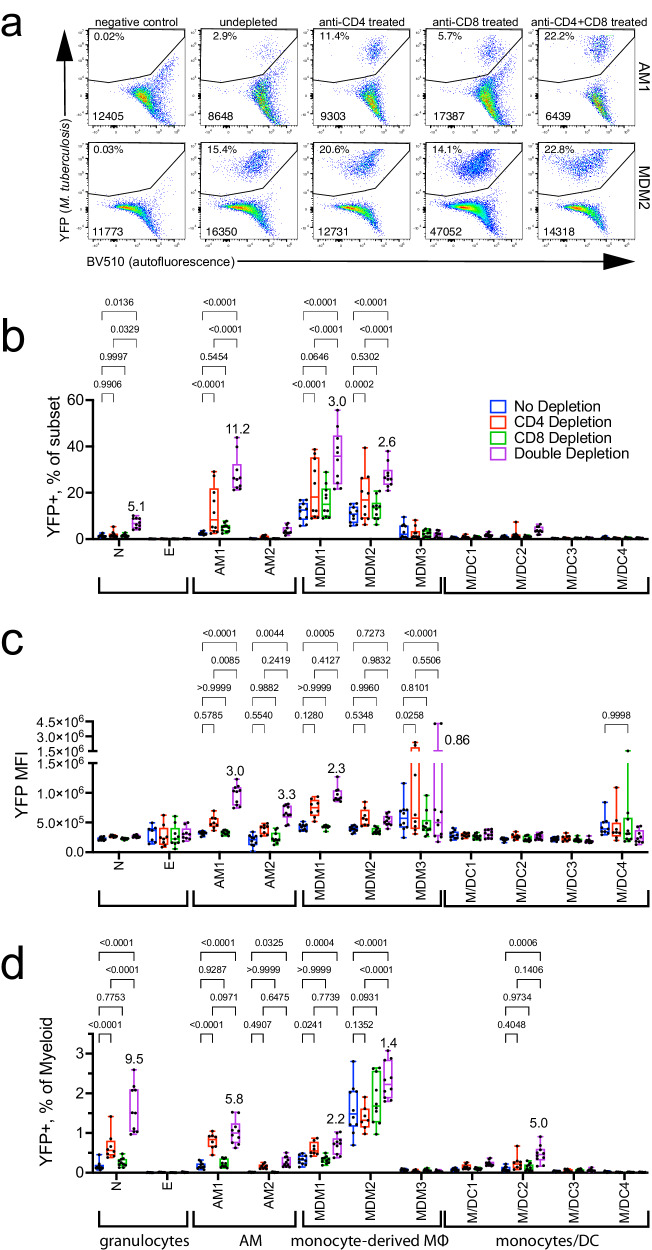
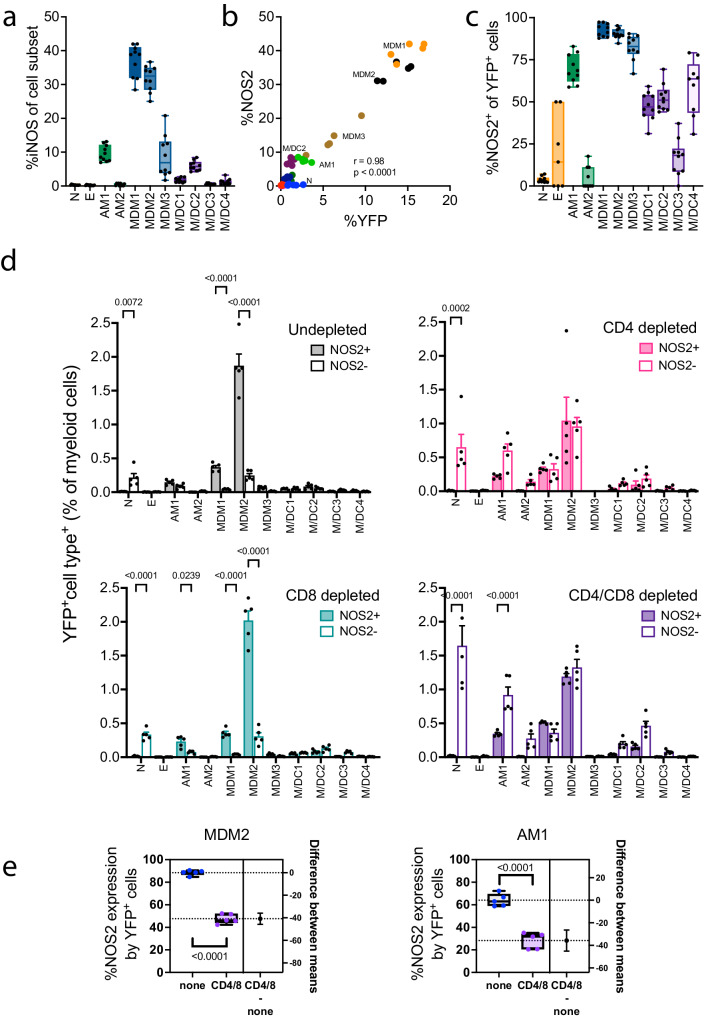
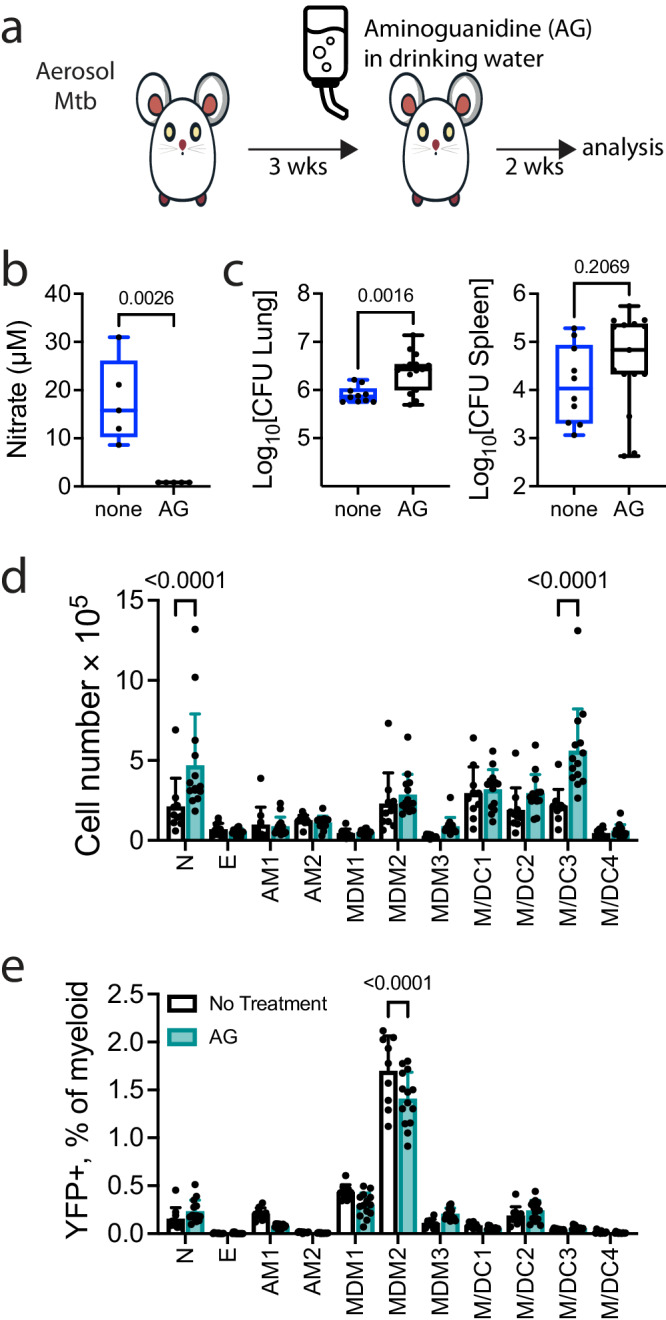
Following Mycobacterium tuberculosis infection, alveolar macrophages are initially infected but ineffectively restrict bacterial replication. The distribution of M. tuberculosis among different cell types in the lung changes with the onset of T cell immunity when the dominant infected cellular niche shifts from alveolar to monocyte-derived macrophages (MDM). We hypothesize that changes in bacterial distribution among different cell types is driven by differences in T cell recognition of infected cells and their subsequent activation of antimicrobial effector mechanisms. We show that CD4 and CD8 T cells efficiently eliminate M. tuberculosis infection in alveolar macrophages, but they have less impact on suppressing infection in MDM, which may be a bacterial niche. Importantly, CD4 T cell responses enhance MDM recruitment to the lung. Thus, the outcome of infection depends on the interaction between the T cell subset and the infected cell; both contribute to the resolution and persistence of the infection.


Conflict of interest statement

The authors declare no competing interests.

Figures

Fig. 1
Fig. 1. The effect of CD4 and CD8 T cell depletion on lung and spleen CFU.
a Experimental scheme. Mice were infected with Rv.YFP and rested for 3 weeks, after which CD4 and CD8 depleting mAbs were given over the course of two weeks at the indicated timepoints. b Proportion of CD4 and CD8 T cells in the lungs of infected C57BL/6 mice at 5 weeks post infection following treatment with either anti-CD4 and/or anti-CD8 depleting mAbs. c Lung and spleen CFU at 5 weeks post infection following treatment either anti-CD4 and/or anti-CD8 depleting mAbs. Each point represents an individual mouse. The data are from n = 15 mice, pooled from three independent experiments. Each condition was compared to the undepleted group using Welch’s ANOVA test followed by the Dunnett multiple comparison test. Bar, median. P-values are indicated. Source data are provided as a Source Data file.
Fig. 2
Fig. 2. Distribution of M. tuberculosis-infected cells between three and five weeks after infection.
a Gating strategy for identifying lung myeloid cell populations. In brief, a viability dye was used to exclude dead cells; CD45 and CD11b were used to exclude non-hematopoietic cells; CD3, CD19 and NK1.1 (vs. autofluorescence, AF) were used to exclude lymphocytes from other hematopoietic cells. Ly6G and AF allowed identification of neutrophils; similarly, CD11c and SiglecF identified eosinophils. Mertk and CD64 were used to separate macrophages from monocyte/DC subsets. SiglecF and CD11c were used to separate AM from MDM, and then used to subset the MDM populations. CD11b was used to divide the AM population. CD11c and Ly6C were used to subset the monocyte/DC populations. b Quantification of different myeloid cell populations in the lung at week 3 and week 5 post infection, expressed in terms of total cell numbers (top) or as a percentage of total myeloid cells (bottom). c Quantification of the YFP signal in various myeloid cell types in the lung at week 3 and week 5 post infection, expressed in terms of total cell numbers (top), %YFP of each population (middle) or the fraction of each population within the total population of YFP+ cells (bottom). d Flow sorted AM and MDM2 were plated to determine intracellular CFU within each purified population. b, c Each point represents an individual mouse pooled from two independent experiments (n = 5) for week 3, and three independent experiments (n = 15) for week 5. A two-way ANOVA was performed using Bonferonni’s multiple comparison test. Box plots indicate median (middle line), 25th, 75th percentile (box) and minimum and maximum (whiskers). P-values are indicated. d Results are representative of two experiments using cells purified from lung cells pooled from five mice, tested in triplicate, and analyzed using a t-test. Bars are mean ± SD. P (two-sided), p < 0.0001. Source data are provided as a Source Data file.
Fig. 3
Fig. 3. Different types of lung myeloid cells react differently to the loss of CD4 and CD8 T cell pressure.
Quantification of YFP signal within various myeloid cell populations in the lung at 5 weeks post infection following CD4 and/or CD8 depletion. a Representative flow plots of YFP signal in AM1 and MDM2, plotted against autofluorescence. Top number represents the frequency of YFP+ events, bottom number are the total number of cells. bd Graphical representation of YFP signal in different myeloid subsets, expressed as (b) %YFP+ cells within each subset; c MFI of YFP within each subset; and (d) YFP+subset+ cells as a percentage of the total myeloid cells. Each point represents an individual mouse from two independent experiments (n = 10). A two-way ANOVA was performed using Tukey’s multiple comparison test. Box plots indicate median (middle line), 25th, 75th percentile (box) and minimum and maximum (whiskers). Some statistical comparisons have been omitted for clarity. Numbers in (bd) are the fold change of the ‘double depletion’ compared to the ‘no depletion’ condition. Source data are provided as a Source Data file.
Fig. 4
Fig. 4. T cell depletion affects NOS2 expression.
a The percentage of different myeloid cell types in the lung that express NOS2 at 5 wpi. b Pearson correlation between %NOS2 expression and %YFP signal in various myeloid cell populations. c The percentage of infected (YFP+) cells that express NOS2. d The effect of CD4 and/or CD8 T cell depletion on the distribution of YFP+ cells among NOS2+ and NOS2 cells, as a percentage of total myeloid cells in the lung at 5 wpi. A two-way ANOVA was performed using Šídák’s multiple comparisons test. Bars are mean ± SEM. P-values are indicated. e The effect of CD4 and CD8 T cell depletion on the frequency of NOS2 expression by YFP+ AM1 and MDM2 in the lung at 5 wpi. T-test. P-values (two-tailed) are indicated. The data (n = 5) is one of two independent experiments. a, c, e Box plots indicate median (middle line), 25th, 75th percentile (box) and minimum and maximum (whiskers). Source data are provided as a Source Data file.
Fig. 5
Fig. 5. Delayed inhibition of NOS2 has only a small effect on M. tuberculosis bacterial burden.
a Experimental scheme for AG treatment. Mice were giving AG in their drinking water starting from week 3 post infection over the course of two weeks. b Nitrate measured in lung homogenates of control mice or those treated with aminoguanidine. c Lung and spleen CFU from mice treated with or without AG at 5 wpi. d Total numbers of myeloid cell populations in the lung at 5 wpi. e %YFP+ as a fraction of total myeloid cells following AG treatment at 5 wpi. Each point represents an individual mouse (n = 5) from two independent experiments. Statistical testing was done by t-test (b, c) or a two-way ANOVA was performed using Tukey’s (d) or Dunnett’s multiple comparison tests (e). P-(two-tailed for b, c) values are indicated. (b, c) Box plots indicate median (middle line), 25th, 75th percentile (box) and minimum and maximum (whiskers). d, e Bars are mean ± SD. Source data are provided as a Source Data file.
Fig. 6
Fig. 6. Adoptive transfer of CD4 T cells drive recruitment of MDM to the lung.
a Experimental scheme for CD4 T cell adoptive transfer. RAG1 KO were infected with Rv.YFP as indicated and rested for 3 weeks. In parallel, C57BL/6 mice were infected with M. tuberculosis, and at 3 wpi, polyclonal CD4 T cells were purified and transferred i.v. into infected RAG1 KO mice. Cells were isolated from RAG1 KO mice two weeks post transfer, and bacterial burden was measured. b Lung CFU was determined in RAG1 KO mice that either received CD4 T cells or PBS. c Total numbers of the different myeloid populations. d % YFP (left) and the MFI of YFP (right) within each myeloid population. e Total number of YFP+ cells within each myeloid subset (left) and their fractional contribution to the total number of infected cells (right). The data (n = 4) is one of three independent experiments. Statistical analysis was performed using a t-test (b), or two-way ANOVA with Šídák’s multiple comparison test (ce). The violin plots show the 25th percentile, median, and 75th percentile. b Bars are mean ± SEM. P (two-tailed for b) values are indicated. Source data are provided as a Source Data file.

Update of

References

    1. Cohen SB, et al. Alveolar Macrophages Provide an Early Mycobacterium tuberculosis Niche and Initiate Dissemination. Cell Host Microbe. 2018;24:439–446.e434. doi: 10.1016/j.chom.2018.08.001. - DOI - PMC - PubMed
    1. Wolf AJ, et al. Initiation of the adaptive immune response to Mycobacterium tuberculosis depends on antigen production in the local lymph node, not the lungs. J. Exp. Med. 2008;205:105–115. doi: 10.1084/jem.20071367. - DOI - PMC - PubMed
    1. Chackerian AA, Alt JM, Perera TV, Dascher CC, Behar SM. Dissemination of Mycobacterium tuberculosis Is Influenced by Host Factors and Precedes the Initiation of T-Cell Immunity. Infect. Immun. 2002;70:4501–4509. doi: 10.1128/IAI.70.8.4501-4509.2002. - DOI - PMC - PubMed
    1. Skold M, Behar SM. Tuberculosis triggers a tissue-dependent program of differentiation and acquisition of effector functions by circulating monocytes. J. Immunol. 2008;181:6349–6360. doi: 10.4049/jimmunol.181.9.6349. - DOI - PubMed
    1. Norris BA, Ernst JD. Mononuclear cell dynamics in M. tuberculosis infection provide opportunities for therapeutic intervention. PLoS Pathog. 2018;14:e1007154. doi: 10.1371/journal.ppat.1007154. - DOI - PMC - PubMed

MeSH terms

LinkOut - more resources