. 2024 Jul 8;14(1):15670.
doi: 10.1038/s41598-024-65598-w.

Quantified planar collagen distribution in healthy and degenerative mitral valve: biomechanical and clinical implications

Affiliations

Quantified planar collagen distribution in healthy and degenerative mitral valve: biomechanical and clinical implications

Mohammad Javad Sadeghinia et al. Sci Rep. .

Abstract

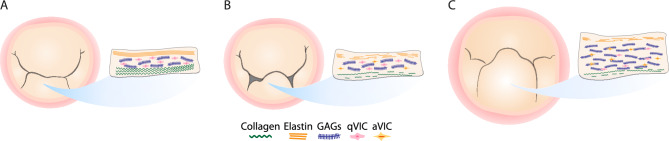
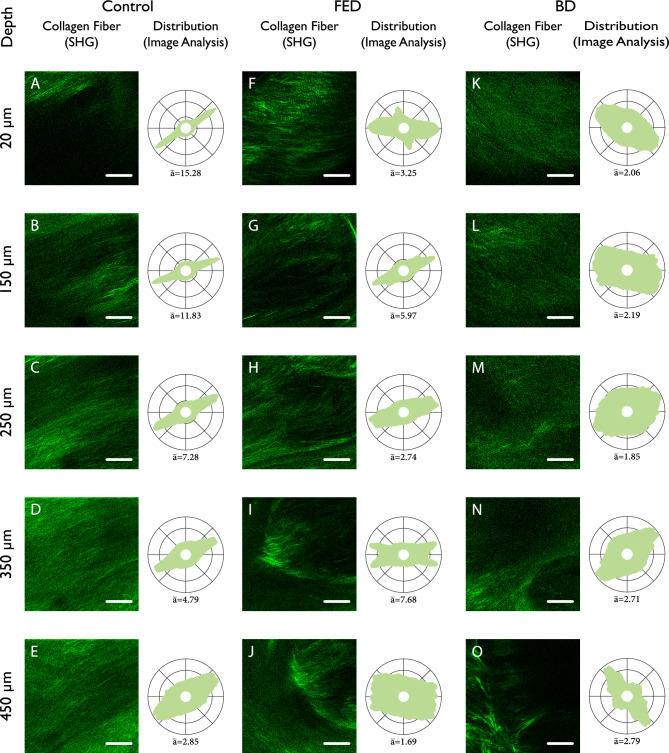
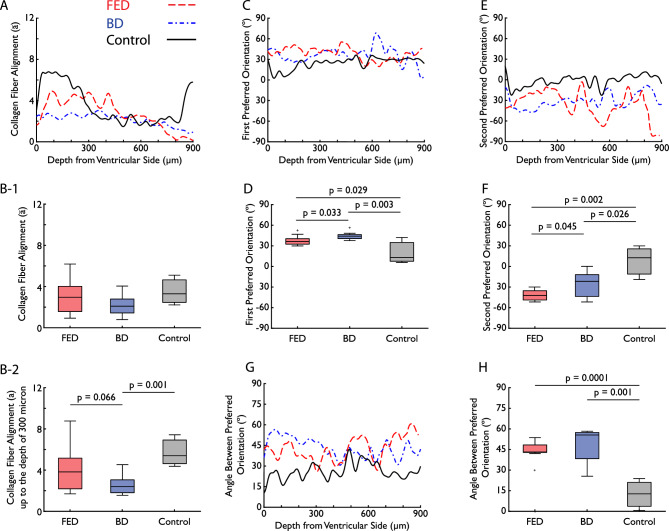
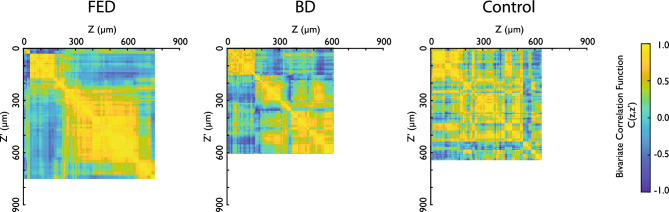
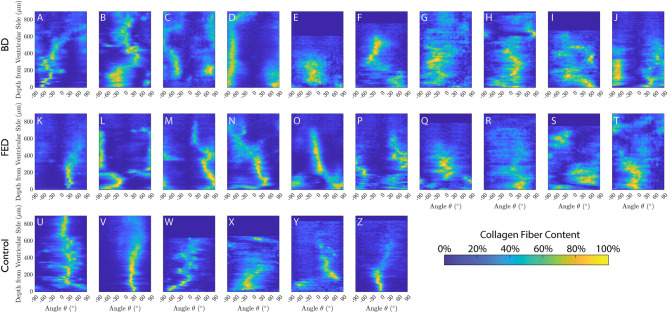
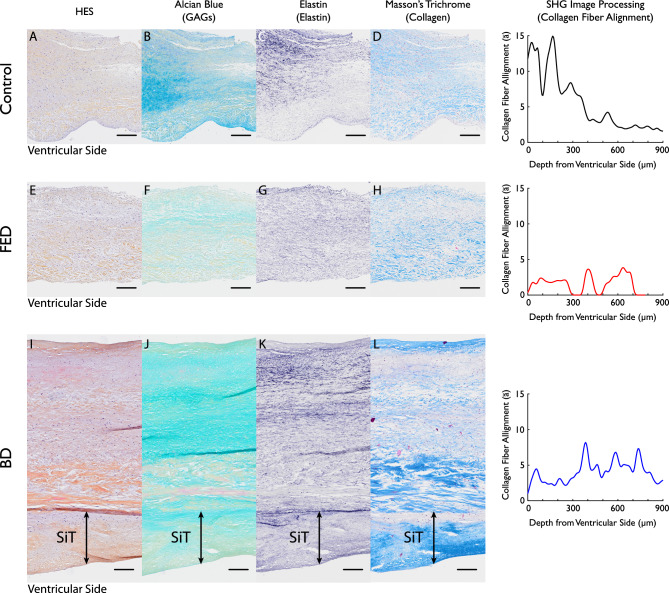
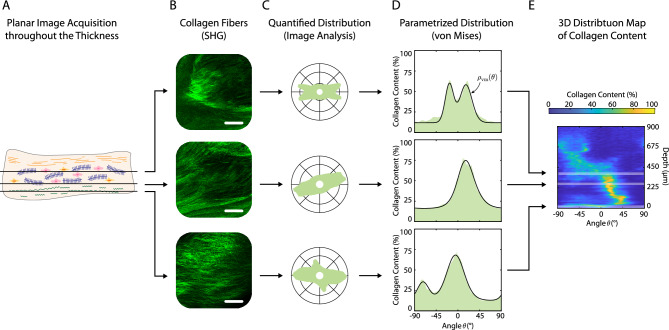
Degenerative mitral valve disease is a common valvular disease with two arguably distinct phenotypes: fibroelastic deficiency and Barlow's disease. These phenotypes significantly alter the microstructures of the leaflets, particularly the collagen fibers, which are the main mechanical load carriers. The predominant method of investigation is histological sections. However, the sections are cut transmurally and provide a lateral view of the microstructure of the leaflet, while the mechanics and function are determined by the planar arrangement of the collagen fibers. This study, for the first time, quantitatively examined planar collagen distribution quantitatively in health and disease using second harmonic generation microscopy throughout the thickness of the mitral valve leaflets. Twenty diseased samples from eighteen patients and six control samples were included in this study. Healthy tissue had highly aligned collagen fibers. In fibroelastic deficiency they are less aligned and in Barlow's disease they are completely dispersed. In both diseases, collagen fibers have two preferred orientations, which, in contrast to the almost constant one orientation in healthy tissues, also vary across the thickness. The results indicate altered in vivo mechanical stresses and strains on the mitral valve leaflets as a result of disease-related collagen remodeling, which in turn triggers further remodeling.

Keywords: Barlow’s disease; Collagen remodeling; Degenerative mitral valve disease; Fibroelastic deficiency.


Conflict of interest statement

The authors declare that they are not aware of any competing financial interests or personal relationships that might appear to have influence the work reported in this paper.

Figures

Figure 1
Figure 1
(A) Illustration of the mitral valve. Mitral valve leaflets are comprised of three main distinct layers; (from the ventricular side) a collagen-rich fibrosa, a spongiosa layer consisting of mostly glycosaminoglycans (GAGs), and an elastic atrialis. The entire leaflet is also populated with quiescent valvular interstitial cells (qVIC). (B) Mitral valve with fibroelastic deficiency (FED) and (C) Barlow’s disease. Both diseases are characterized by fragmented collagen and elastin fibers with activated valvular interstitial cells (aVIC), exhibiting myofibroblast-like behavior.
Figure 2
Figure 2
SHG acquisition of collagen fibers for a representative (AE) control, (FJ) FED and (KO) BD, all from the P2 segment, and their respective collagen fiber distributions. The images are acquired at different depths from the ventricular side; (A, F, K) 20μm, (B, G, L) 150μm, (C, H, M) 250 μm, (D, I, N) 350 μm, (E, J, O) 450 μm. The scale bars are 100μm.
Figure 3
Figure 3
The variation across thickness and boxplots of (A, B-1 ,B-2) collagen fiber alignment, (C, D) first and (E, F) second preferred orientations, and (G, H) the angle between preferred orientations for control (black solid curve), FED (red dashed curve) and BD (blue dash-dotted curve). Plots A, C and E are the average of all samples within each group, and boxplots B, D and F are calculated averages for each patient. For collagen fiber alignment, B-1 is the boxplots from the average patient value for the entire acquisition depth, while B-2 only considers the first 300μm, which corresponds to the fibrosa layer. In the boxplots, data outliers are represented by a ‘ + ’ sign.
Figure 4
Figure 4
Bivariate correlation function C(Z, Z′) of collagen fiber alignment at different depths from the ventricular side, visualized as a color map for FED, BD and control group, where a value of 1 indicates a strong positive correlation and -1 a strong negative correlation. The blank area is due to missing information on one or more samples at that specific depth (see Fig. 5).
Figure 5
Figure 5
3D distribution map of collagen fiber content differentiated by angle (x-axis) and depth (y-axis) for (AJ) BD, (KT) FED and (UZ) the control group. F and G are from the same BD patient and Q and R are from the same FED patient. The order of the letters corresponds to the order of the patient IDs. For the control, U, W and Y are from the anterior leaflets of the first, second, and third subjects, respectively. V, X and Z, in turn, are from the posterior leaflets of the first, second, and third subjects, respectively.
Figure 6
Figure 6
Histopathological analysis of a representative (AD) control, (EH) FED and (IL) BD MVL samples and their respective collagen fiber alignment from SHG image processing. All the samples are from P2 segment. The histological sections are stained with (A, E, I) hematoxylin–eosin saffron (HES) for general examination, (B, F, J) Alcian Blue for glycosaminoglycans (GAGs), (C, G, K) Elastin for elastin fibers and (D, H, L) Masson Trichrome for collagen fibers. Superimposed tissue layer (SiT) is observed in the BD sample indicated with SiT, see (IL). Note that histological sections are sectioned transmurally for a side-view, while SHG examines the planar arrangement of collagen fibers in the orthogonal plane with respect to the histological sections. SHG imaging acquisition is performed on the side where histological sections are dissected to allow comparison between SHG and histological analyses. The scale bar is 200μm.
Figure 7
Figure 7
Illustration of the mitral valve showing the three scallops of the posterior leaflet (P1–P3) and the corresponding segments of the anterior leaflet (A1–A3). ALC refers to the anterolateral commissure and PMC refers to the posteromedial commissure.
Figure 8
Figure 8
(A) Acquisition of planar images of collagen fibers using second harmonic generation microscopy (SHG) throughout the thickness from the ventricular side, with a z-step of 5μm. (B) Corresponding SHG images showing collagen fibers at different depths. The scale bars are 100μm. (C) Quantitative analysis showing the distribution of collagen fibers, collagen content at a specific angle for each acquisition depth. (D) Applying the circular von Mises distribution to the collagen fiber distribution to parameterize it. (E) Illustration of collagen content with color and layering of various corresponding distributions to create a 3D distribution map of collagen fiber content differentiated by angle (x-axis) and depth (y-axis).

References

    1. Avierinos JF, et al. Natural history of asymptomatic mitral valve prolapse in the community. Circulation. 2002;106:1355–1361. doi: 10.1161/01.CIR.0000028933.34260.09. - DOI - PubMed
    1. Enriquez-Sarano M, Akins CW, Vahanian A. Mitral regurgitation. The Lancet. 2009;373:1382–1394. doi: 10.1016/S0140-6736(09)60692-9. - DOI - PubMed
    1. Delwarde C, et al. Genetics and pathophysiology of mitral valve prolapse. Front Cardiovasc. Med. 2023;10:1077788. doi: 10.3389/fcvm.2023.1077788. - DOI - PMC - PubMed
    1. Barber JE, et al. Mechanical properties of myxomatous mitral valves. J. Thoracic Cardiovasc. Surg. 2001;122:955–962. doi: 10.1067/mtc.2001.117621. - DOI - PubMed
    1. Sadeghinia MJ, et al. Mechanical behavior and collagen structure of degenerative mitral valve leaflets and a finite element model of primary mitral regurgitation. Acta Biomater. 2023;164:269–281. doi: 10.1016/j.actbio.2023.03.029. - DOI - PubMed

Supplementary concepts

LinkOut - more resources