. 2024 Aug;43(16):3523-3544.
doi: 10.1038/s44318-024-00163-9. Epub 2024 Jul 8.

The caspase-activated DNase promotes cellular senescence

Affiliations

The caspase-activated DNase promotes cellular senescence

Aladin Haimovici et al. EMBO J. 2024 Aug.

Abstract

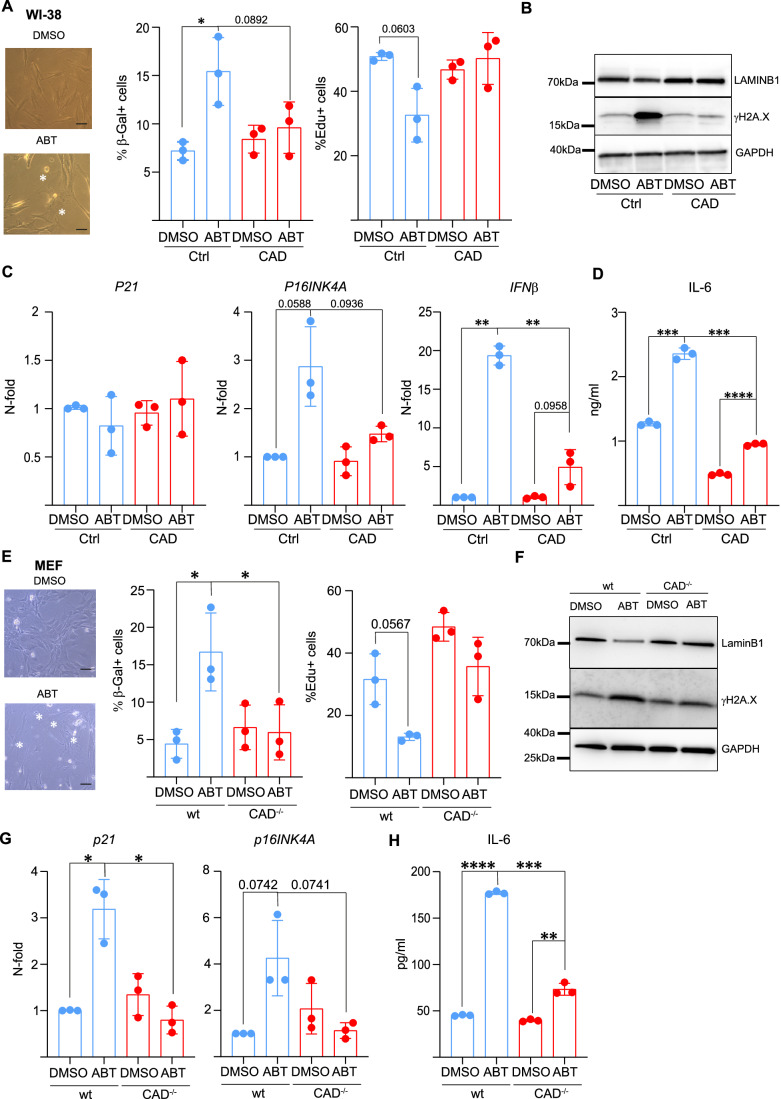
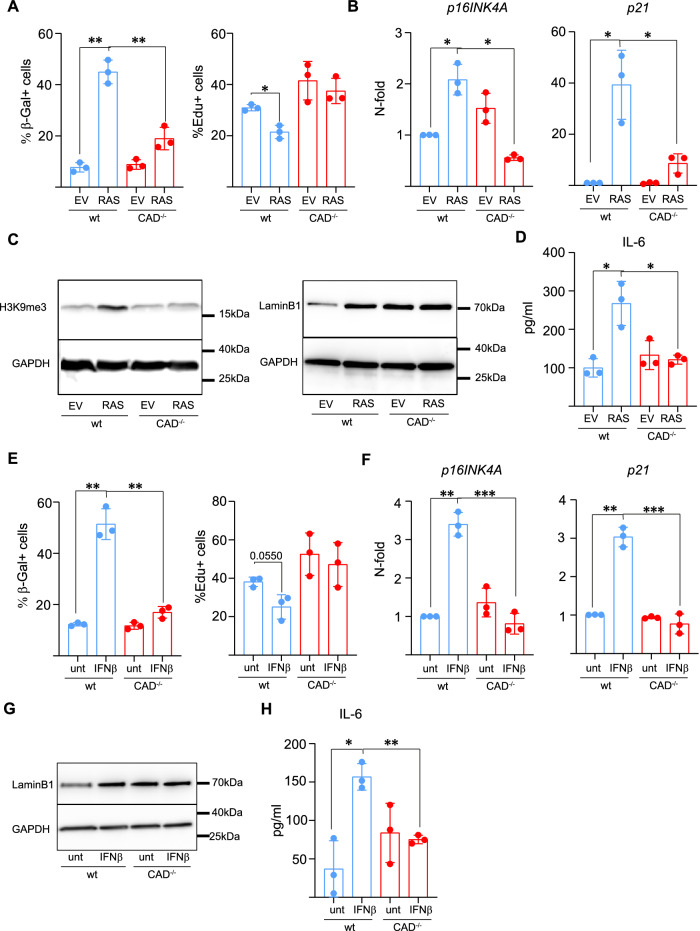
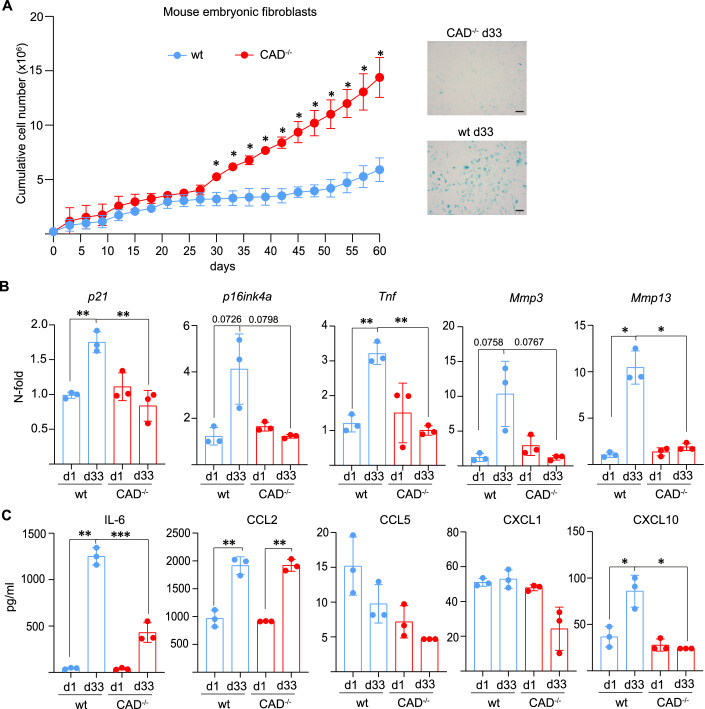
Cellular senescence is a response to many stressful insults. DNA damage is a consistent feature of senescent cells, but in many cases its source remains unknown. Here, we identify the cellular endonuclease caspase-activated DNase (CAD) as a critical factor in the initiation of senescence. During apoptosis, CAD is activated by caspases and cleaves the genomic DNA of the dying cell. The CAD DNase is also activated by sub-lethal signals in the apoptotic pathway, causing DNA damage in the absence of cell death. We show that sub-lethal signals in the mitochondrial apoptotic pathway induce CAD-dependent senescence. Inducers of cellular senescence, such as oncogenic RAS, type-I interferon, and doxorubicin treatment, also depend on CAD presence for senescence induction. By directly activating CAD experimentally, we demonstrate that its activity is sufficient to induce senescence in human cells. We further investigate the contribution of CAD to senescence in vivo and find substantially reduced signs of senescence in organs of ageing CAD-deficient mice. Our results show that CAD-induced DNA damage in response to various stimuli is an essential contributor to cellular senescence.

Keywords: Ageing; Apoptosis; Caspase-activated DNase; Senescence.


Conflict of interest statement

The authors declare no competing interests.

Figures

Figure 1
Figure 1. Sub-lethal activation of CAD can trigger senescence.
(A) WI-38 fibroblasts (carrying a non-targeting gRNA (Ctrl) or CAD-deficient) were treated with 5 µM ABT-737. Media was replaced with fresh ABT every 48 h over a period of 21 days. Bright-field images show cells after 21 days of ABT treatment. White stars highlight cells with enlarged and flat morphology. Scale bar: 50 µm. Cells were stained with β-galactosidase staining solution, and Edu and percentages of SA-β-Gal+ and Edu+ cells were quantified by microscopy. (B) Cells were treated as in (A). Lamin B1 and γH2A.X protein expression was analyzed by western blot. GAPDH was used as a loading control. (C) Expression of senescence-associated genes was measured by RT-PCR. (D) Supernatants from cells cultured for 21 days were analyzed by ELISA for IL-6. (E) MEF (from wild-type or CAD-deficient embryos) were treated as in (A), except the duration of the experiment was 7 days. Bright-field images show cells after 7 days of ABT treatment. White stars highlight cells with enlarge and flat morphology. Scale bar: 50 µm. Cells were stained with a β-galactosidase staining solution, and Edu, and percentages of SA-β-Gal+ and Edu+ cells were quantified by microscopy. (F) Lamin B1 and γH2A.X protein expression were analyzed by western blot. GAPDH was used as loading control. (G) Expression of senescence-associated genes was measured by RT-PCR. (H) Supernatants from cells cultured for 7 days were analyzed by ELISA for IL-6. Each symbol shows the result from one independent experiment. Data represent the mean/SD. An unpaired parametric t test (with Welch’s correction) was used to calculate statistical significance. *P < 0.05, **P < 0.01, ***P < 0.001, ****P < 0.0001. Source data are available online for this figure.
Figure 2
Figure 2. Induction of senescence by oncogenic RAS, and type-I interferon depends on CAD.
(AD) wt and CAD-deficient MEFs were transduced with empty retrovirus or pLNCX2-ER:H-RASG12V-virus and stimulated each day with tamoxifen to activate H-RASG12V. (A) Cells were stained with β-galactosidase and Edu staining solution and percentages of SA-β-Gal+ and Edu+ cells were quantified by microscopy after 10 days in culture. (B) Expression of senescence-associated genes 10 days after retroviral transduction. Gene expression was analyzed by RT-PCR and normalized to GAPDH. Relative expression compared to wt cells transduced with empty vector is shown. (C) Cells were lysed and western blot for H3K9me3 and Lamin B1 was performed. GAPDH was used as loading control. (D) Supernatants from cells cultured for 10 days post-transduction were analyzed by ELISA for IL-6. (EH) wt and CAD-deficient MEFs were treated daily with 10 ng/ml of IFN-β for 10 days. (E) Cells were stained with β-galactosidase and Edu staining solution and percentages of SA-β-Gal+ and Edu+ cells were quantified by microscopy after 10 days in culture. (F) Expression of senescence-associated genes was analyzed after 10 days in culture by RT-PCR. The expression relative to untreated wt cells is shown. (G) Cells were lysed and western blot for Lamin B1 was performed. GAPDH was used as loading control. (H) Supernatants from cells cultured for 10 days were analyzed by ELISA for IL-6. Data are the mean/SD of 3 independent experiments. Each symbol represents one experiment. Unpaired parametric t test (with Welch’s correction) was used to calculate statistical significance. *P < 0.05, **P < 0.01, ***P < 0.001. Source data are available online for this figure.
Figure 3
Figure 3. Deficiency in CAD accelerates spontaneous immortalization of mouse embryonic fibroblasts.
(A) Cell numbers of cultures of wild-type (wt) and CAD-deficient MEFs. Cells were counted and replated at the same cell number every 3 days, and cumulative cell numbers were calculated. Significant growth differences were detected after about 30 days of culture. Numbers are means/SD of three MEF preparations from individual mice for each genotype. Pictures show cells stained for β-galactosidase after 33 days of culture (scale bar: 50 µm). (B) Expression of senescence-associated genes analyzed at the start of the experiment (day 1) and after 33 days in culture. mRNA was extracted and gene expression was analyzed by RT-PCR. Gene expression was normalized to day 1 wt MEFs. (C) Supernatants from cells cultured from 33 days were analyzed by bead array for IL-6, CCL2, CCL5, CXCL1, and CXCL10. Data are from three pairs of MEFs derived from individual littermate embryos that were tested in parallel. Data are means/SD of three MEF preparations from individual mice for each genotype. Data represent means/SD. Unpaired parametric t test (with Welch’s correction) was used to calculate statistical significance. *P < 0.05, **P < 0.01, ***P < 0.001. Source data are available online for this figure.
Figure 4
Figure 4. Direct, isolated CAD activation leads to senescence in HaCaT cells.
(A) Treatment protocol to induce senescence in HaCaT-ICAD-mAID-GFP and HaCaT-ICAD-mAID-GFP cGAS-deficient cells. Stimulation with auxin (10 µM, 24 h) was conducted for 24 h every second day for 2 weeks, with 2 days recovery after the third stimulation. Cells were harvested 2 days after the last auxin treatment. (B) Representative microscopy pictures of HaCaT-ICAD-mAID-GFP cells after 2 weeks of auxin treatment. Cells were stained with β-galactosidase staining solution. Top panel shows a bright-field picture and bottom panel shows SA-β-Gal+ cells. Scale bar: 10 µm. Flat and enlarged cells (senescent phenotype) are marked by stars. SA-β-Gal+ and Edu+ cells were quantified by microscopy. Each symbol represents one separate experiment. (C) Lamin B1 protein expression was analyzed by western blot. GAPDH was used as loading control. (D) Gene expression was determined by PCR following the auxin treatment protocol in (A). Expression of P21, CXCL10, and IFNβ are shown. Expression is given as fold induction by auxin treatment. Each symbol represents one separate experiment. (E) Supernatants from the cells in (D) were analyzed by ELISA for IL-6. Each symbol represents one separate experiment. (FH) BJ human fibroblasts were incubated for 7 days with conditioned medium from HaCaT-ICAD-mAID-GFP cells subjected to the protocol in (A) or exposed to solvent (DMSO). Normal medium (NM) was used as a control. (F) Percentage of proliferating (Edu+) cells was quantified by microscopy from at least 500 cells per group. Each symbol represents one separate experiment. (G) γH2AX+ cells were quantified by microscopy from at least 500 cells per group. Each symbol represents one separate experiment. (H) Expression of lamin B1 was determined by immunofluorescence staining and analysis by confocal microscopy (CTCF, corrected total cell fluorescence of lamin B1-stain). Each symbol represents one separate experiment (B, DG) or one cell (H). Data are the means/SD. An unpaired parametric t test (with Welch’s correction) was used to calculate statistical significance. *P < 0.05, **P < 0.01, ***P < 0.001, ****P < 0.0001. Source data are available online for this figure.
Figure 5
Figure 5. CAD-deficient old mice show less markers of senescence in tissues than wt mice.
(A) SA-β-Gal expression in kidney cryosections from 75-week-old wt and CAD-deficient mice. Left, example of the microscopy (scale bar: 200 µm); right, quantification of the stain in five animals per group. The blue area was quantified by ImageJ. Each symbol represents one animal. (B) Percentage of Lamin B1- and Ki67-positive nuclei in kidneys of 75-week-old wt and CAD-deficient mice. Left, confocal microscopy pictures of kidney cryosection stained for Lamin B1 (green), Ki67 (red) and DAPI (blue). Right, quantification of Lamin B1- and Ki67-positive nuclei. Analysis was performed with ImageJ. Scale bar: 10 µm. (C) Expression of senescence-associated markers in kidney tissues. Gene expression was measured by RT-PCR. Kidney of 8–10-week-old animals (young) (n = 3) and 75-week-old animals (old) (n = 3) were analyzed. Each symbol represents one mouse. Data were normalized against young wild-type (average of 3 animals) with GAPDH used as a housekeeping gene. (D) Small intestine cryosections from 75-week-old wt or CAD-deficient mice were stained for expression of SA-β-Gal. Microscopic pictures of exemplary sections are shown. Scale bar: 20 µm. (E) Analysis of Lamin B1 degradation and Ki67 in small intestinal crypt of 75-week-old wt and CAD-deficient mice. Left, confocal microscopy pictures of small intestine cryosection stained for Lamin B1 (green), Ki67 (red) and DAPI (blue). Right, quantification of Ki67-positive nuclei per crypt and Lamin B1 CTCF per crypt. Analysis was performed with ImageJ. Scale bar: 10 µm. (F) Expression of senescence-associated genes in small intestine tissue samples. Gene expression was measured by RT-PCR and normalized as in (C). Young (8–10 weeks) (n = 3) and old (75 weeks) (n = 4) animals were investigated. Each symbol represents one mouse. Data represent the mean/SD. Unpaired parametric t test (with Welch’s correction) was used to calculate statistical significance. *P < 0.05, **P < 0.01. Source data are available online for this figure.
Figure EV1
Figure EV1. Sub-lethal CAD-activation.
(A) Percentage of viable cells after ABT treatment (48 h) were measured by flow cytometry (PI staining). For the experiments where CAD-deficient cells are used, cells were treated with 5 µM ABT. Each symbol shows the result from one independent experiment. Data represent the mean/SD. (B) Confirmation of CAD-deletion was measured by western blot. GAPDH is used as loading control. For the MEF, genotyping for CAD is shown. (C) WI-38 cells were treated with 5 µM ABT-737 for 48 h, in the presence or not of QVD (20 µM) or the ATM inhibitor Ku55933 (10 µM). γH2A.X protein expression was analyzed by western blot. GAPDH is used as loading control. Blot is representative of 3 independent experiments. Source data are available online for this figure.
Figure EV2
Figure EV2. Sub-lethal activation of CAD can trigger senescence.
(A) BJ fibroblasts (carrying a non-targeting gRNA (Ctrl) or CAD-deficient) were treated with 5 µM ABT-737. Media was replaced with fresh ABT every 48 h over a period of 21 days. Bright-field images show cells after 21 days of ABT treatment. White stars highlight cells with enlarge and flat morphology. Scale bar: 50 µm. Cells were stained with β-galactosidase staining solution and Edu and percentages of SA-β-Gal+ and Edu+ cells were quantified by microscopy. (B) Cells were treated as in (A). Lamin B1 and γH2A.X protein expression was analyzed by western blot. GAPDH was used as loading control. (C) Expression of senescence-associated genes was measured by RT-PCR. (D) Supernatants from cells cultured for 21 days were analyzed by ELISA for IL-6 and IL-8. (E) MDA-MB-231 cells (carrying a non-targeting gRNA (Ctrl) or CAD-deficient) were treated with 10 µM ABT-737 for 24 h, washed and incubated for 7 days in normal media. Bright-field images show cells after 7 days of ABT treatment. Scale bar: 50 µm. White stars highlight cells with enlarge and flat morphology. SA-β-Gal activity was measured using Spider-Gal. Proliferation was measured with Edu incorporation. Percent positive cells are shown. (F) Lamin B1 and γH2A.X protein expression was analyzed by western blot. GAPDH was used as loading control. (G) Expression of senescence-associated genes was measured by RT-PCR. Each symbol shows the result from one independent experiment. Data represent the mean/SD. Unpaired parametric t test (with Welch’s correction) was used to calculate statistical significance. *P < 0.05, **P < 0.01, ***P < 0.001. Source data are available online for this figure.
Figure EV3
Figure EV3. CAD-activation may contribute to doxorubicin-induced senescence.
(A) MDA-MB-231 cells (carrying a non-targeting gRNA (Ctrl) or CAD-deficient) were treated with 50 nM Doxorubicin for 24 h. Medium was replaced and cells were incubated for 7 days. Bright-field images show cells after 7 days of Doxorubicin treatment. White stars highlight cells with enlarge and flat morphology. Scale bar: 50 µm. Cells were stained with β-galactosidase and Edu staining solution and percentages of SA-β-Gal+ and Edu+ cells were quantified by microscopy. (B) Lamin B1 protein expression was analyzed by western blot. GAPDH was used as loading control. (C) Expression of senescence-associated genes was measured by RT-PCR. (D) WI-38 cells (carrying a non-targeting gRNA (Ctrl) or CAD-deficient) were treated with 250 nM Doxorubicin for 24 h. Medium was replaced and cells were incubated for 7 days. Bright-field images show cells after 7 days of Doxorubicin treatment. White stars highlight cells with enlarge and flat morphology. Scale bar: 50 µm. Cells were stained with β-galactosidase and Edu staining solution and percentages of SA-β-Gal+ and Edu+ cells were quantified by microscopy. (E) Lamin B1 protein expression was analyzed by western blot. GAPDH was used as loading control. (F) Expression of senescence-associated genes was measured by RT-PCR. (G) MDA-MB-231 cells were treated as in (A), in presence or absence of QVD or ATM inhibitor. P21 expression was measured by RT-PCR after 7 days of treatment. Each symbol shows the result from one independent experiment. Data represent the mean/SD. Unpaired parametric t test (with Welch’s correction) was used to calculate statistical significance. *P < 0.05, **P < 0.01, ***P < 0.001, ****P < 0.0001. Source data are available online for this figure.
Figure EV4
Figure EV4. A CAD-induced DDR at telomeres.
(A) Representative fluorescent images of BJ fibroblasts after incubation with normal media (NM), DMSO or Auxin condition media. Cells were stained for Edu, γH2A.X and DAPI. Scale bar: 10 µm. (B) HaCaT-ICAD-mAID-GFP cells were treated with auxin for 6 h, fixed and stained for 53BP1 (DDR) with DAPI (DNA). Scale bar: 10 µm. (C) HaCaT-ICAD-mAID-GFP cells were treated with auxin for 6 h, fixed and stained for 53BP1 (DDR), for telomeres (using a telomere-specific DNA-probe) and with DAPI (DNA). Images are maximum intensity projections of at least 20 planes. Amplified images on the right (* and **) are from single Z planes where colocalization (*)/close proximity (**) was found. Frequencies of TAF in HaCaT-ICAD-mAID-GFP cells and control cells (HaCaT cells expressing only the Tir1 F-box protein but not the degradable ICAD; see “Methods”) upon auxin treatment for 6 h is shown. Results are expressed as percentage of 53PB1 foci that co-localized with the telomere probe. Symbols show results from independent experiments. Data represent the mean/SD. (D) Relative telomere length in HaCaT-ICAD-mAID-GFP and HaCaT-ICAD-mAID-GFP CAD-deficient treated with DMSO or auxin for 6 h. Symbols show results from independent experiments (n = 3). Data represent the mean/SD. Unpaired parametric t test (with Welch’s correction) was used to calculate statistical significance. *P < 0.05. Source data are available online for this figure.
Figure EV5
Figure EV5. Small intestinal organoids, adipose tissue and liver were isolated from old (75 weeks) wt and CAD-deficient mice.
(A) Exemplary organoids (left) and quantification of organoid size (right) after 5 days in culture are shown. Scale bar: 10 µm. Each symbol shows the size of one organoid. Twenty organoids per group were measured. Data represent the mean/SD. (B) Fifty intestinal crypts were seeded per intestine and the percentage of organoids forming after 5 days were quantified. Each symbol represents one mouse/intestine. Data represent the mean/SD. (C) Organoids were subjected to staining for SA-β-Gal using Spider-gal. Percentage of organoids staining positive for each mouse are given. Each symbol represents one mouse/intestine (n = 3 mice per group). Data represent the mean/SD. Unpaired parametric t test (with Welch’s correction) was used to calculate statistical significance. *P < 0.05, **P < 0.01. (D) Inguinal white adipose tissue (iWAT) was isolated from three young and three old mice of each genotype. Tissues were stained for SA-β-Gal activity. Image is representative of 4 stained WAT tissues per group. (E) Expression of senescence-associated genes from iWAT samples. Gene expression was measured by RT-PCR. Young (8–10 weeks) (n = 3) and old (75 weeks) (n = 3) mice per genotype were analyzed. Data represent the mean/SD. (F) Liver cryosections from 75-week-old mice were stained for SA-β-Gal activity and the positive area was measured by microscopy (left panel). Each symbol represents one mouse. Expression of senescence-associated genes in liver samples (right panel). Gene expression was measured by RT-PCR. Young (8–10 weeks) (n = 3) and old (75 weeks) (n = 3) animals were analyzed. Each symbol represents one mouse. Data represent the mean/SD. Unpaired parametric t test (with Welch’s correction) was used to calculate statistical significance. *P < 0.05. Source data are available online for this figure.

References

    1. Baker DJ, Wijshake T, Tchkonia T, LeBrasseur NK, Childs BG, van de Sluis B, Kirkland JL, van Deursen JM (2011) Clearance of p16Ink4a-positive senescent cells delays ageing-associated disorders. Nature 479:232–236 10.1038/nature10600 - DOI - PMC - PubMed
    1. Benada J, Alsowaida D, Megeney LA, Sorensen CS (2023) Self-inflicted DNA breaks in cell differentiation and cancer. Trends Cell Biol 33:850–859 10.1016/j.tcb.2023.03.002 - DOI - PubMed
    1. Brokatzky D, Dorflinger B, Haimovici A, Weber A, Kirschnek S, Vier J, Metz A, Henschel J, Steinfeldt T, Gentle IE et al (2019) A non-death function of the mitochondrial apoptosis apparatus in immunity. EMBO J 38:e102325 10.15252/embj.2018100907 - DOI - PMC - PubMed
    1. Bussian TJ, Aziz A, Meyer CF, Swenson BL, van Deursen JM, Baker DJ (2018) Clearance of senescent glial cells prevents tau-dependent pathology and cognitive decline. Nature 562:578–582 10.1038/s41586-018-0543-y - DOI - PMC - PubMed
    1. Canli O, Nicolas AM, Gupta J, Finkelmeier F, Goncharova O, Pesic M, Neumann T, Horst D, Lower M, Sahin U et al (2017) Myeloid cell-derived reactive oxygen species induce epithelial mutagenesis. Cancer Cell 32:869–883.e5 10.1016/j.ccell.2017.11.004 - DOI - PubMed

LinkOut - more resources