. 2024 Aug;9(8):2022-2037.
doi: 10.1038/s41564-024-01752-4. Epub 2024 Jul 8.

Environmentally dependent interactions shape patterns in gene content across natural microbiomes

Affiliations

Environmentally dependent interactions shape patterns in gene content across natural microbiomes

Kyle Crocker et al. Nat Microbiol. 2024 Aug.

Erratum in

Abstract

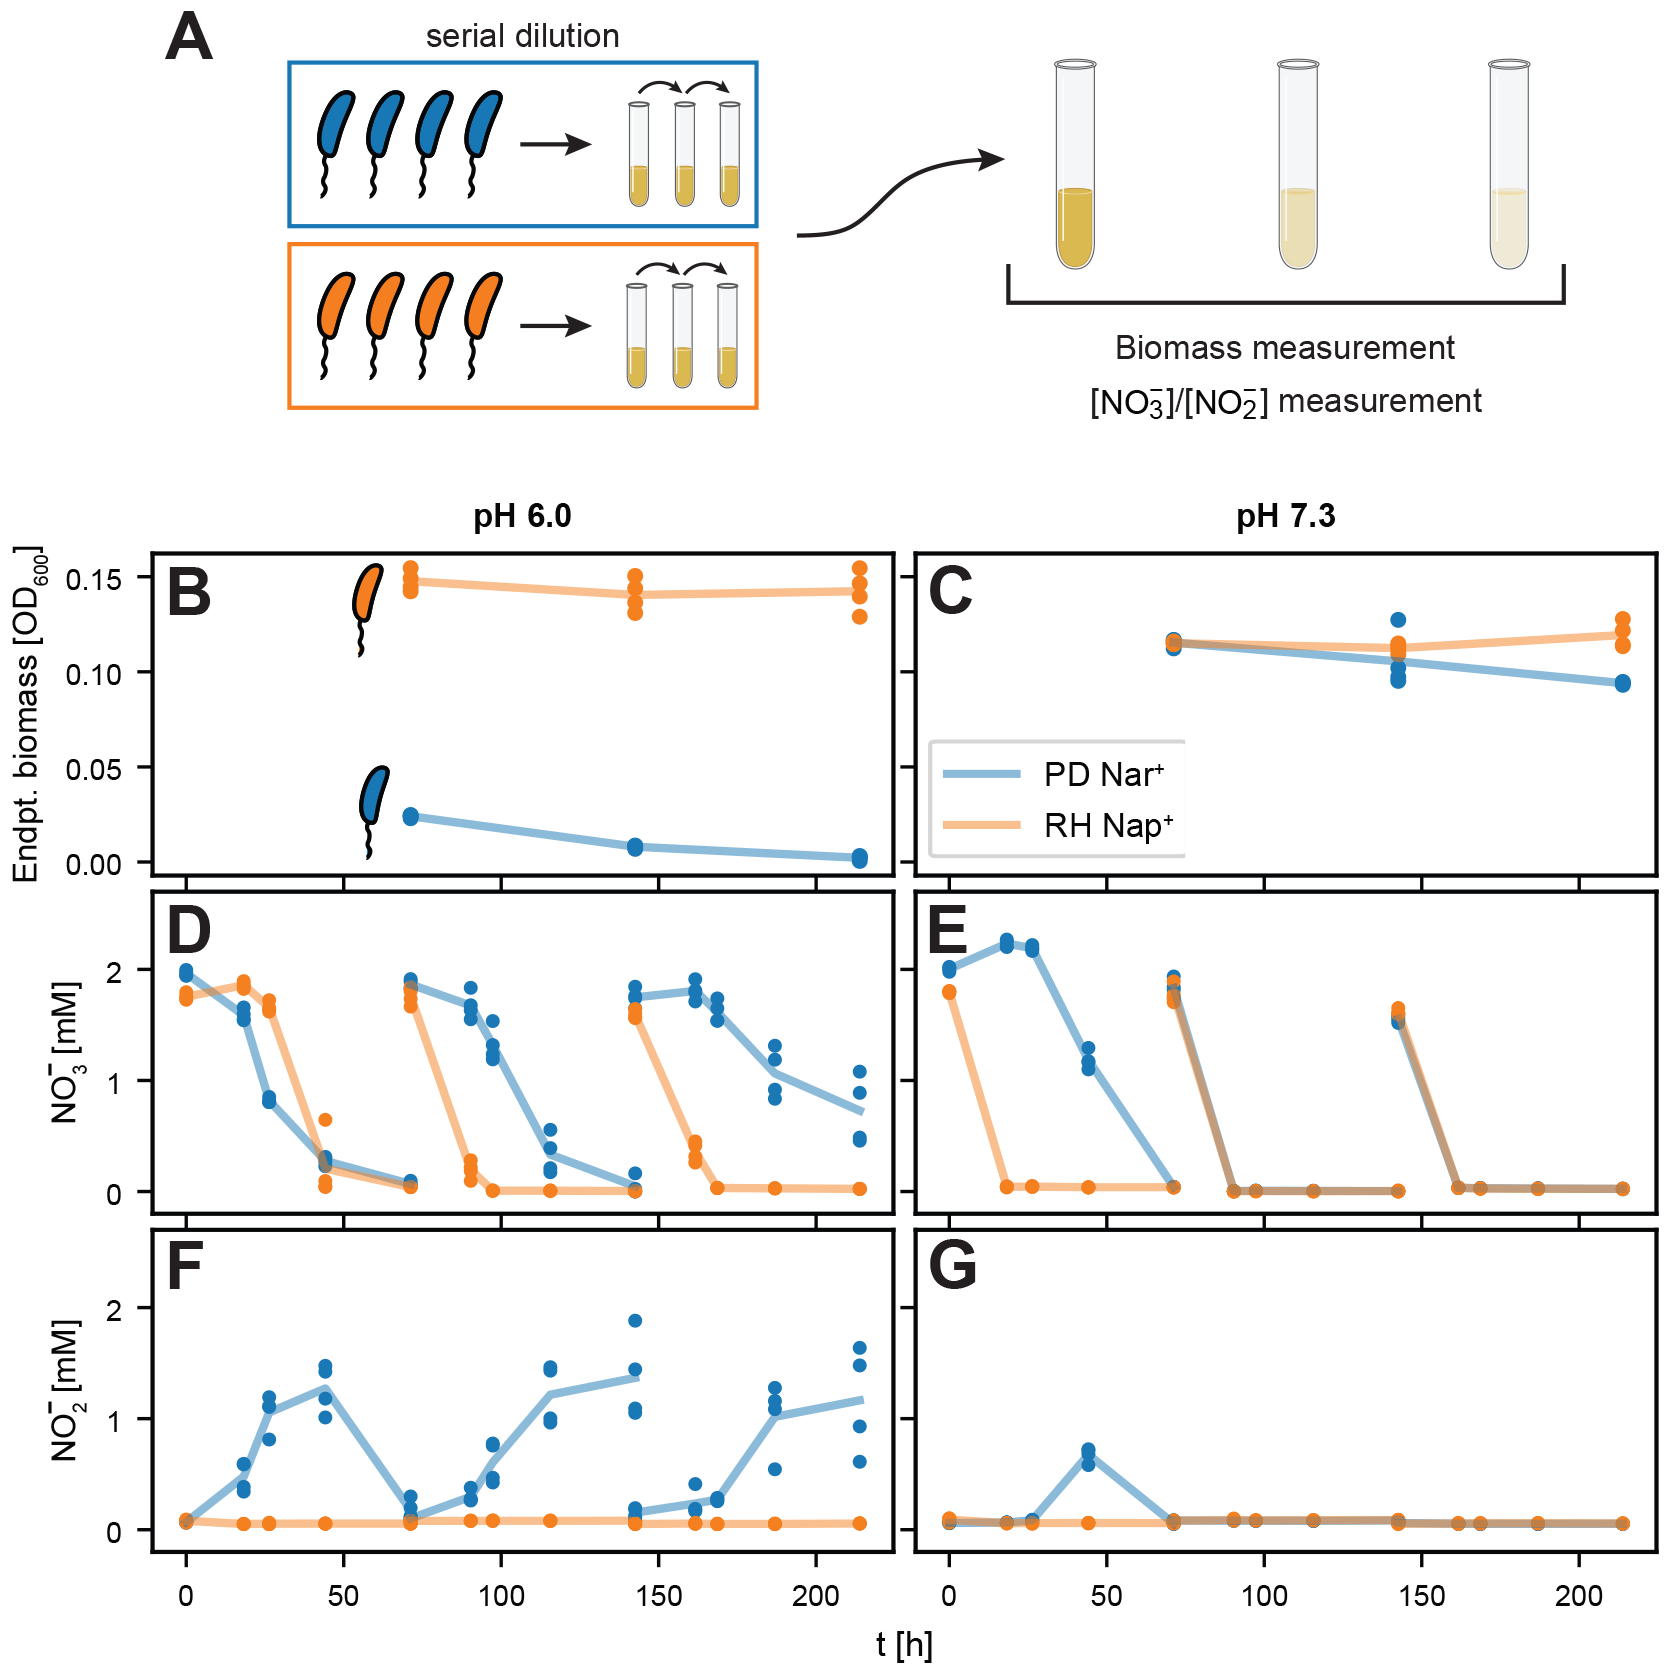
Sequencing surveys of microbial communities in hosts, oceans and soils have revealed ubiquitous patterns linking community composition to environmental conditions. While metabolic capabilities restrict the environments suitable for growth, the influence of ecological interactions on patterns observed in natural microbiomes remains uncertain. Here we use denitrification as a model system to demonstrate how metagenomic patterns in soil microbiomes can emerge from pH-dependent interactions. In an analysis of a global soil sequencing survey, we find that the abundances of two genotypes trade off with pH; nar gene abundances increase while nap abundances decrease with declining pH. We then show that in acidic conditions strains possessing nar fail to grow in isolation but are enriched in the community due to an ecological interaction with nap genotypes. Our study provides a road map for dissecting how associations between environmental variables and gene abundances arise from environmentally modulated community interactions.


Figures

Extended Data Figure 1:
Bars show the loadings of each gene in the six principal components (PCs) resulting from the uiSVD decomposition of denitrification reductase (narG, napA, nirS, nirK, norB, nosZ) relative abundances from the global topsoil microbiome.
Extended Data Figure 2:
Unit-invariant singular value decomposition (uiSVD) was used to decompose denitrification reductase (narG, napA, nirS, nirK, norB, nosZ) relative abundances from the global topsoil microbiome into contributions due to pathway magnitude and composition (Fig. 1A-D). Pathway magnitude (d) most strongly correlated with C/N ratio ( ρ=0.59, p<106 via one-tailed randomization test; Fig. 1F).
Extended Data Figure 3:
Additional enrichments were performed at pH 5.0, 5.5, 6.0, and 7.3 and the endpoint cultures were shotgun sequenced to infer taxonomic composition and genotypes. (A) Endpoint community compositions of the enrichments inferred via 16S miTAGs are shown. Taxa with Nar+ genotypes are indicated in shades of blue, while taxa that possess Nap and not Nar are indicated in shades of red. Compositions are shown at the level of taxonomic order, and taxa present at a level of less than 1% are omitted. (B) Median denitrification reductase genotypes inferred via annotation of metagenome assembled genomes are shown.
Extended Data Figure 4:
(A)-(H) Consumer resource model (Supplementary Information Eq. S1) fit to monoculture metabolite data at pH 7.3. Dots indicate nitrate concentrations, stars indicate nitrite concentrations, solid lines show fits to nitrate dynamics, and dash-dot lines show fits to nitrite dynamics. All concentrations are averaged over biological replicates (n = 3). Panels (A, C, E, G) are fits to PD Nar+ data, while panels (B, D, F, H) are fits to RH Nap+ data. To infer nitrate and nitrite reduction rates independently fits were performed for a number of different initial conditions ([NO−3], [NO−2]). Panels (A) and (B) correspond to (1.75, 0), (C) and (D) to (0.875, 0), (E) and (F) to (0.4375, 1.3125), (G) and (H) to (0.875, 0.4375). All concentrations are reported in units of mM. (I) Co-culture relative abundance prediction based on monoculture phenotypes. RH Nap+ is predicted to approach a relative abundance of 1 for all initial conditions at pH 7.3. This is consistent with what was observed in enrichment experiments (Fig. 5F).
Extended Data Figure 5:
Details of the PD Nar+ and RH Nap+ co-culture experiment shown in Fig. 5. (A) PD Nar+ relative abundance dynamics at pH 6.0 are shown. f0,Nar+=0,0.03,0.5,0.97 and 1 are highlighted. Due to small levels of cross-contamination between pure and mixed cultures, fNar+ increases from 0 and decreases from 1. Although this was unintentional, it indicates that each of these strains is invasible by the other in this condition, providing more evidence that they coexist. (B) PD Nar+ relative abundance dynamics at pH 7.3 are shown. In panels A and B, data points are means of biological replicates (n = 4 for PD Nar+ relative abundance >= 0.5 at pH 6 and relative abundance <= 0.03 and = 1 in both pH conditions; n = 3 for all other conditions) of inferred relative abundances (Methods) and errorbars are calculated as described in the Fig. 5 caption and Methods. (C) Endpoint biomass dynamics, measured via absorbance at 600 nm, are shown for each cycle at pH 6.0. The f0,Nar+=0 condition produces much less biomass than the other conditions, as expected. (D) Endpoint biomass dynamics are shown for each cycle at pH 7.3. (E, G) NO−3 and NO−2 dynamics are measured using a Griess assay (117) and shown at pH 6.0. Aside from the f0,Nar+=0 condition, for which biomass is very low (panel C), increasing fNar+ (panel A) corresponds to increasing nitrite accumulation. (F, H) Metabolite dynamics are shown at pH 7.3. Decreasing fNar+ (B) corresponds to decreasing nitrite accumulation. Points and error bars in panels C-H show means and standard deviations over biological replicates (n = 4 for PD Nar+ relative abundance >= 0.5 at pH 6 and relative abundance <= 0.03 and = 1 in both pH conditions; n = 3 for all other conditions) in each condition.
Figure 1:
Figure 1:. pH is associated with covariation in denitrification pathway composition in the global topsoil microbiome.
(A) Topsoils sampled at n = 189 globally-distributed sites were chemically characterized (pH, Ca, Mg, …), sequenced via shotgun metagenomics, and functionally annotated by Bahram et al. (4). (B) The relative abundance of denitrification reductases in each soil sample (relative to total gene content) are plotted in order of increasing total relative abundance. Reductase color legend indicated in panel A. (C-D) Unit-invariant singular value decomposition (uiSVD) (32) was used to decompose the data in panel B into contributions due to pathway magnitude (di) and pathway composition (ci). The results of this decomposition are plotted in panel D. (E-F) Principal component (PC) scores for pathway composition and pathway magnitudes obtained via uiSVD (Methods) are compared with 17 environmental variables, and squared Pearson correlation coefficients are shown. Scores of PC2 are most correlated with pH (ρ = 0.64, p < 10−6 via one-tailed randomization test; panel G), while pathway magnitude is most correlated with C/N ratio (ρ = −0.59, p < 10−6 via one-tailed randomization test; Extended Data Fig. 2). (H) Loadings of PC2 are shown, where positive values indicate reductase content that increases with pH, and vice versa. See also Extended Data Figs. 1, 2.
Figure 2:
Figure 2:. Enrichment cultures reproduce patterns in denitrification gene content in the topsoil microbiome.
(A) Denitrifying communities were enriched from soil samples in two pH conditions (6.0 and 7.3), and then sequenced via shotgun metagenomics to measure taxonomic composition and genotypes. Six soil samples were mechanically homogenized and used to inoculate a serial dilution experiment in denitrifying (anaerobic) conditions. After 72 h growth cycles, cultures were repeatedly passaged (12×) into a defined medium containing 1.75 mm nitrate via a 1/8 dilution factor (Methods). (B) Endpoint community compositions are shown at the level of taxonomic order for enrichments in pH 6.0 and 7.3. Compositions were determined by extracting 16S rRNA fragments (miTAGs) from shotgun metagenome data (73), and then taxonomically annotating miTAGs via RDP (76). Taxa present at a relative abundance less than 1% are omitted. (C) Median denitrification reductase genotypes are shown for metagenome-assembled genomes (MAGs) corresponding to the four most abundant taxa present in the composition data in panel B. MAGs were functionally annotated using RAST (82), and the median genotype was computed over MAGs obtained in different samples. (D) Strains were isolated from cryopreserved samples from the enrichment endpoint (Methods). The strain Pseudomonas sp. PD Nar+ represents the dominant taxa present across samples at pH 6.0, and Rhizobiales sp. RH Nap+ represents the dominant taxa across samples at pH 7.3. See also Fig. S6, Extended Data Fig. 3.
Figure 3:
Figure 3:. Individual traits do not explain the outcome of acidic enrichments.
(A) Schematic of the experimental design. PD Nar+ (blue) and RH Nap+ (orange) were passaged repeatedly in monoculture under denitrifying (anaerobic) conditions. After each 72 h growth cycle, cultures were passaged (3×) into a defined medium containing 1.75 mm nitrate using a 1/8 dilution factor. Biomass is measured via 600 nm absorbance at the end of each cycle, and nitrate and nitrite concentrations are measured throughout each cycle using a Griess assay (Methods). (B and C) Endpoint biomass is shown for each strain at both pH 6.0 (panel B) and 7.3 (panel C). Lines connect the average across replicates. RH Nap+ (orange) produces more biomass at both pH levels, while PD Nar+ (blue) appears to decay in abundance at pH 6.0 (despite PD Nar+ community enrichment in this condition, Fig. 2B). (D-G) Nitrate and nitrite concentration dynamics are shown at six timepoints throughout each cycle in each condition. PD Nar+ nitrate and nitrite reduction rates slow at pH 6.0 as the growth-dilution cycles progress, consistent with its reduction in biomass (Panels D & F, blue). PD Nar+ (blue) accumulates nitrite at each pH condition, whereas RH Nap+ (orange) does not (Panels F & G). Biological replicates (n = 4) are shown for each strain in each experimental condition, with lines connecting the averages of these replicates.
Figure 4:
Figure 4:. Nitrite toxicity impacts denitrification activity of isolates at low pH.
(A) PD Nar+ and RH Nap+ were grown in monoculture under anaerobic conditions at pH 6.0 with 1.75 mm nitrate and varying nitrite levels indicated by colors shown in the legend. The dynamics of nitrate and nitrite concentrations are shown for each strain. The growth of both strains was increasingly inhibited as the initial supply of nitrite ([NO2]0) increased. PD Nar+ was unable to fully reduce nitrate when [NO2]0 > 0.35 mm (blue and green curves, top left panel) and was unable to fully reduce nitrite when [NO2]0 > 0 mm (all except dark purple curve, bottom left panel). Similarly, RH Nap+ was unable to fully reduce either nitrate or nitrite when [NO2]0 > 0.35 mm (blue and green curves, right panels). The mean and standard deviation of biological replicates (n = 3) are shown. (B) PD Nar+ and RH Nap+ were again grown in anaerobic monoculture at pH 6.0 with varying nitrite levels; nitrate was not supplied to prevent growth (Methods). The density of colony-forming units was measured via plating with replicates (n = 3) for each condition, with points indicating means across replicates. Error bars were calculated by weighting across dilution levels, as described in Methods. Lines are log-linear fits, and the (negative) slope of the line indicates the mortality rate (Methods). For PD Nar+, inferred death rates were 0.008 ± 0.004, 0.023 ± 0.004, and 0.039 ± 0.004 h−1 for [NO2]0 = 0, 0.875, and 1.75 mm, respectively. For RH Nap+, inferred death rates were 0.013 ± 0.004, −0.001 ± 0.001, and 0.007 ± 0.001 h−1 for [NO2]0 = 0, 0.875, and 1.75 mm, respectively. Uncertainties indicate standard deviations of log-linear fit parameters. (C) Nitrate (top) and nitrite (bottom) metabolite dynamics for monocultures of PD Nar+, supplied with initial nitrate concentrations of 0.875 mm (light blue) and 1.75 mm (dark blue). Inset in the bottom panel shows the change in optical density during the 72 h growth cycle (ΔOD=ODfODi); endpoint biomass levels were greater in the 0.875 mm nitrate condition than in the 1.75 mm condition, suggesting mortality induced by nitrite accumulation. A consumer-resource model was fit to the low nitrate condition (solid light blue lines) and used to predict high nitrate condition (dashed dark blue lines). The mean and standard deviation of biological replicates (n = 3) of the data are shown.
Figure 5:
Figure 5:. Coculture alleviates nitrite toxicity under acidic conditions.
(A-B) Monoculture PD Nar+ growth metabolite dynamics (shown previously in Fig. 4C) compared with the those of a 1:1 PD Nar+ and RH Nap+ co-culture at pH 6.0. Panel A shows nitrate concentration and panel B shows nitrite concentration. Initial biomass (OD600 = 0.01) and nitrate (1.75 mm) was the same in each condition, but the co-culture (purple) exhibited significantly less nitrite accumulation despite only slightly decreased nitrate reduction rate, as well as significantly higher biomass production (purple bar, inset, panel B). Points and error bars indicate the means and standard deviations, respectively, across biological replicates (n = 3). (C) Schematic of proposed interaction between PD Nar+ and RH Nap+. (D) Schematic illustrating the multi-cycle co-culture experiment shown in panels E and F. Mixtures of PD Nar+ and RH Nap+ were prepared across a range of ratios spanning 0.03:0.97 to 0.97:0.03 (distinguished by color), with total biomass held constant. These mixtures were then transferred to fresh media buffered at pH 6.0 or pH 7.3, with 2 mm nitrate supplied. Cultures were grown under anaerobic conditions for 72 h and passaged 1:8 into fresh media for a total of four growth cycles. 16S amplicon sequencing was used to infer PD Nar+ relative abundance at the end of each cycle in pH 6.0 conditions, and at the end of four cycles in pH 7.3 (Fig. S7, Methods). (E) PD Nar+ relative abundance dynamics at pH 6.0 are shown. fNar+,0 = 0.03, 0.5, and 0.97 are highlighted by darker lines. (F) PD Nar+ relative abundance dynamics at pH 7.3 are shown. Relative abundance values in panels E and F are the means of inferred relative abundances across biological replicates (n = 4 for PD Nar+ relative abundance >= 0.5 at pH 6 and relative abundance = 0.03 in both pH conditions; n = 3 for all other conditions). Errorbars are calculated by adding the errors due to inference of amplification bias during sequencing and variance between biological replicates in quadrature (see Methods for detail).
Figure 6:
Figure 6:. Nar+ and Nap+ phenotypes are conserved across diverse taxa.
Additional Nar+ and Nap+ soil isolates were grown in anaerobic conditions at pH 6.0, and their denitrification phenotypes were measured. (A) Denitrification phenotypes were summarized by area under the nitrate (top) and nitrite (bottom) curves (AUC). Metabolite dynamics for PDM04 Nar+ (blue) and XNM01 Nap+ (orange) monocultures are shown, with area under the curve (AUC) for each metabolite illustrated by the colored shaded regions. Smaller AUC indicates faster metabolite reduction. (B) AUC for nitrate (top) and nitrite (bottom) for three Nar+ and four Nap+ strains isolated in Ref. . Nar+ strains exhibit faster nitrate reduction (blue bars, top panel) and slower nitrite reduction (blue bars, bottom panel), and Nap+ strains are the opposite. The height of the bar corresponds to the mean AUC across biological replicates (n = 2).

Update of

Similar articles

Cited by

References

    1. Falkowski PG, Fenchel T & Delong EF The microbial engines that drive Earth’s biogeochemical cycles. Science 320, 1034–1039 (2008). URL 10.1126/science.1153213. - DOI - PubMed
    1. Song W et al. Functional traits resolve mechanisms governing the assembly and distribution of nitrogen-cycling microbial communities in the global ocean. mBio 13, e03832–21 (2022). - PMC - PubMed
    1. Wang C.-y. et al. Soil ph is the primary factor driving the distribution and function of microorganisms in farmland soils in northeastern china. Annals of Microbiology 69, 1461–1473 (2019).
    1. Bahram M et al. Structure and function of the global topsoil microbiome. Nature 560, 233–237 (2018). URL 10.1038/s41586-018-0386-6. - DOI - PubMed
    1. Malik AA, Thomson BC, Whiteley AS, Bailey M & Griffiths RI Bacterial physiological adaptations to contrasting edaphic conditions identified using landscape scale metagenomics. mBio 8, e00799–17 (2017). - PMC - PubMed

LinkOut - more resources