. 2024 Aug;16(8):1930-1956.
doi: 10.1038/s44321-024-00096-0. Epub 2024 Jul 8.

Pharmacological Gq inhibition induces strong pulmonary vasorelaxation and reverses pulmonary hypertension

Affiliations

Pharmacological Gq inhibition induces strong pulmonary vasorelaxation and reverses pulmonary hypertension

Alexander Seidinger et al. EMBO Mol Med. 2024 Aug.

Abstract

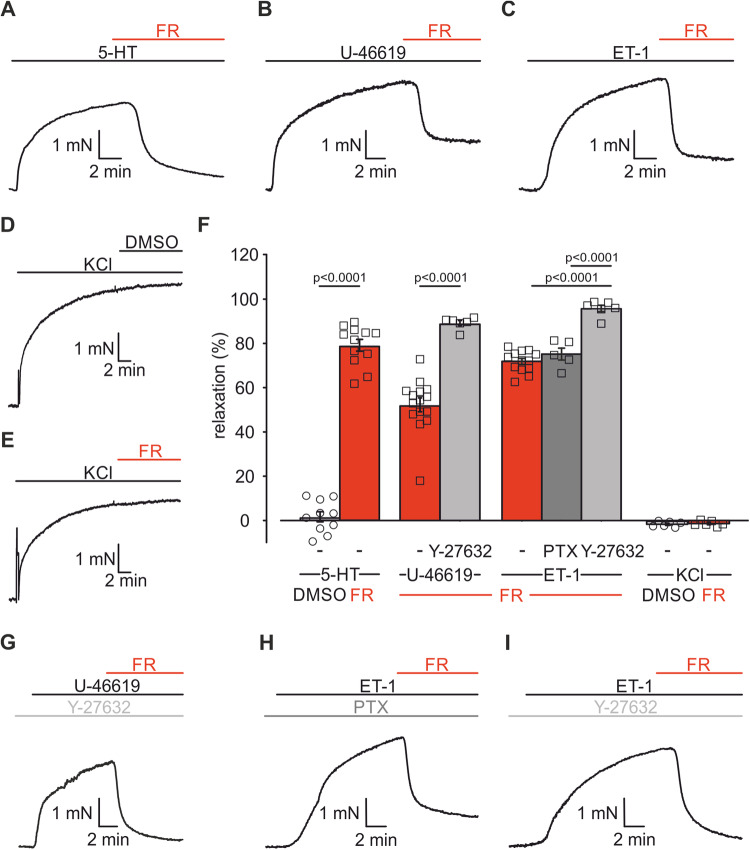
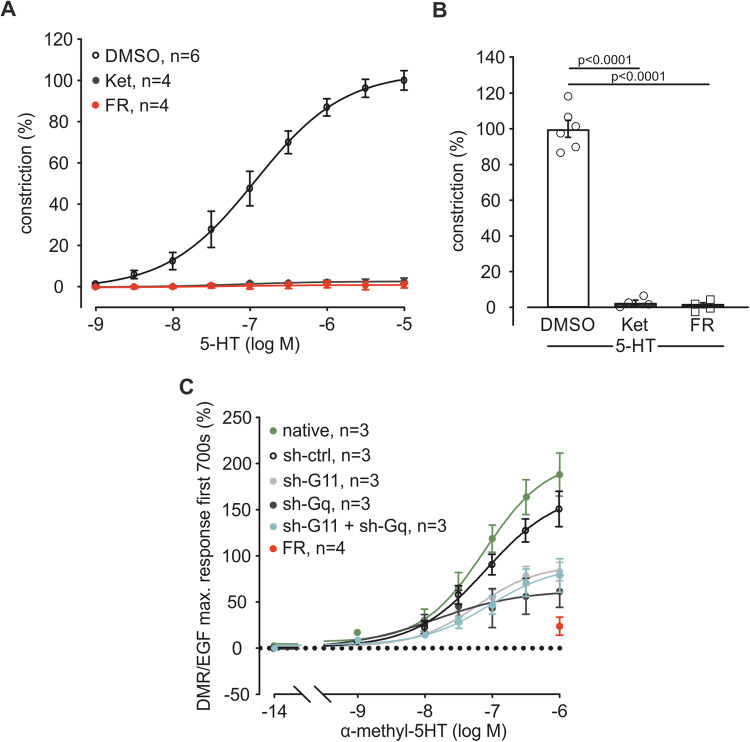
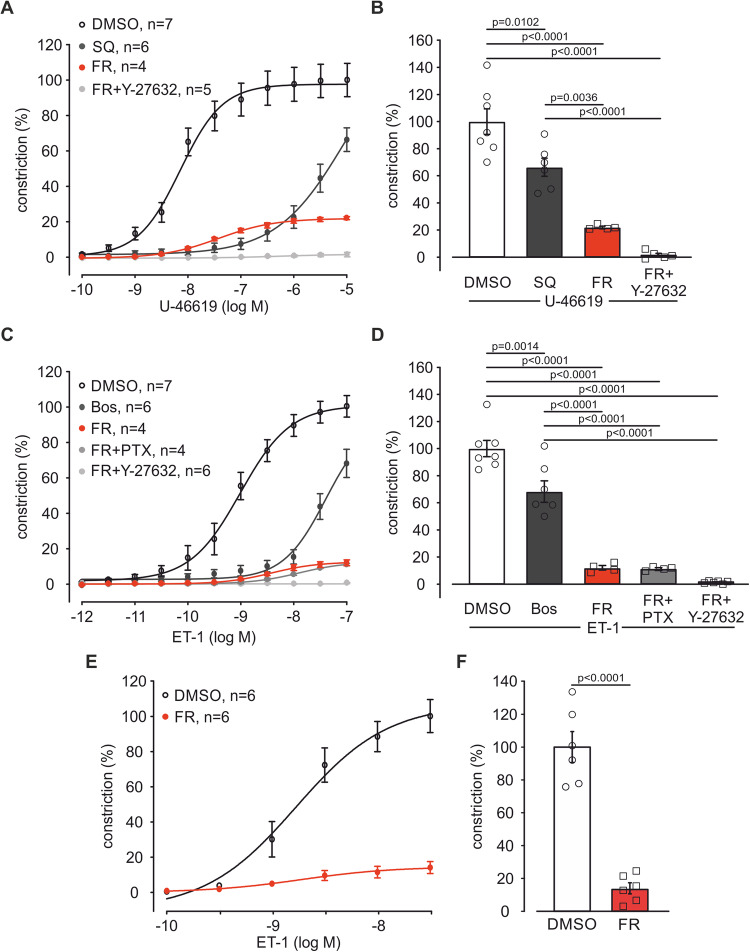
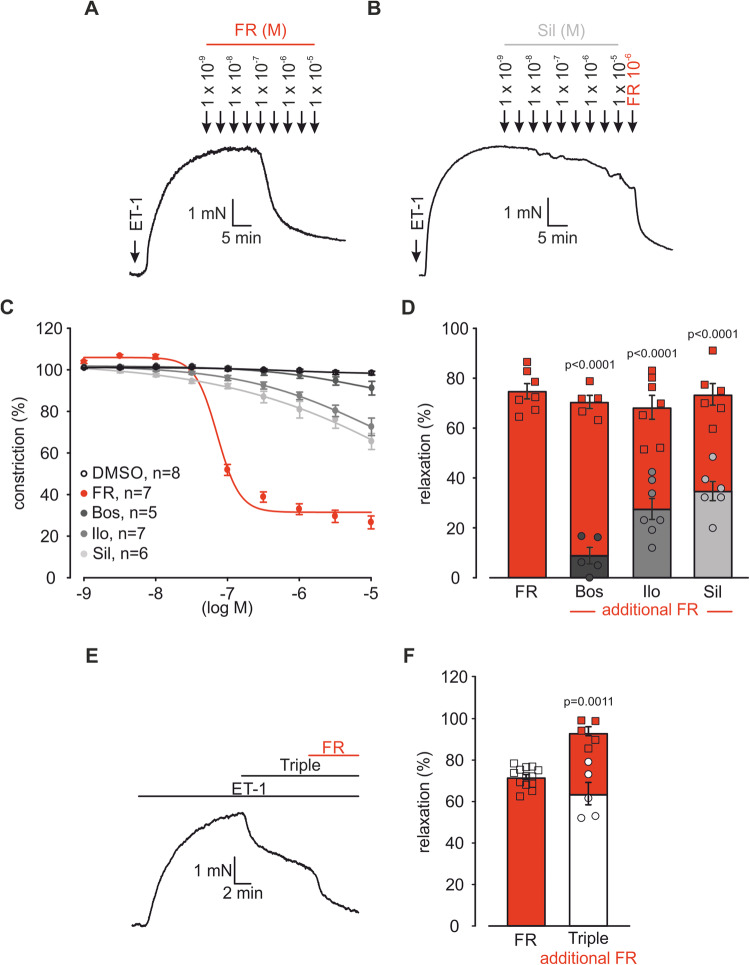
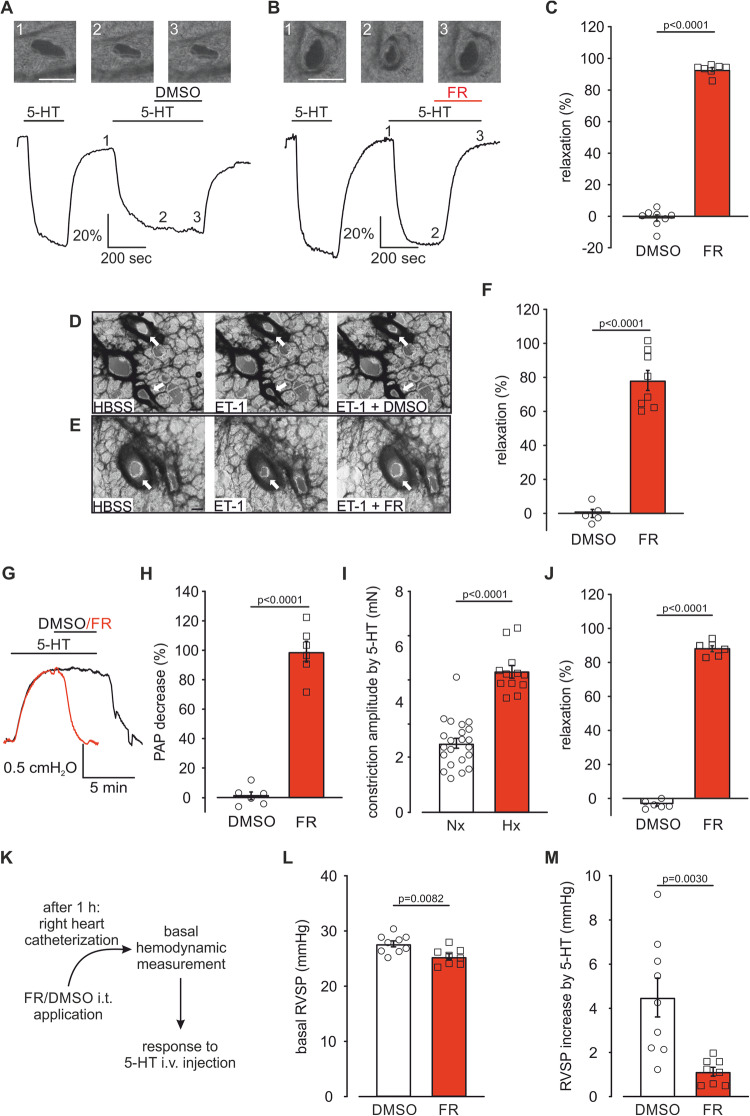
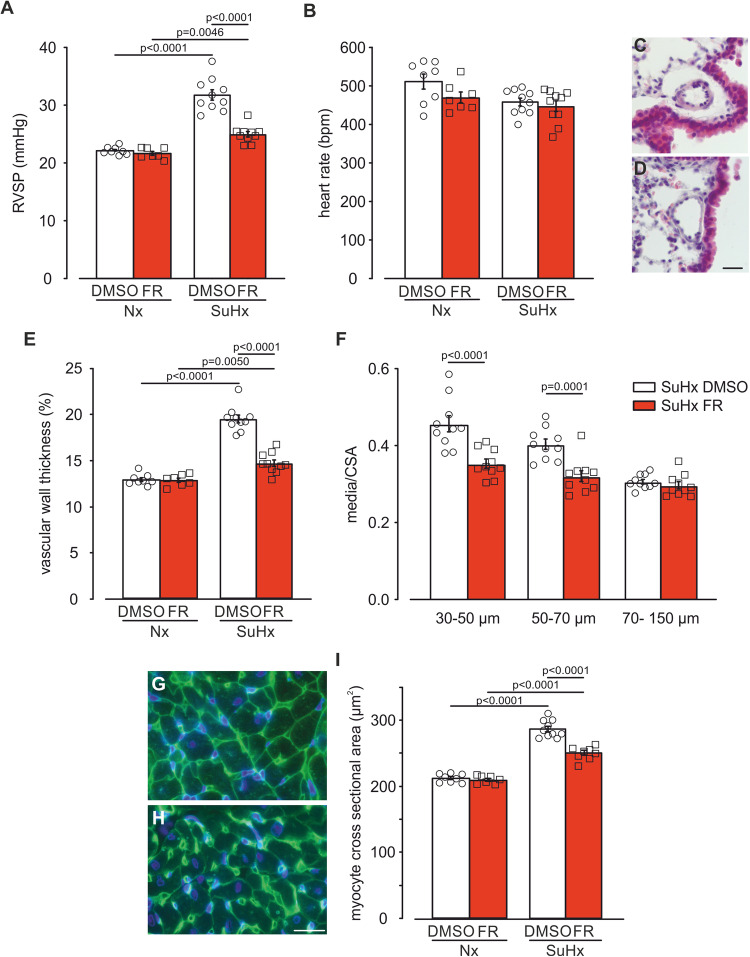
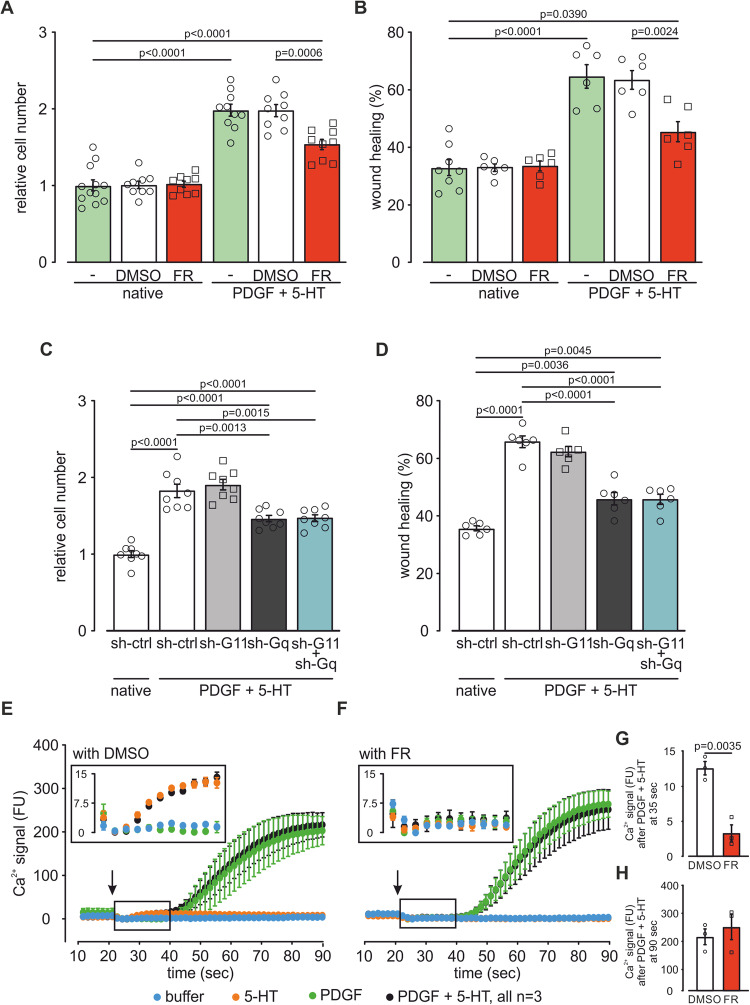
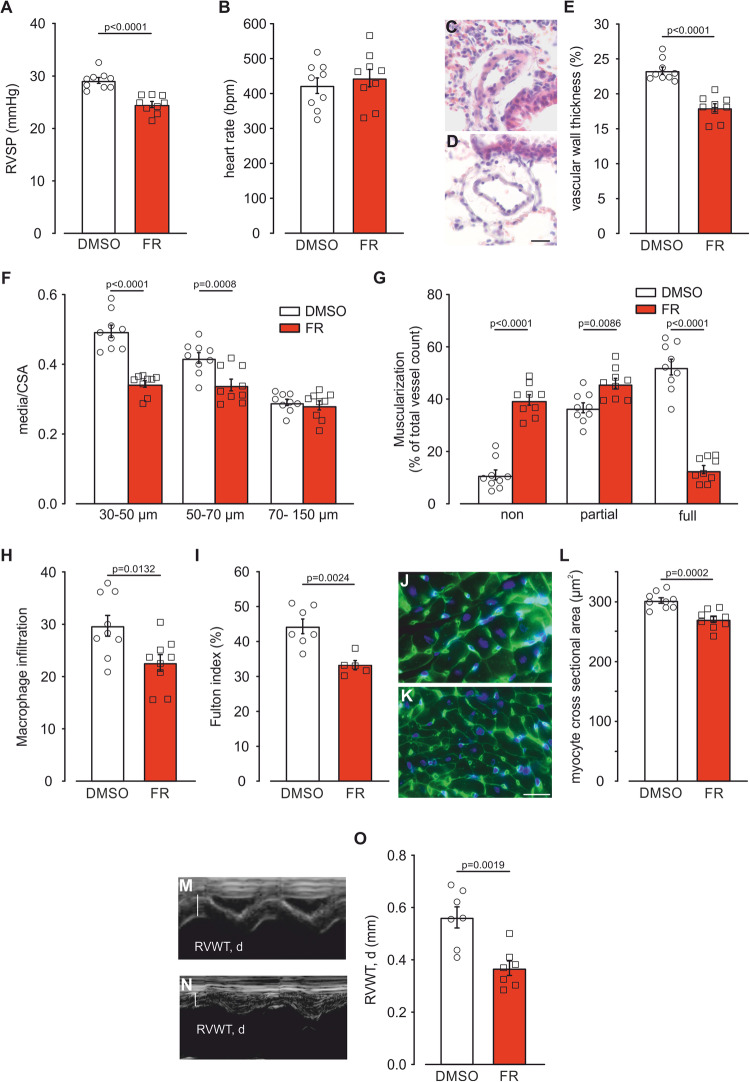
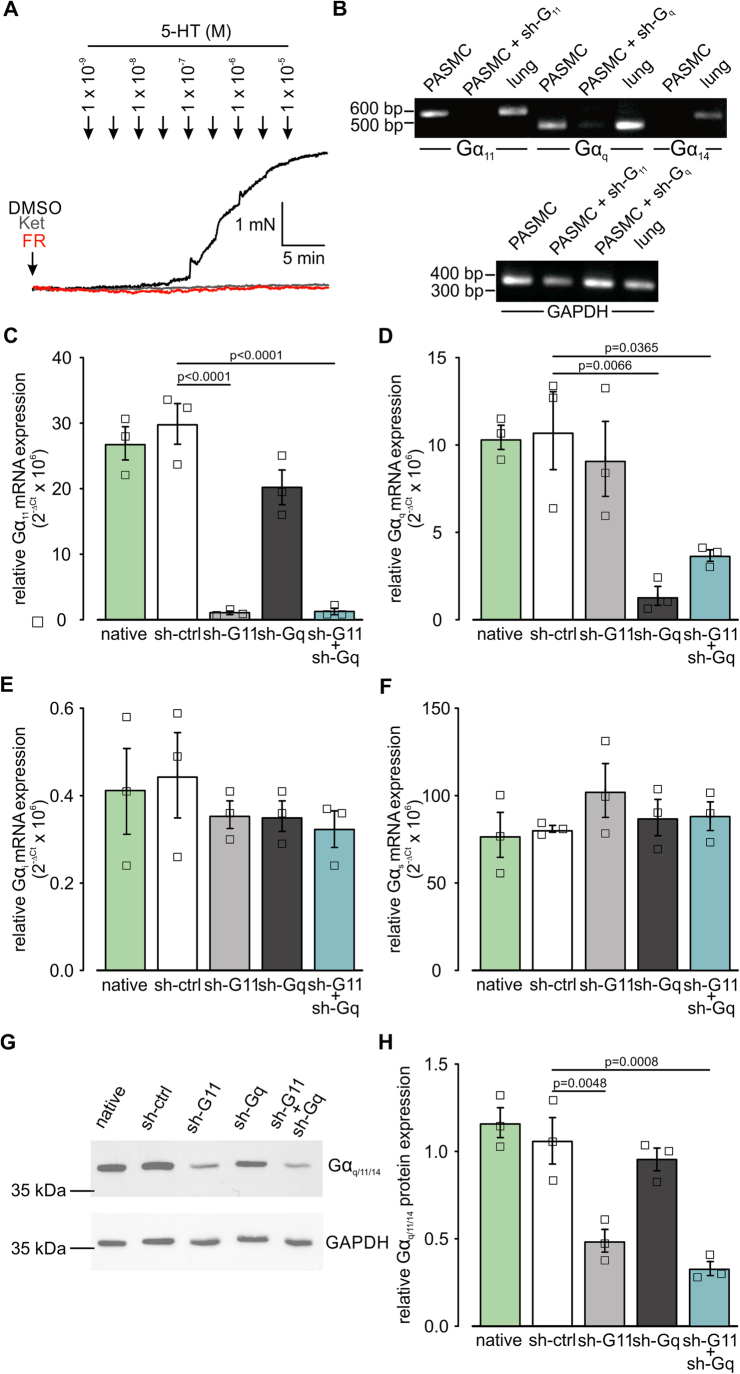
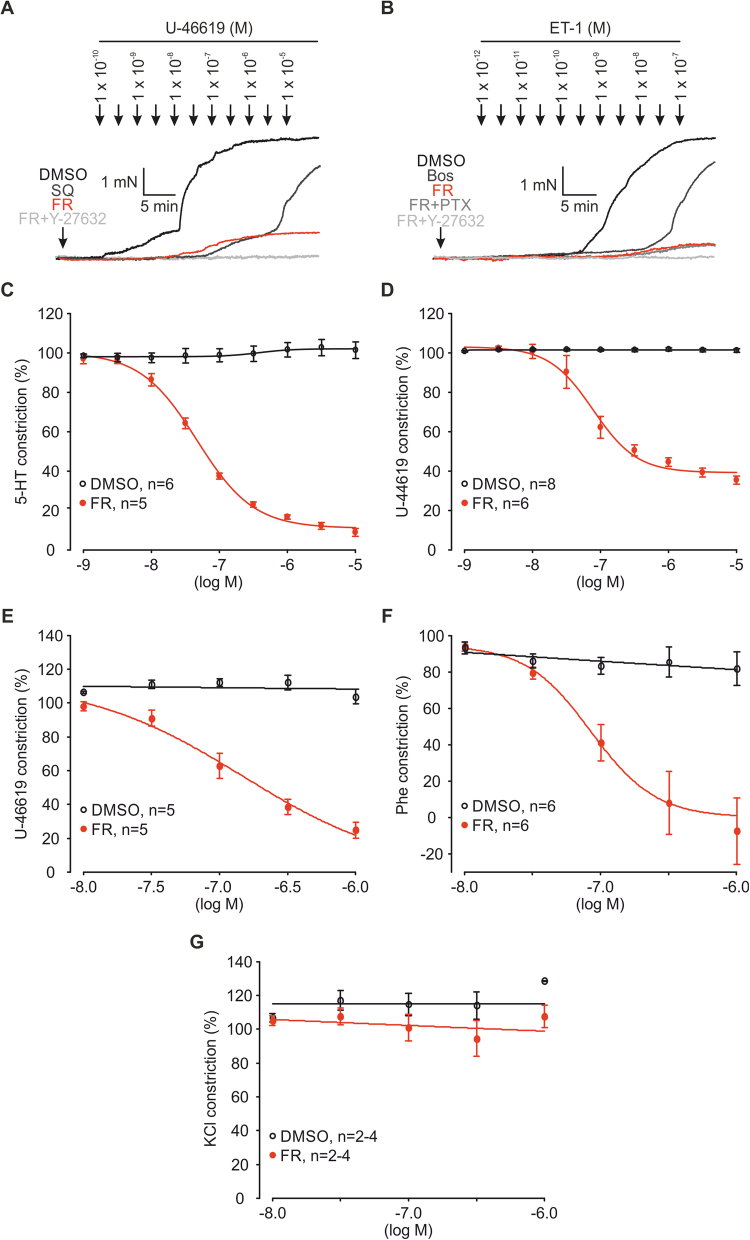
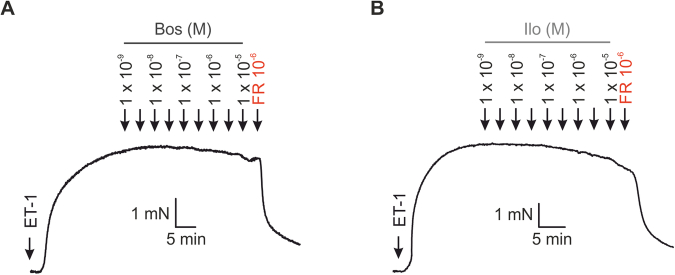
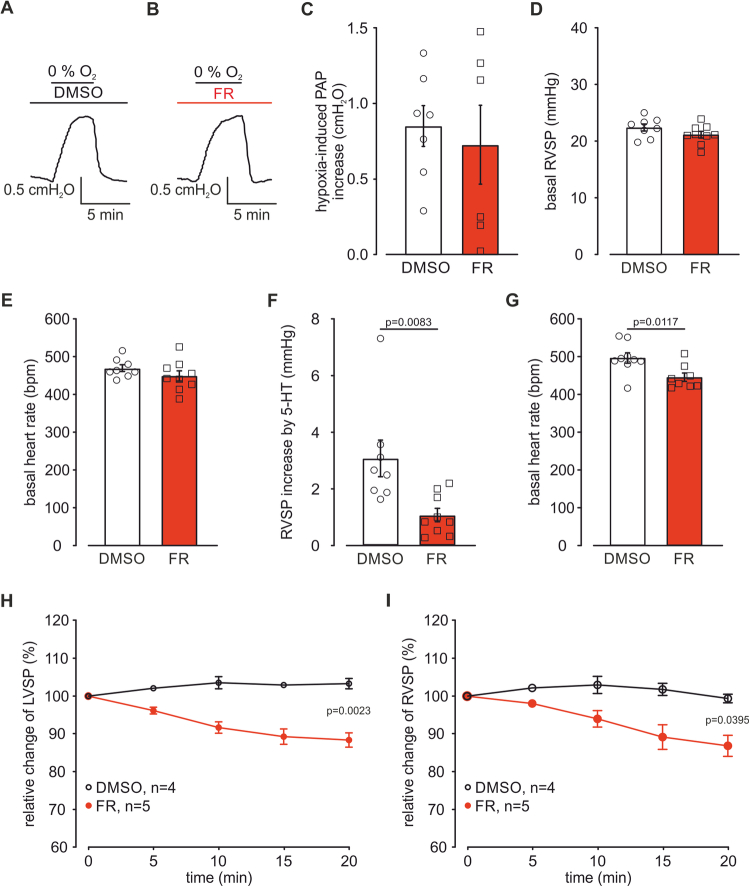
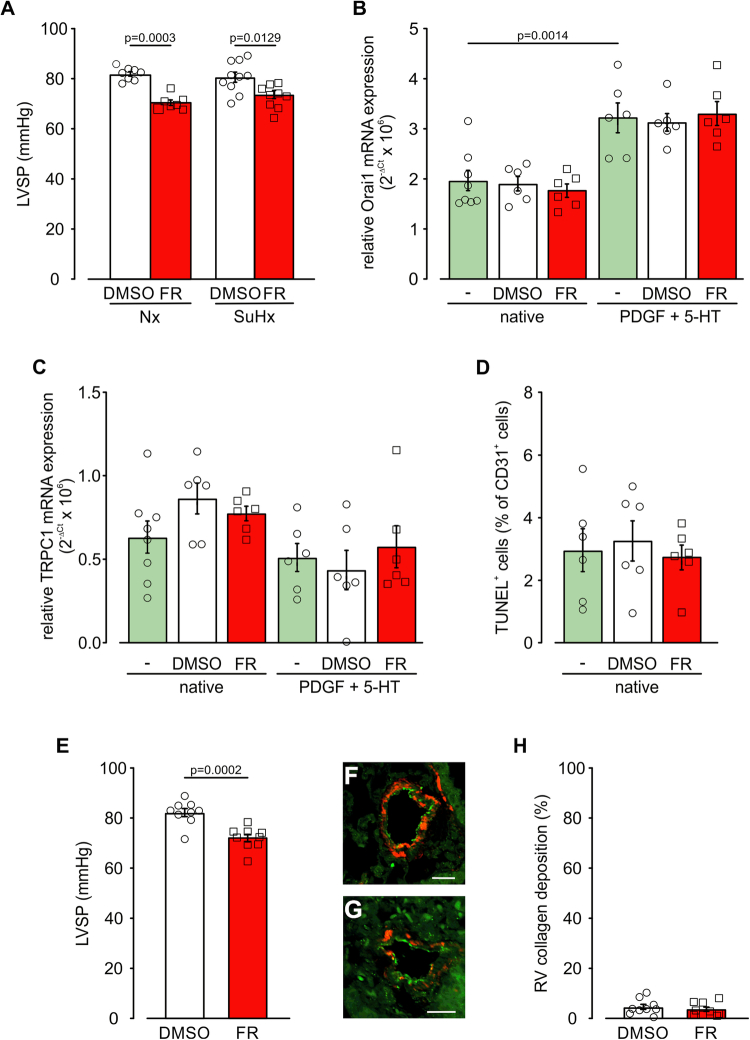
Pulmonary arterial hypertension (PAH) is a life-threatening disease with limited survival. Herein, we propose the pharmacological inhibition of Gq proteins as a novel concept to counteract pulmonary vasoconstriction and proliferation/migration of pulmonary artery smooth muscle cells (PASMCs) in PAH. We demonstrate that the specific pan-Gq inhibitor FR900359 (FR) induced a strong vasorelaxation in large and small pulmonary arteries in mouse, pig, and human subjects ex vivo. Vasorelaxation by FR proved at least as potent as the currently used triple therapy. We also provide in vivo evidence that local pulmonary application of FR prevented right ventricular systolic pressure increase in healthy mice as well as in mice suffering from hypoxia (Hx)-induced pulmonary hypertension (PH). In addition, we demonstrate that chronic application of FR prevented and also reversed Sugen (Su)Hx-induced PH in mice. We also demonstrate that Gq inhibition reduces proliferation and migration of PASMCs in vitro. Thus, our work illustrates a dominant role of Gq proteins for pulmonary vasoconstriction as well as remodeling and proposes direct Gq inhibition as a powerful pharmacological strategy in PH.

Keywords: Gq Inhibition; Pulmonary Arterial Hypertension; Vasoconstriction.


Conflict of interest statement

The authors declare no competing interests.

Figures

Figure 1
Figure 1. FR induces pulmonary vasorelaxation after pre-constriction with several Gq-dependent agonists.
(AE) Original traces of isometric force measurements in mouse PAs displaying pulmonary vasorelaxation by single dose FR (10−6 M) or the solvent DMSO after pre-constriction with 5-HT (5 × 10⁻⁷ M, A), U-46619 (10−7 M, B) and ET-1 (3 × 10⁻⁹ M, C) or KCl (4 × 10⁻² M, D, E). (F) Statistical analysis of DMSO or FR-dependent pulmonary vasorelaxation after constriction with Gq-dependent agonists (5-HT + DMSO (n = 10 PA rings), 5-HT + FR (n = 12 PA rings), U-46619 + FR (n = 15 PA rings), Y27632 + U-46619 + FR (n = 6 PA rings), ET-1 + FR (n = 13 PA rings), PTX + ET-1 + FR (n = 5 PA rings), Y-27632 + ET-1 + FR (n = 6 PA rings)) or KCl (each n = 6 PA rings). (GI) Original traces of isometric force measurements displaying FR-induced relaxation after pre-constriction with Gq-dependent agonists and pre-incubation with Y-27632 (10−5 M, G, I) or PTX (1 µg/ml, H). Data information: Values are expressed as mean ± SEM. (F) Unpaired student’s t-test, one-way ANOVA, Tukey’s post hoc test. Source data are available online for this figure.
Figure 2
Figure 2. FR abolishes 5-HT-induced pulmonary vasoconstriction, which is mediated via Gα11 and Gαq.
(A) Dose–response curve of 5-HT (10−9 M–10−5 M) after pre-incubation with the solvent DMSO (n = 6), the 5-HT2A/2C receptor antagonist Ket (10−6 M, n = 4) or FR (10−6 M, n = 4) in isometric force measurements of mouse PAs. (B) Statistical analysis of vasoconstriction at the highest 5-HT concentration applied (10−5 M) in the dose–response curve in (A). (C) DMR dose–response curve of α-methyl-5-HT (10−14 M–10−6 M) in native mPASMC (n = 3) and mPASMC transduced with control virus (sh-ctrl, n = 3) or virus containing a sh-G11 (n = 3), sh-Gq (n = 3) or sh-G11 + sh-Gq (n = 3) RNA plasmid. As positive control FR (10−6 M, n = 4) was applied to native cells before the highest α-methyl-5-HT (10−6 M) concentration, DMR responses were analyzed in three independent experiments and normalized to Gq-independent signals induced by EGF. Data information: Values are expressed as mean ± SEM. (B) One-way ANOVA, Tukey’s post hoc test. Source data are available online for this figure.
Figure 3
Figure 3. FR strongly diminishes U-46619- or ET-1-evoked vasoconstriction in PAs of mouse and pig.
(A) Dose–response curve of U-46619 (10−10 M–10−5 M) after pre-incubation with the solvent DMSO (n = 7), SQ (10−6 M, n = 6), FR (10−6 M, n = 4) or FR + Y-27632 (10−5 M, n = 5) in isometric force measurements of mouse PAs. (B) Statistical analysis of vasoconstriction at the highest U-46619 concentration applied (10−5 M) in the dose–response curve in (A). (C) Dose–response curve of ET-1 (10−12 M–10−7 M) after pre-incubation with the solvent DMSO (n = 7), Bos (10−6 M, n = 6), FR (10−6 M, n = 4), FR + PTX (1 µg/ml, n = 4) or FR + Y-27632 (10−5 M, n = 6) in isometric force measurements of mouse PAs. (D) Statistical analysis of vasoconstriction at the highest ET-1 concentration applied (10−7 M) in the dose–response curve in (C). (E) Dose–response curve of ET-1 (10−10 M–5 × 10⁻⁷ M) after pre-incubation with the solvent DMSO (n = 6) or FR (10−7 M, n = 6) in porcine PAs. (F) Statistical analysis of vasoconstriction at the highest ET-1 concentration applied (5 × 10⁻⁷ M) in the dose–response curve in (E). Data information: Values are expressed as mean ± SEM. (B, D) One-way ANOVA, Tukey’s post hoc test, (F) Unpaired student’s t-test. Source data are available online for this figure.
Figure 4
Figure 4. FR is a stronger pulmonary vasorelaxant than clinically used drugs for PAH.
(A, B) Original traces of FR (A) or Sil (B) (10−9 M–10−5 M) dose–response curves after pre-constriction with ET-1 (3 × 10⁻⁹ M) in mouse PAs. (C) Dose–response curve of DMSO, FR, Bos, Ilo, or Sil (10−9 M–10−5 M) after ET-1 (3 × 10⁻⁹ M) pre-constriction in mouse PAs. (D) Statistical analysis of the maximal relaxation upon application of the highest dose of FR (n = 7 PA rings), Bos (10−5 M, n = 5 PA rings), Ilo (10−5 M, n = 7 PA rings) or Sil (10−5 M, n = 6 PA rings) followed by an additional dose of FR (10−6 M). (E) Original trace of Bos, Ilo, and Sil combined application (Triple, 3.3 × 10⁻⁷ M each, 10−6 M in total) after pre-constriction with ET-1 (3 × 10⁻⁹ M) in mouse PAs. (F) Statistical analysis of the relaxation of FR (same bar as in Fig. 1F) or combined application of Bos, Ilo, and Sil (Triple) followed by an additional dose of FR (10−6 M, n = 5 PA rings). Data information: Values are expressed as mean ± SEM. (D, F) Paired student’s t-test. Source data are available online for this figure.
Figure 5
Figure 5. FR induces pulmonary vasorelaxation in small PAs of mice and humans ex vivo and acutely reduces RVSP in PH mice in vivo.
(A, B) Phase contrast microscopy pictures of intrapulmonary mouse vessels after solvent DMSO (A) or FR (10−6 M) (B) application. Numbers indicate time points shown in the graph (1–3), scale bar: 20 μm. (C) Statistical analysis of small intrapulmonary vessel relaxation evoked by DMSO (n = 8 intrapulmonary PAs) or FR (10−6 M, n = 7 intrapulmonary PAs). (D, E) Phase contrast microscopy pictures of intrapulmonary vessels after solvent DMSO (D) or FR (10−6 M, E) application in precision-cut lung slices of human subjects, arrows indicate PAs, scale bar: 200 µm. (F) Statistical analysis of vascular area changes evoked by DMSO (n = 5 intrapulmonary PAs) or FR (10−6 M, n = 8 intrapulmonary PAs). (G) Original traces of PAP in the IPL mouse model during perfusion with 5-HT (10−6 M) and DMSO or FR (10−6 M). (H) Statistical analysis of DMSO (n = 6 mice) or FR (10−6 M, n = 6 mice)-induced PAP decrease. (I) Statistical analysis of 5-HT (5 × 10⁻⁷ M)-induced constriction amplitude in healthy mice housed under Nx (21% O2, n = 22) conditions or mice with Hx-induced PH (n = 12). (J) Statistical analysis of DMSO (n = 6) or FR (10−6 M, n = 6)-dependent pulmonary vasorelaxation after constriction with 5-HT (5 × 10⁻⁷ M) in mice with pre-existing Hx-induced PH. (K) Schematic diagram of the procedure for acute FR application and hemodynamic analysis in mouse in vivo. (L) Statistical analysis of basal RVSP 1 h after DMSO (n = 9) or FR (2.5 µg/mouse, n = 8) i.t. application in mice with pre-existing Hx-induced PH. (M) Statistical analysis of right ventricular pressure response to acute 5-HT i.v. bolus injection (5 × 10⁻³ M, 10 µl) in these mice (DMSO: n = 9; FR: n = 8). Data information: Values are expressed as mean ± SEM. (C, F, H, I, J, L, M) Unpaired student’s t-test. Source data are available online for this figure.
Figure 6
Figure 6. FR prevents the development of SuHx-induced PH in mouse.
(A, B) Statistical analysis of RVSP (A) and heart rate (B) in mice treated with the solvent DMSO or FR (10 µg/mouse i.p., Monday to Friday) during exposure to Nx (DMSO: n = 8, FR: n = 7) or SuHx, (10% O2, DMSO: n = 10, FR: n = 10) for 3 weeks. (C, D) H&E-staining of lung sections from SuHx-DMSO (C) and SuHx-FR-treated mice (D), scale bar: 20 µm. (E, F) Statistical analysis of vascular wall thickness in mice treated with the solvent DMSO or FR during exposure to Nx (DMSO: n = 8, FR: n = 7) or SuHx (DMSO: n = 10, FR: n = 10) (E) and ratio of the media/CSA of small (30–50 µm), medium-sized (50–70 µm) and large (70–150 µm) PAs of mice exposed to SuHx for 3 weeks (DMSO: n = 10, FR: n = 10) (F). (G, H) WGA staining of transversal heart sections from right ventricles of SuHx-DMSO (G) and SuHx-FR-treated mice (H), scale bar: 20 µm. (I) Statistical analysis of right ventricular cardiomyocyte cross sectional area in mice treated with DMSO or FR during exposure to Nx (DMSO: n = 8, FR: n = 7) or SuHx (DMSO: n = 10, FR: n = 8). Data information: Values are expressed as mean ± SEM. (A, B, E, I) One-way ANOVA, Tukey’s post hoc test, (F) Two-way ANOVA, Bonferroni post hoc test. Source data are available online for this figure.
Figure 7
Figure 7. FR diminishes proliferation and migration in mPASMCs in vitro.
(A) Statistical analysis of the relative cell number of native mPASMCs (n = 12) and native cells treated with DMSO (n = 9) or FR (10−6 M, n = 9) as well as mPASMCs treated with PDGF (40 ng/ml) + 5-HT (10−6 M, n = 10) and PDGF + 5-HT-treated mPASMCs with DMSO (n = 9) or FR (n = 9) treatment. (B) Statistical analysis of wound healing of native (n = 8) and PDGF (40 ng/ml) + 5-HT (10−6 M)-treated mPASMCs with or without DMSO or FR (10−6 M) treatment (n = 6 each). (C, D) Statistical analysis of the relative cell number (n = 8 each) (C) and wound healing (n = 6 each) (D) of native and PDGF (40 ng/ml) + 5-HT (10−6 M)-treated mPASMCs after lentiviral transduction with sh-ctrl, sh-G11, sh-Gq RNA, or both. (EH) Acute changes of intracellular Ca2+ signal (fluorescence units (FU), corrected for minimum within 5 points after addition) after stimulation with 5-HT (10−6 M) or PDGF (40 ng/ml) or both (arrows indicate timepoint of application) without DMSO (E) or with FR (10−6 M) (F) pre-treatment and statistical analysis of Ca2+ signal of - cells 35 s (n = 3) (G) or 90 s (n = 3) (H) after PDGF (40 ng/ml) + 5-HT (10−6 M) addition, insets show magnified view of the curves within the boxes. Data information: Values are expressed as mean ± SEM. (AD) One-way ANOVA, Tukey’s post hoc test, (G, H) Unpaired student’s t-test. Source data are available online for this figure.
Figure 8
Figure 8. FR reverses SuHx-induced PH in mouse.
(A, B) Statistical analysis of RVSP (A) and heart rate (B) in mice treated with the solvent DMSO (n = 9) or FR (10 µg/mouse i.p., Monday to Friday, n = 9) in the last 2 weeks of 5 weeks SuHx (10% O2) exposure. (C, D) H&E-staining of lung sections from SuHx-DMSO (C) and SuHx-FR-treated mice (D), scale bar: 20 µm. (EG) Statistical analysis of vascular wall thickness in mice treated with the solvent DMSO or FR during exposure SuHx (DMSO: n = 9, FR: n = 9) (E), ratio of media/CSA of small (30–50 µm), medium-sized (50–70 µm) and large (70–150 µm) PAs of mice exposed to SuHx (DMSO: n = 9, FR: n = 9) and muscularization of PAs (30–70 µm) of mice exposed to SuHx (DMSO: n = 9, FR: n = 9) (G). (H) Statistical analysis of macrophage infiltration in mice treated with the solvent DMSO or FR during SuHx exposure (DMSO: n = 9, FR: n = 9). (I) Statistical analysis of Fulton index in mice treated with the solvent DMSO or FR during SuHx exposure (DMSO: n = 7, FR: n = 5). (J, K) WGA staining of transversal heart sections from right ventricles of SuHx-DMSO (J) and SuHx-FR-treated mice (K), scale bar: 20 µm. (L) Statistical analysis of right ventricular cardiomyocyte cross sectional area in mice treated with DMSO (n = 9) or FR (n = 9) during exposure to SuHx. (M, N) Representative M-mode pictures of SuHx-DMSO (M) and SuHx-FR-treated mice (N) displaying diastolic right ventricular wall thickness (RVWT, d) during echocardiography. (O) Statistical analysis of RVWT, d in mice treated with DMSO (n = 7) or FR (n = 7) during exposure to SuHx. Data information: Values are expressed as mean ± SEM. (A, B, E, H, I, L, O) Unpaired student’s t-test, (F, G) Two-way ANOVA, Bonferroni post hoc test. Source data are available online for this figure.
Figure EV1
Figure EV1. FR prevents 5-HT-induced constriction and Gαq/Gα11 can be downregulated by lentiviral transduction.
(A) Original traces of 5-HT dose–response curves (10−9 M–10−5 M) after pre-incubation with DMSO, Ket (10−6 M) or FR (10−6 M) in PAs. (B) PCR analysis of Gq protein subtypes in native mPASMCs and mPASMCs transduced with lentiviral sh-G11, sh-Gq RNA (negative controls). Murine lung tissue was used as positive control. (CF) Statistical analysis of relative Gα11 (C), Gαq (D), Gαi (E), and Gαs (F) mRNA expression in native mPASMCs (n = 3) and mPASMCs transduced with lentivirus (sh-control (ctrl), sh-G11, sh-Gq RNA or both, n = 3 independent experiments normalized to 18S housekeeping gene. (G, H) Original Western Blot (G) and analysis (H) of Gαq/11/14 protein expression of native mPASMCs and mPASMCs transduced with lentivirus (sh-control (ctrl), sh-G11, sh-Gq RNA or both, n = 3 independent experiments). GAPDH was used as housekeeper. Data information: Values are expressed as mean ± SEM. (CF, H) One-way ANOVA, Tukey’s post hoc test. Source data are available online for this figure.
Figure EV2
Figure EV2. FR prevents and reverses Gq-mediated constriction in mouse and pig PAs.
(A) Original traces of U-46619 dose–response curves (10-10 M–10−5 M) after pre-incubation with DMSO, SQ (10−6 M), FR (10−6 M), or FR + Y-27632 (10−5 M) in mouse PAs. (B) Original traces of ET-1 dose–response curves (10-12 M–10−7 M) after pre-incubation with DMSO, Bos (10−6 M), FR (10−6 M), FR + PTX (1 µg/ml) or FR + Y-27632 (10−5 M) in mouse PAs. (C, D) Dose–response curves of DMSO and FR (10−9 M–10−5 M) after 5-HT (5 × 10⁻⁷ M, DMSO: n = 6, FR: n = 5, C) or U-46619 (10−7 M, DMSO: n = 8, FR: n = 6, D) pre-constriction in murine PAs. (EG) Dose–response curves of DMSO and FR (10−8 M–10−6 M) after U-46619 (3 × 10⁻⁷ M, DMSO: n = 5, FR: n = 5, E), Phe (3 × 10⁻⁵ M, DMSO: n = 6, FR: n = 6, F), or KCl (3 × 10⁻² M, DMSO: n = 2–4, FR: n = 2–4, G) pre-constriction in porcine PAs. Data information: Values are expressed as mean ± SEM. Source data are available online for this figure.
Figure EV3
Figure EV3. FR strongly relaxes PAs ex vivo.
(A, B) Original traces of Bos (A) or Ilo (B) dose–response curves (10−9 M – 10−5 M) followed by single dose FR (10−6 M) application after pre-constriction with ET-1 (3 × 10⁻⁹ M) in mouse PAs.
Figure EV4
Figure EV4. FR does not affect HPV but reduces RVSP in vivo.
(A, B) Original traces of PAP in the IPL model during perfusion with DMSO (A) or FR (10−6 M, B) and exposure to hypoxic air (0% O2/100% N2). (C) Statistical analysis of PAP increase evoked by hypoxic air during DMSO (n = 7 mice) or FR (n = 6 mice) perfusion. (D) Statistical analysis of basal RVSP 1 h after DMSO (n = 8) or FR (2.5 µg/mouse, n = 8) i.t. application in healthy mice housed under normoxic (21% O2) conditions. (E) Statistical analysis of basal heart rate in these mice (DMSO: n = 8; FR: n = 8). (F) Statistical analysis of RVSP increase in response to 5-HT (5 × 10⁻³ M, 10 µl) i.v. bolus injection in these mice (DMSO: n = 8; FR: n = 8). (G) Basal heart rate 1 h after DMSO (n = 9) or FR (2.5 µg/mouse, 1 h before, n = 8) application in mice with pre-existing Hx-induced PH (DMSO: n = 9; FR: n = 8). (H, I) Relative change of LVSP (H) and RVSP (I) after acute DMSO (n = 4) or FR (10 µg/mouse i.p., n = 5) application in mice with pre-existing Hx-induced PH. Data information: Values are expressed as mean ± SEM. (CG) Unpaired student’s t-test. (H, I) Two-way ANOVA, Bonferroni post hoc test. Source data are available online for this figure.
Figure EV5
Figure EV5. FR effects on Hx-induced PH in vivo and mPASMCs as well as mLECs in vitro.
(A) Statistical analysis of LVSP in mice treated with the solvent DMSO or FR (10 µg/mouse i.p., Monday to Friday) during exposure to Nx (21% O2, DMSO: n = 8, FR: n = 7) or SuHx (10% O2, DMSO: n = 10, FR: n = 10) for 3 weeks. (B, C) Statistical analysis of relative Orai1 (B) and TRPC1 (C) mRNA expression in native mPASMCs (n = 8) and mPASMCs treated with solvent DMSO or FR (10−6 M) with or without additional PDGF (40 ng/ml) + 5-HT (10−6 M) stimulation for 12 h, each n = 6 normalized to 18 S housekeeping gene, ns indicate different wells derived from at least two different passages. (D) Amount of TUNEL+ CD31+ mLECs after 2 days without treatment (n = 6) or with DMSO (n = 6) or FR (10−6 M, n = 6) treatment. (E) Statistical analysis of LVSP in mice treated with the solvent DMSO (n = 9) or FR (10 µg/mouse i.p., Monday to Friday, n = 9) in the last 2 weeks of 5 weeks SuHx exposure. (F, G) vWF/α-SMAC staining of PAs in lung sections from SuHx-DMSO (F) and SuHx-FR-treated mice (G), scale bars: 20 µm. (H) Statistical analysis of collagen deposition in the right ventricle in mice treated with the solvent DMSO (n = 9) or FR (10 µg/mouse i.p., Monday to Friday, n = 9) in the last 2 weeks of 5 weeks SuHx exposure. Data information: Values are expressed as mean ± SEM. (AD) One-way ANOVA, Tukey’s post hoc test, (E, H) Unpaired student’s t-test. Source data are available online for this figure.

References

    1. Abdel Kafi S, Mélot C, Vachiéry J-L, Brimioulle S, Naeije R (1998) Partitioning of pulmonary vascular resistance in primary pulmonary hypertension. J Am Coll Cardiol 31:1372–1376 10.1016/S0735-1097(98)00091-6 - DOI - PubMed
    1. Alapati VR, McKenzie C, Blair A, Kenny D, MacDonald A, Shaw AM (2007) Mechanisms of U46619- and 5-HT-induced contraction of bovine pulmonary arteries: role of chloride ions. Br J Pharm 151:1224–123410.1038/sj.bjp.0707338 - DOI - PMC - PubMed
    1. Annala S, Feng X, Shridhar N, Eryilmaz F, Patt J, Yang J, Pfeil EM, Cervantes-Villagrana RD, Inoue A, Häberlein F et al (2019) Direct targeting of Gαq and Gα11 oncoproteins in cancer cells. Sci Signal 12:eaau5948 10.1126/scisignal.aau5948 - DOI - PubMed
    1. Bai Y, Krishnamoorthy N, Patel KR, Rosas I, Sanderson MJ, Ai X (2016) Cryopreserved human precision-cut lung slices as a bioassay for live tissue banking. A viability study of bronchodilation with bitter-taste receptor agonists. Am J Respir Cell Mol Biol 54:656–663 10.1165/rcmb.2015-0290MA - DOI - PMC - PubMed
    1. Barman SA (2007) Vasoconstrictor effect of endothelin-1 on hypertensive pulmonary arterial smooth muscle involves Rho-kinase and protein kinase C. Am J Physiol Lung Cell Mol Physiol 293:L472–9 10.1152/ajplung.00101.2006 - DOI - PubMed

MeSH terms

LinkOut - more resources