. 2024 Jul 8;23(1):239.
doi: 10.1186/s12933-024-02329-5.

Myocardial transcriptomic analysis of diabetic patients with aortic stenosis: key role for mitochondrial calcium signaling

Affiliations

Myocardial transcriptomic analysis of diabetic patients with aortic stenosis: key role for mitochondrial calcium signaling

Maelle Cherpaz et al. Cardiovasc Diabetol. .

Abstract

Background: Type 2 diabetes (T2D) is a frequent comorbidity encountered in patients with severe aortic stenosis (AS), leading to an adverse left ventricular (LV) remodeling and dysfunction. Metabolic alterations have been suggested as contributors of the deleterious effect of T2D on LV remodeling and function in patients with severe AS, but so far, the underlying mechanisms remain unclear. Mitochondria play a central role in the regulation of cardiac energy metabolism.

Objectives: We aimed to explore the mitochondrial alterations associated with the deleterious effect of T2D on LV remodeling and function in patients with AS, preserved ejection fraction, and no additional heart disease.

Methods: We combined an in-depth clinical, biological and echocardiography phenotype of patients with severe AS, with (n = 34) or without (n = 50) T2D, referred for a valve replacement, with transcriptomic and histological analyses of an intra-operative myocardial LV biopsy.

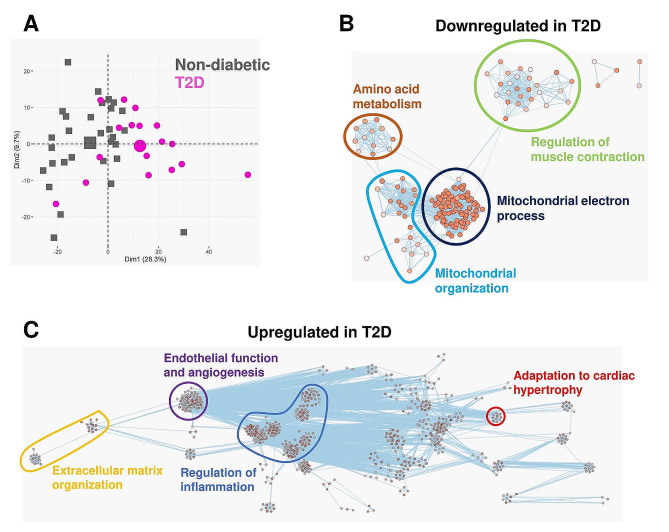
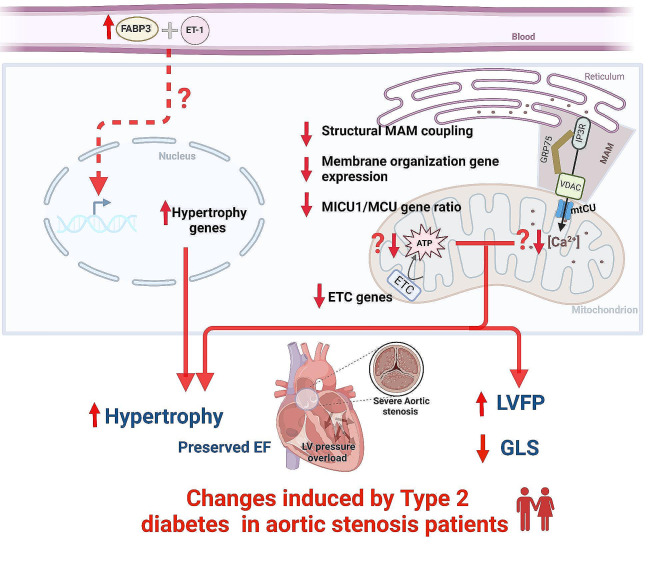
Results: T2D patients had similar AS severity but displayed worse cardiac remodeling, systolic and diastolic function than non-diabetics. RNAseq analysis identified 1029 significantly differentially expressed genes. Functional enrichment analysis revealed several T2D-specific upregulated pathways despite comorbidity adjustment, gathering regulation of inflammation, extracellular matrix organization, endothelial function/angiogenesis, and adaptation to cardiac hypertrophy. Downregulated gene sets independently associated with T2D were related to mitochondrial respiratory chain organization/function and mitochondrial organization. Generation of causal networks suggested a reduced Ca2+ signaling up to the mitochondria, with the measured gene remodeling of the mitochondrial Ca2+ uniporter in favor of enhanced uptake. Histological analyses supported a greater cardiomyocyte hypertrophy and a decreased proximity between the mitochondrial VDAC porin and the reticular IP3-receptor in T2D.

Conclusions: Our data support a crucial role for mitochondrial Ca2+ signaling in T2D-induced cardiac dysfunction in severe AS patients, from a structural reticulum-mitochondria Ca2+ uncoupling to a mitochondrial gene remodeling. Thus, our findings open a new therapeutic avenue to be tested in animal models and further human cardiac biopsies in order to propose new treatments for T2D patients suffering from AS.

Trial registration: URL: https://www.

Clinicaltrials: gov ; Unique Identifier: NCT01862237.

Keywords: HFpEF; MAM; MCU; MICU1; Mitochondria; Mitochondria-associated membranes; Pressure overload; RNAseq.


Conflict of interest statement

The authors declare that they have no competing interests.

Figures

Fig. 1
Fig. 1
T2D increased circulating levels of metabolic markers in AS patients. Measurement of circulating serum biomarkers of diabetic cardiomyopathy focusing on leptin (A), FABP3 (B) and Endothelin 1 (C). Statistical analyses: Wilcoxon test. **p < 0.01; ***p < 0.001
Fig. 2
Fig. 2
Myocardial transcriptomic changes induced by T2D in AS patients. RNAseq was performed on the myocardial biopsies. A Principal component analysis using the 1029 genes differentially expressed between non-diabetic (grey squares) and T2D (purple circles) patients. The bigger square and circle represent the gravity center for each cluster. B, C Enrichment maps displaying the significantly down- (B) or up-regulated (C) GO biological processes in T2D patients versus non-diabetics. Node color intensity is proportional to enrichment significance (Fisher exact P value after Benjamini-Hochberg (BH) adjustment for multiple comparisons). Relevant clusters of functionally related gene-sets were manually circled and assigned a label, based on suggested annotations by AutoAnnotate (Cytoscape)
Fig. 3
Fig. 3
Effect of comorbidities on differentially expressed T2D genes. Bubble plots represent for each main cluster identified in Fig. 2B, C, the enrichment of the most differentially expressed GO biological processes either up- (A) or down-regulated (B) in T2D patients versus non-diabetics, after adjustment for age, BMI, hypertension (HT), sex or all the 4 covariates (4 Cov)
Fig. 4
Fig. 4
Cardiac hypertrophy signaling pathway in T2D myocardium identified by IPA. Relative changes in gene expression are depicted by gradated shades of color coding: upregulated in red; downregulated in green. Predicted relationships, i.e. activation in orange, inhibition in blue and inconsistency in yellow, are depicted by colored arrows
Fig. 5
Fig. 5
IPA analysis of mitochondrial signaling pathway alteration induced by T2D. Relative changes in gene expression are depicted by gradated shades of color coding: upregulated in red; downregulated in green. Predicted relationships, i.e. activation in orange, inhibition in blue and inconsistency in yellow, are depicted by colored arrows
Fig. 6
Fig. 6
Histological validation of myocardial alterations induced by T2D in AS patients. A Measurement of cardiomyocyte diameter, an index of cell hypertrophy. Upper: representative image of WGA staining. Lower l: quantification of cell diameter. Magnification: 40×. B Analysis of apoptosis. Upper: typical image of TUNEL assay, showing nuclei in blue and apoptotic cells in red. Lower: quantification of the percentage of apoptotic cells. Magnification: 10×. C Proximity ligation assay to evaluate the proximity between the reticular IP3-receptor and the mitochondrial porin VDAC. Upper: representative picture of PLA between IP3R and VDAC. Nuclei in blue and IP3R-VDAC interactions in red. Lower: quantification of the number of interactions between IP3R and VDAC per cell. Magnification: 60×. Statistical analyses: Fisher and Wilcoxon tests. ns not significant; *p < 0.05; ****p < 0.0001
Fig. 7
Fig. 7
Central scheme depicting the T2D-specific biological processes associated with T2D-induced left ventricular dysfunction in patients with severe aortic stenosis. ETC electron transport chain, ET-1 endothelin-1, FABP3 fatty-acid binding protein 3, GLS global longitudinal strain, LVFP left ventricular filling pressure, MAM mitochondria-associated membranes

References

    1. https://diabetesatlas.org/idfawp/resource-files/2021/07/IDF_Atlas_10th_E....
    1. Rajbhandari J, Fernandez CJ, Agarwal M, Yeap BXY, Pappachan JM. Diabetic heart disease: a clinical update. World J Diabetes. 2021;12:383–406. doi: 10.4239/wjd.v12.i4.383. - DOI - PMC - PubMed
    1. Kannel WB, Hjortland M, Castelli WP. Role of diabetes in congestive heart failure: the Framingham study. Am J Cardiol. 1974;34:29–34. doi: 10.1016/0002-9149(74)90089-7. - DOI - PubMed
    1. Einarson TR, Acs A, Ludwig C, Panton UH. Prevalence of cardiovascular disease in type 2 diabetes: a systematic literature review of scientific evidence from across the world in 2007–2017. Cardiovasc Diabetol. 2018;17:83. doi: 10.1186/s12933-018-0728-6. - DOI - PMC - PubMed
    1. Devereux RB, Roman MJ, Paranicas M, O’Grady MJ, Lee ET, Welty TK, et al. Impact of diabetes on cardiac structure and function: the strong heart study. Circulation. 2000;101:2271–2276. doi: 10.1161/01.CIR.101.19.2271. - DOI - PubMed

Publication types

MeSH terms

Associated data