. 2024 Jul 8;23(1):240.
doi: 10.1186/s12933-024-02339-3.

Genome-scale metabolic network of human carotid plaque reveals the pivotal role of glutamine/glutamate metabolism in macrophage modulating plaque inflammation and vulnerability

Affiliations

Genome-scale metabolic network of human carotid plaque reveals the pivotal role of glutamine/glutamate metabolism in macrophage modulating plaque inflammation and vulnerability

Han Jin et al. Cardiovasc Diabetol. .

Abstract

Background: Metabolism is increasingly recognized as a key regulator of the function and phenotype of the primary cellular constituents of the atherosclerotic vascular wall, including endothelial cells, smooth muscle cells, and inflammatory cells. However, a comprehensive analysis of metabolic changes associated with the transition of plaque from a stable to a hemorrhaged phenotype is lacking.

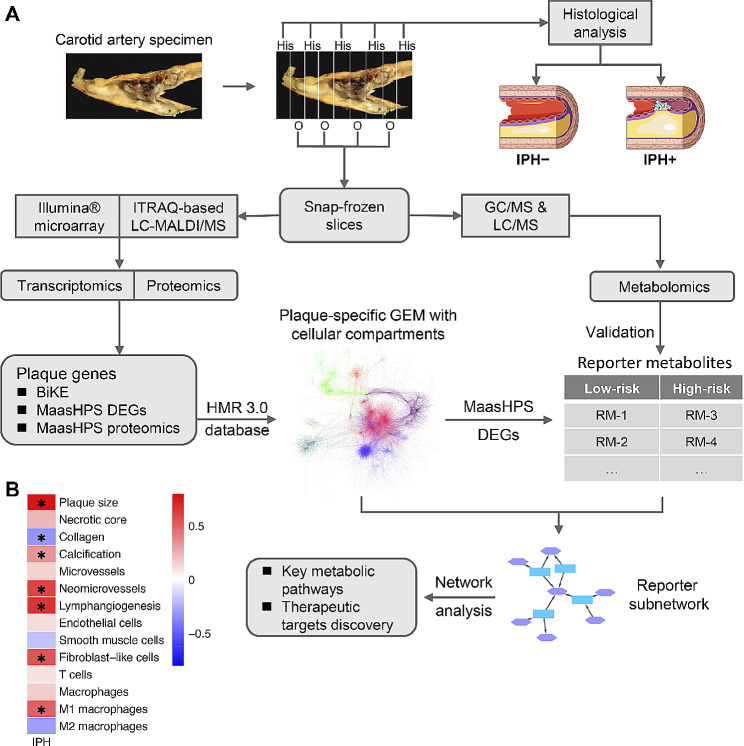
Methods: In this study, we integrated two large mRNA expression and protein abundance datasets (BIKE, n = 126; MaasHPS, n = 43) from human atherosclerotic carotid artery plaque to reconstruct a genome-scale metabolic network (GEM). Next, the GEM findings were linked to metabolomics data from MaasHPS, providing a comprehensive overview of metabolic changes in human plaque.

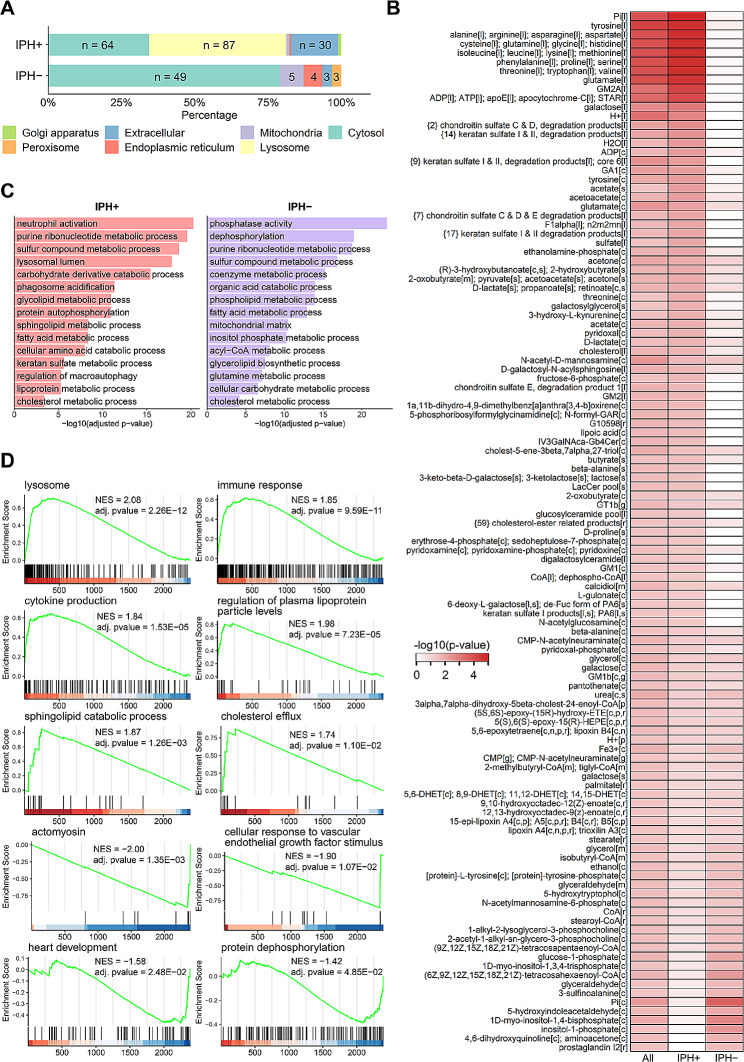
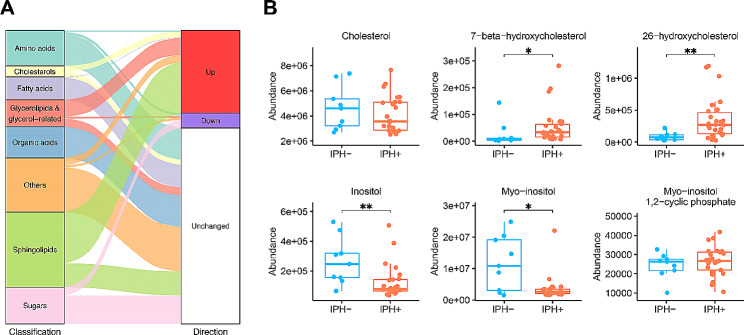
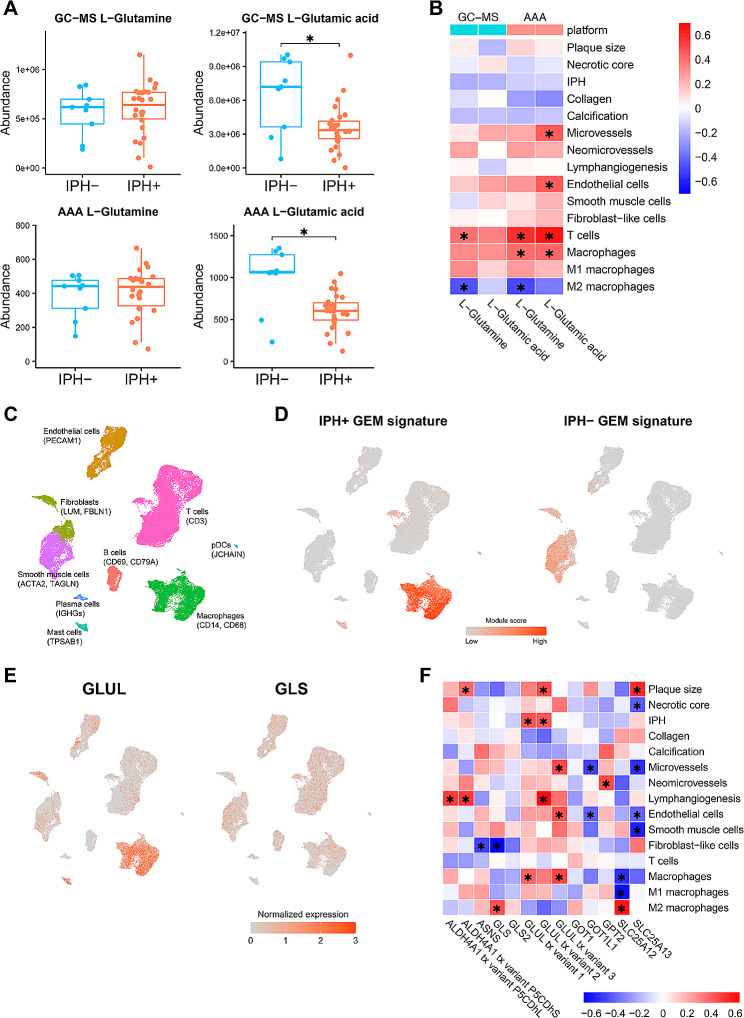
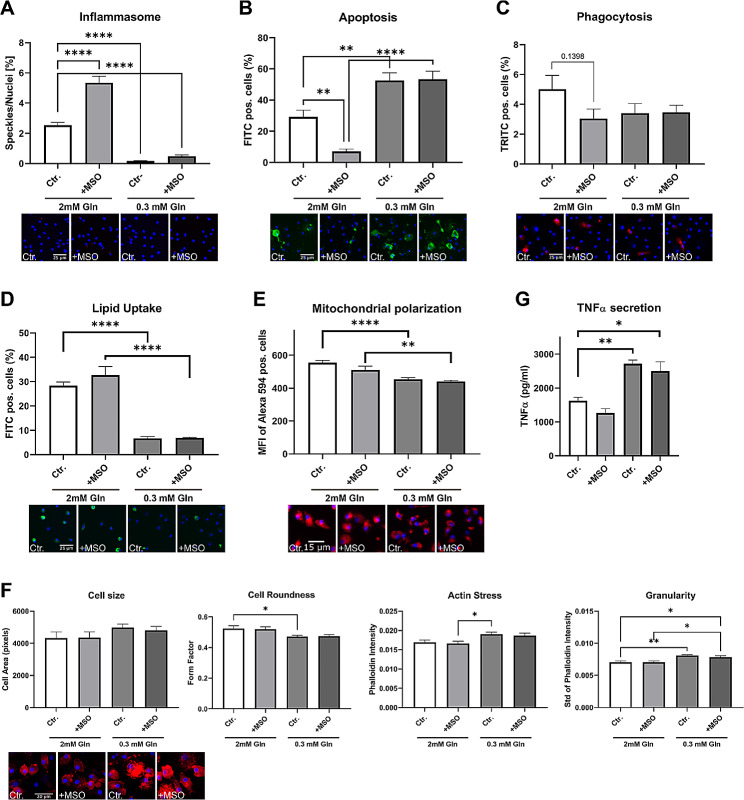
Results: Our study identified significant changes in lipid, cholesterol, and inositol metabolism, along with altered lysosomal lytic activity and increased inflammatory activity, in unstable plaques with intraplaque hemorrhage (IPH+) compared to non-hemorrhaged (IPH-) plaques. Moreover, topological analysis of this network model revealed that the conversion of glutamine to glutamate and their flux between the cytoplasm and mitochondria were notably compromised in hemorrhaged plaques, with a significant reduction in overall glutamate levels in IPH+ plaques. Additionally, reduced glutamate availability was associated with an increased presence of macrophages and a pro-inflammatory phenotype in IPH+ plaques, suggesting an inflammation-prone microenvironment.

Conclusions: This study is the first to establish a robust and comprehensive GEM for atherosclerotic plaque, providing a valuable resource for understanding plaque metabolism. The utility of this GEM was illustrated by its ability to reliably predict dysregulation in the cholesterol hydroxylation, inositol metabolism, and the glutamine/glutamate pathway in rupture-prone hemorrhaged plaques, a finding that may pave the way to new diagnostic or therapeutic measures.

Keywords: Atherosclerosis; Genome-scale metabolic network; Macrophage; Metabolomics; Plaque rupture.


Conflict of interest statement

Peter Juhasz is employed by PJConsulting. The other authors declare no competing interests.

Figures

Fig. 1
Fig. 1
Schematic workflow. A The entire carotid endarterectomy specimen was cut in parallel 5 mm thick slices, snap-frozen in liquid nitrogen and stored until use. Every second slice was sectioned. After H&E staining, sections were categorized and classified histologically based on the presence/absence of IPH, a proxy of plaque stability. Sections were pulverized and aliquoted for transcriptomics, proteomics, and metabolomics analyses. Highly expressed genes in the BiKE cohort were aggregated with the MaasHPS DEGs and proteomics for building the plaque-specific GEM, after which the MaasHPS DEGs were used to infer the reporter metabolites from the well-annotated plaque-specific GEM, which were subsequently validated by the MaasHPS metabolomics. The reporter subnetwork evolved from the GEM and was used to analyze key pathways and potential therapeutic targets for plaque stability. B Spearman’s correlation between IPH area and other plaque traits. *P-value < 0.05
Fig. 2
Fig. 2
Analysis of the plaque-specific GEM network. A Comparison of the cellular compartment of the significant reporter metabolites inferred for IPH+ and IPH− plaques. The letter “n” indicates the number of significantly altered reporter metabolites in each cellular apartment. B Reporter metabolites that were significantly associated with up-/down-regulated and all genes. The number in braces shows the number of reporter metabolites belonging to the same category (denoted as “products”). The number in brackets shows the cellular compartment. C Gene set overrepresentation analysis of the GEM signatures. Fifteen significant GO terms were selectively shown for both up- and down-regulated GEM signatures. D Gene set enrichment analysis of the GEM signatures. Only the ten most significant GO terms are shown. The X-axis indicates GEM signatures sorted based on the log2 fold change (IPH+ vs. IPH−) from high to low
Fig. 3
Fig. 3
Prediction of metabolic pathway changes and their validation by metabolomics. A Alluvial diagram shows the categories of all the 109 detected metabolites by GC-MS, and the comparison of abundance levels between IPH− and IPH+ plaques. Up: significantly higher abundance in IPH+ plaques; down: vice versa; unchanged: no significant change between IPH− and IPH+ plaques. B Content of cholesterol-related and inositol-related metabolites in IPH− versus IPH+ plaques. P-values were adjusted by the Benjamini–Hochberg procedure. *Adjusted P-value < 0.1, **Adjusted P-value < 0.05
Fig. 4
Fig. 4
Reporter subnetwork of plaque-specific GEM
Fig. 5
Fig. 5
Plaque Glu/Gln metabolic pathway is associated with macrophage functions. A The abundance level of Glu/Gln between IPH− versus IPH+ plaques in the MaasHPS plaque metabolomics. P-values were adjusted by the Benjamini–Hochberg procedure. *Adjusted P-value < 0.1. B Spearman’s correlation between the metabolomic profiled abundance level of Glu/Gln and plaque traits in IPH+ plaques. *P-value < 0.05. C UMAP visualization showing the cell type derived from the scRNA-seq plaque dataset GSE159677. D The overall expression (module score) of the GEM signatures in the scRNA-seq dataset. E The expression level of key genes GLUL and GLS regulating Glu/Gln metabolic pathways in the scRNA-seq dataset. F Spearman’s correlation between the expression level of key genes for plaque Glu/Gln pathways and plaque traits in IPH+ plaques based on the MaasHPS transcriptomics dataset. *P-value < 0.05
Fig. 6
Fig. 6
Functional changes of macrophages induced by MSO and low glutamine. Macrophages were treated with MSO (1 mM) for 24 h in the presence of indicated glutamine concentrations prior to the following functional assays: A Inflammasome assay was performed with LPS (50 nM) for 3 h and Nigericin (10 nM) for 1 h. Representative pictures were taken at 20x magnification. Blue = nuclei; red = ASC specks. B Apoptosis was measured with staurosporine (1200 nM) for 1 h. Representative pictures were taken at 10× magnification. Blue = nuclei; green = Annexin-V stain. C Phagocytosis assay was performed with zymosan fluorescently-labeled beads for 1 h. Representative pictures were taken at 10x magnification. Blue = nuclei; red = zymosan-labeled beads. D Lipid Uptake was performed with oxLDL (1 µg) for 2,5 h. Representative pictures were taken at 10× magnification. Blue = nuclei; green = fluorescently-labeled oxLDL. E Mitochondrial polarization was measured with staurosporine (1200 nM) for 2 h. Representative pictures were taken at 10× magnification. Blue = nuclei; red = MitoTracker Red. F Cell Shape was measured at baseline. Representative pictures were taken at 40× magnification. Blue = nuclei; red = phalloidin stain. G Macrophages were stimulated with LPS (50 ng/ml) for 6 h. n = 7–8 replicates for HCA experiments. n = 4 for TNF-ELISA. *P-value < 0.05, **P-value < 0.01, ***P-value < 0.001, ****P-value < 0.0001

References

    1. Chen J, Tung C-H, Mahmood U, Ntziachristos V, Gyurko R, Fishman MC, Huang PL, Weissleder R. In vivo imaging of proteolytic activity in atherosclerosis. Circulation. 2002;105(23):2766–71. doi: 10.1161/01.CIR.0000017860.20619.23. - DOI - PubMed
    1. Bierhansl L, Conradi L-C, Treps L, Dewerchin M, Carmeliet P. Central role of metabolism in endothelial cell function and vascular disease. Physiology. 2017;32(2):126–40. doi: 10.1152/physiol.00031.2016. - DOI - PMC - PubMed
    1. Theodorou K, Boon RA. Endothelial cell metabolism in atherosclerosis. Front Cell Dev Biol. 2018;6:82. doi: 10.3389/fcell.2018.00082. - DOI - PMC - PubMed
    1. Shi J, Yang Y, Cheng A, Xu G, He F. Metabolism of vascular smooth muscle cells in vascular diseases. Am J Physiol Heart Circ Physiol. 2020;319(3):H613–31. doi: 10.1152/ajpheart.00220.2020. - DOI - PubMed
    1. Bories GFP, Leitinger N. Macrophage metabolism in atherosclerosis. FEBS Lett. 2017;591(19):3042–60. doi: 10.1002/1873-3468.12786. - DOI - PubMed

Publication types

MeSH terms