

Global burden and cross-country inequalities in stroke and subtypes attributable to diet from 1990 to 2019
- PMID: 38978043
- PMCID: PMC11229201
- DOI: 10.1186/s12889-024-19337-5
Global burden and cross-country inequalities in stroke and subtypes attributable to diet from 1990 to 2019
Abstract
Data sources: The Global Burden of Diseases, Injuries, and Risk Factors study (GBD) 2019.
Background: To describe burden, and to explore cross-country inequalities according to socio-demographic index (SDI) for stroke and subtypes attributable to diet.
Methods: Death and years lived with disability (YLDs) data and corresponding estimated annual percentage changes (EAPCs) were estimated by year, age, gender, location and SDI. Pearson correlation analysis was performed to evaluate the connections between age-standardized rates (ASRs) of death, YLDs, their EAPCs and SDI. We used ARIMA model to predict the trend. Slope index of inequality (SII) and relative concentration index (RCI) were utilized to quantify the distributive inequalities in the burden of stroke.
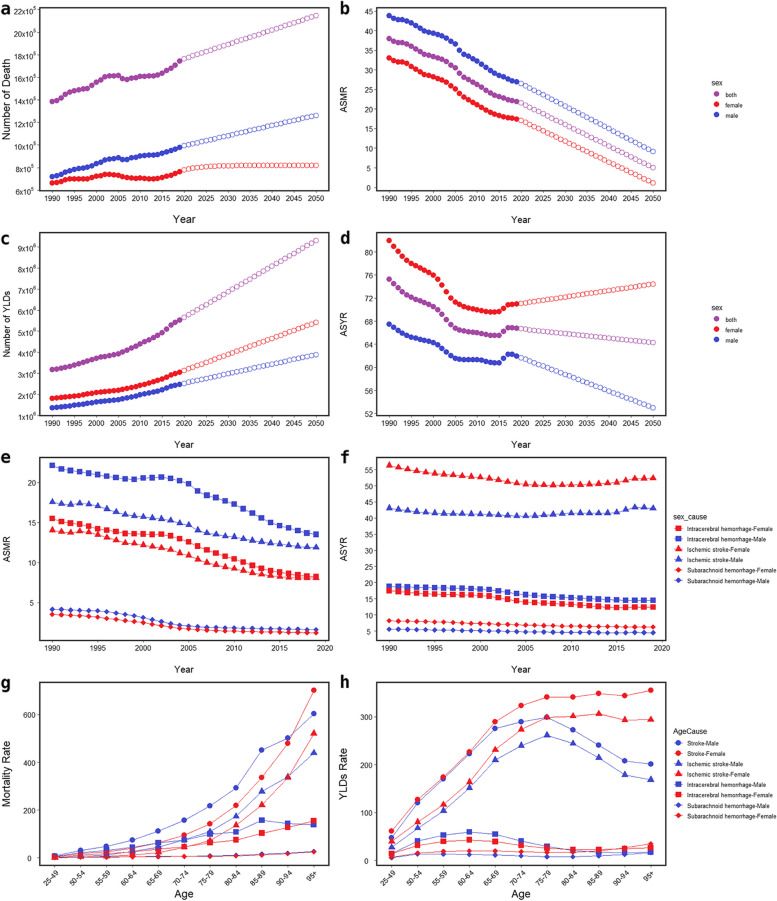
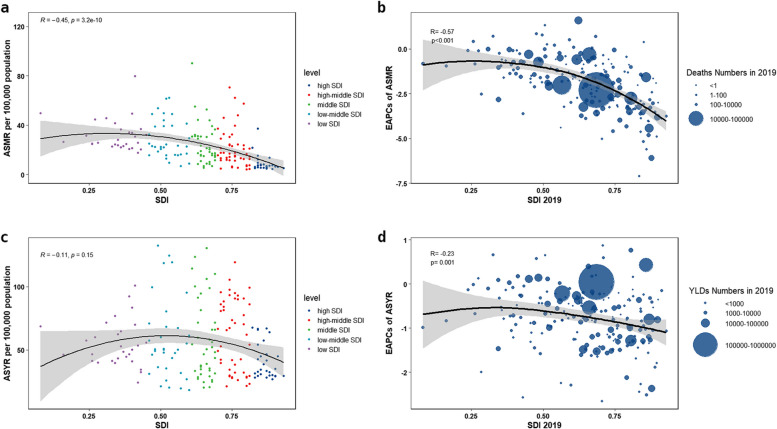
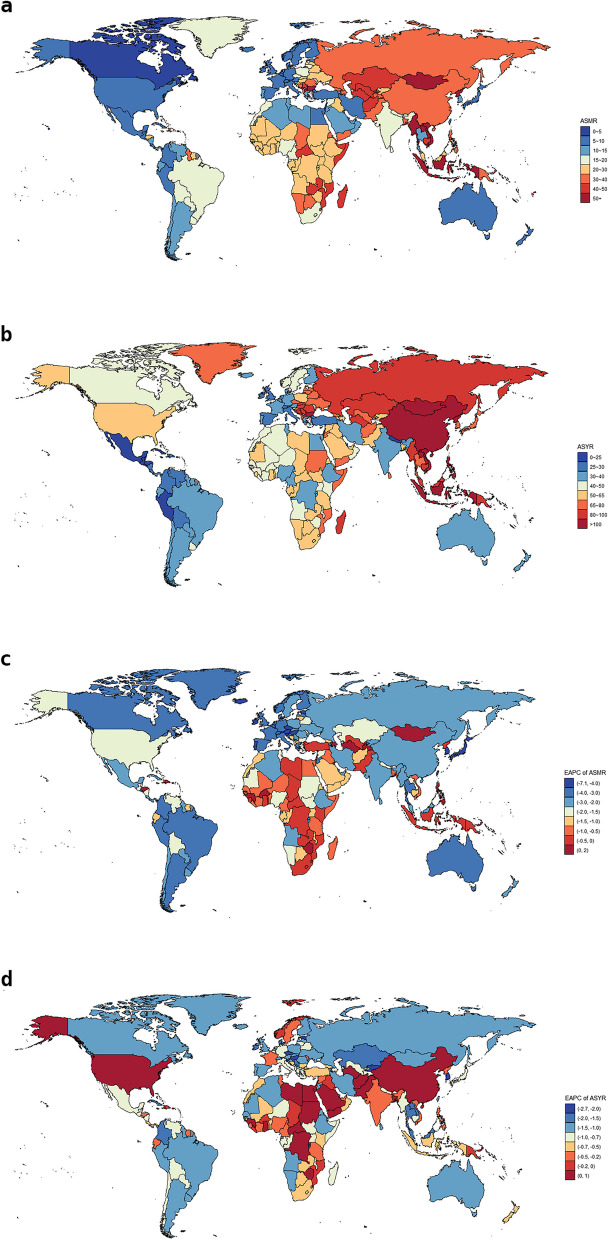
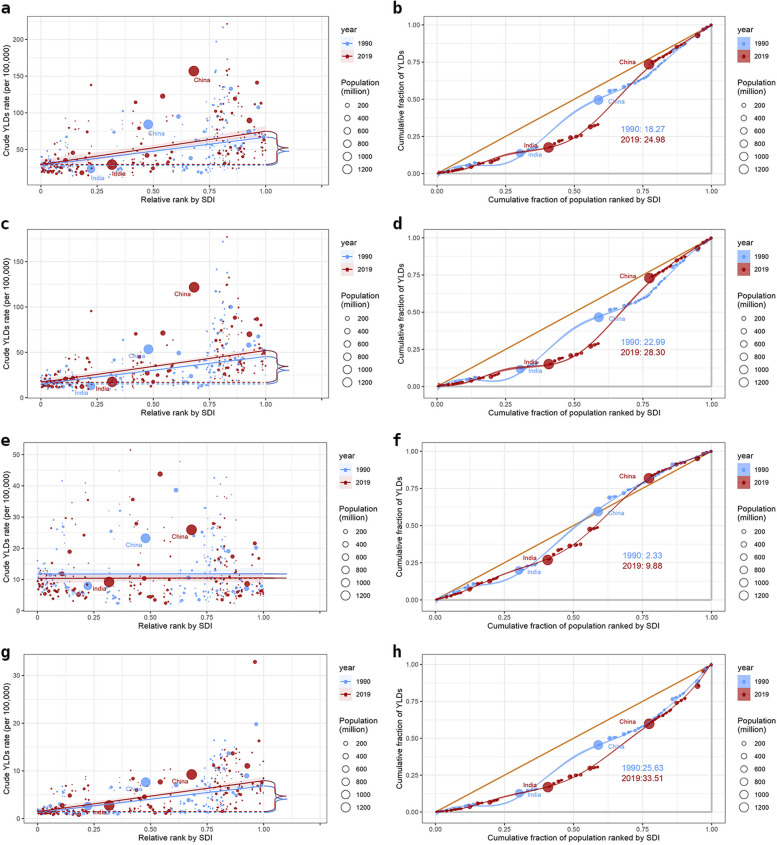
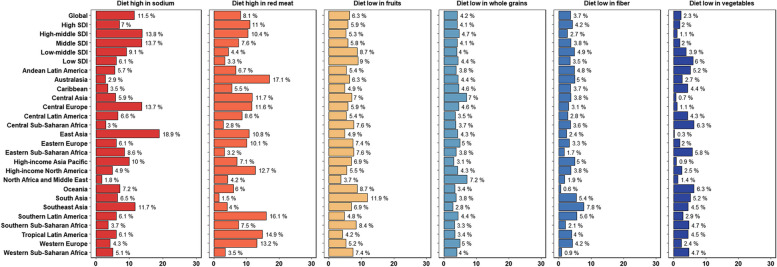
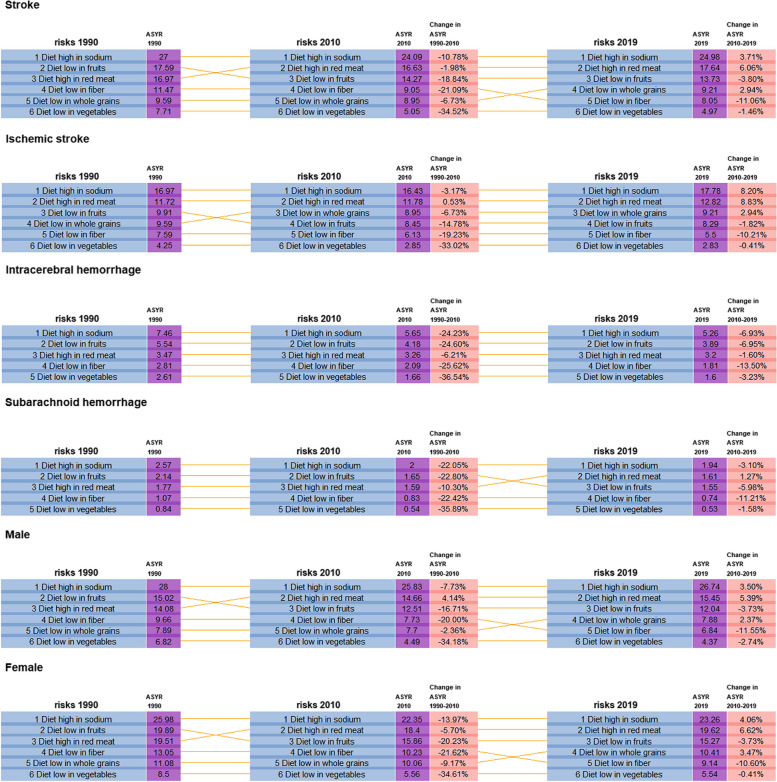
Results: A total of 1.74 million deaths (56.17% male) and 5.52 million YLDs (55.27% female) attributable to diet were included in the analysis in 2019.Between 1990 and 2019, the number of global stroke deaths and YLDs related to poor diet increased by 25.96% and 74.76% while ASRs for death and YLDs decreased by 42.29% and 11.34% respectively. The disease burden generally increased with age. The trends varied among stroke subtypes, with ischemic stroke (IS) being the primary cause of YLDs and intracerebral hemorrhage (ICH) being the leading cause of death. Mortality is inversely proportional to SDI (R = -0.45, p < 0.001). In terms of YLDs, countries with different SDIs exhibited no significant difference (p = 0.15), but the SII changed from 38.35 in 1990 to 45.18 in 2019 and the RCI showed 18.27 in 1990 and 24.98 in 2019 for stroke. The highest ASRs for death and YLDs appeared in Mongolia and Vanuatu while the lowest of them appeared in Israel and Belize, respectively. High sodium diets, high red meat consumption, and low fruit diets were the top three contributors to stroke YLDs in 2019.
Discussion: The burden of diet-related stroke and subtypes varied significantly concerning year, age, gender, location and SDI. Countries with higher SDIs exhibited a disproportionately greater burden of stroke and its subtypes in terms of YLDs, and these disparities were found to intensify over time. To reduce disease burden, it is critical to enforce improved dietary practices, with a special emphasis on mortality drop in lower SDI countries and incidence decline in higher SDI countries.
Keywords: Dietary risks; Global burden of disease (GBD); Health inequality; Mortality; Stroke; Years lived with Disability (YLDs).
© 2024. The Author(s).
Conflict of interest statement
The authors declare no competing interests.
Figures
Similar articles
-
Temporal trends in cross-country inequalities of stroke and subtypes burden from 1990 to 2021: a secondary analysis of the global burden of disease study 2021.EClinicalMedicine. 2024 Sep 11;76:102829. doi: 10.1016/j.eclinm.2024.102829. eCollection 2024 Oct. EClinicalMedicine. 2024. PMID: 39309727 Free PMC article.
-
Trends and cross-country inequalities in global burns burden among children and adolescents: A population-based study from 1990 to 2021.Burns. 2025 Apr;51(3):107377. doi: 10.1016/j.burns.2025.107377. Epub 2025 Jan 9. Burns. 2025. PMID: 39848116
-
Global burden of neck pain and its gender and regional inequalities from 1990 - 2021: a comprehensive analysis from the Global Burden of Disease Study 2021.BMC Musculoskelet Disord. 2025 Jan 31;26(1):94. doi: 10.1186/s12891-025-08331-6. BMC Musculoskelet Disord. 2025. PMID: 39891177 Free PMC article.
-
Global, regional, and national burden of 12 mental disorders in 204 countries and territories, 1990-2019: a systematic analysis for the Global Burden of Disease Study 2019.Lancet Psychiatry. 2022 Feb;9(2):137-150. doi: 10.1016/S2215-0366(21)00395-3. Epub 2022 Jan 10. Lancet Psychiatry. 2022. PMID: 35026139 Free PMC article.
-
Global, regional, and national burden of fracture of vertebral column, 1990-2021: analysis of data from the global burden of disease study 2021.Front Public Health. 2025 Apr 30;13:1573888. doi: 10.3389/fpubh.2025.1573888. eCollection 2025. Front Public Health. 2025. PMID: 40371297 Free PMC article.
Cited by
-
Association between triglyceride glucose-waist height ratio and stroke: a population-based study.Front Endocrinol (Lausanne). 2025 Mar 12;16:1510493. doi: 10.3389/fendo.2025.1510493. eCollection 2025. Front Endocrinol (Lausanne). 2025. PMID: 40144296 Free PMC article.
-
The global burden and epidemiological trends of gout, particularly cases attributable to high Body Mass Index (BMI) in adolescents and young adults (aged 15-39 years): a secondary analysis from global burden of disease study 2021.Clin Rheumatol. 2025 Aug;44(8):3295-3308. doi: 10.1007/s10067-025-07494-w. Epub 2025 Jun 18. Clin Rheumatol. 2025. PMID: 40533689
-
Global burden of stroke attributable to dietary risk factors in the GBD 2021 study.Front Nutr. 2024 Dec 30;11:1494574. doi: 10.3389/fnut.2024.1494574. eCollection 2024. Front Nutr. 2024. PMID: 39807217 Free PMC article.
-
Global, regional and national trends in the burden of intracranial hemorrhage, 1990-2021: Results from the Global Burden of Disease study.Heliyon. 2025 Feb 10;11(4):e42608. doi: 10.1016/j.heliyon.2025.e42608. eCollection 2025 Feb 28. Heliyon. 2025. PMID: 40034309 Free PMC article.
-
Burden and inequalities of chronic kidney disease attributable to diet globally, regionally and temporally, 1990-2021.Front Nutr. 2025 Jun 18;12:1592389. doi: 10.3389/fnut.2025.1592389. eCollection 2025. Front Nutr. 2025. PMID: 40607040 Free PMC article.
References
MeSH terms
LinkOut - more resources
Full Text Sources
Medical
