. 2024 Jul 8;22(1):635.
doi: 10.1186/s12967-024-05424-z.

A diagnostic model for Parkinson's disease based on circadian rhythm-related genes

Affiliations

A diagnostic model for Parkinson's disease based on circadian rhythm-related genes

Lufeng Wang et al. J Transl Med. .

Abstract

Background: Circadian rhythm (CR) disturbance is intricately associated with Parkinson's disease (PD). However, the involvement of CR-related mechanisms in the pathogenesis and progression of PD remains elusive.

Methods: A total of 141 PD patients and 113 healthy participants completed CR-related clinical examinations in this study. To further investigate the CR-related mechanisms in PD, we obtained datasets (GSE7621, GSE20141, GSE20292) from the Gene Expression Omnibus database to identify differentially expressed genes between PD patients and healthy controls and further selected CR-related genes (CRRGs). Subsequently, the least absolute shrinkage and selection operator (LASSO) followed by logistic algorithms were employed to identify the hub genes and construct a diagnostic model. The predictive performance was evaluated by area under the curve (AUC), calibration curve, and decision curve analyses in the training set and external validation sets. Finally, RT‒qPCR and Western blotting were conducted to verify the expression of these hub genes in blood samples. In addition, Pearson correlation analysis was utilized to validate the association between expression of hub genes and circadian rhythm function.

Results: Our clinical observational study revealed that even early-stage PD patients exhibited a higher likelihood of experiencing sleep disturbances, nocturnal hypertension, reverse-dipper blood pressure, and reduced heart rate variability compared to healthy controls. Furthermore, 4 CR-related hub genes (AGTR1, CALR, BRM14, and XPA) were identified and subsequently incorporated as candidate biomarkers to construct a diagnostic model. The model showed satisfactory diagnostic performance in the training set (AUC = 0.941), an external validation set GSE20295 (AUC = 0.842), and our clinical centre set (AUC = 0.805). Additionally, the up-regulation of CALR, BRM14 and the down-regulation of AGTR1, XPA were associated with circadian rhythm disruption.

Conclusion: CR disturbance seems to occur in the early stage of PD. The diagnostic model based on CR-related genes demonstrated robust diagnostic efficacy, offering novel insights for future clinical diagnosis of PD and providing a foundation for further exploration into the role of CR-related mechanisms in the progression of PD.

Keywords: Bioinformatics; Circadian rhythm; Nomogram; Parkinson’s disease.


Conflict of interest statement

The authors declare that they have no competing interests.

Figures
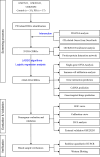
Fig. 1
Fig. 1
Flowchart of the screening and analysis strategy
Fig. 2
Fig. 2
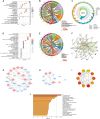
Screening process of DE-CRRGs and GSEA. (A) Volcano graph displaying the DEGs associated with Parkinson’s disease (PD). (B) Heatmap of the DEGs. (C) Dendrogram of the PD gene cluster. (D, E) Scaleless index and mean connectivity of soft thresholds. (F) Heatmap of correlations between modules and clinical traits. (G) Venn diagram showing the intersecting genes as DE-CRRGs. (H, I) GSEA of DEG sets in the PD and control groups
Fig. 3
Fig. 3
Analysis of DE-CRRGs. (A) Bubble plot of the Gene Ontology (GO) enrichment analysis. (B) Circos plot presenting the correlations between the top 8 GO functions and DE-CRRGs. (C) Circos plot presenting the GO functions (largest circle), the number of genes involved in each pathway (middle circle), and the percentage of DEGs in each function (inner circle). (D) Bubble plot of KEGG signalling pathways. (E) Circos plot presenting the correlations between the top 8 pathways and DE-CRRGs. (F) PPI network of CR-related DEGs. (G) PPI network of upregulated and downregulated proteins. Red dots represent upregulated proteins, and blue dots represent downregulated proteins. (H) Key clusters calculated by MCODE. (I) Top 10 genes chosen by cytoHubba. (J) Disease enrichment analysis of DE-CRRGs
Fig. 4
Fig. 4
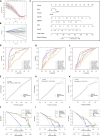
Identification of hub genes and construction of the nomogram. (A, B) LASSO algorithm. Fourteen characteristic genes were screened out by the LASSO algorithm. (C) Nomogram incorporating age, sex, and four hub genes (AGTR1, RBM14, XPA, CALR). (D, G, J) Receiver operating characteristic (ROC) curves of the nomogram in the training datasets (GSE7621, GSE20141, GSE20292), the validation dataset (GSE20295) and our external clinical dataset. (E, H, K) Calibration plots of the nomogram in the training datasets (GSE7621, GSE20141, GSE20292), the validation dataset (GSE20295) and our external clinical dataset. (F, I, L) Decision curve analysis (DCA) curves of the nomogram in the training datasets (GSE7621, GSE20141, GSE20292), the validation dataset (GSE20295) and our external clinical dataset
Fig. 5
Fig. 5
Enrichment analysis of four hub genes. (A) Heatmap of the four hub genes. (B) Circos plot presenting the correlations between the hub genes and GO functions. (C) Circos plot presenting the correlations between the hub genes and KEGG pathways. (D-G) Violin plots presenting the differential expression of hub genes in the training set. (H-K) Violin plots presenting the differential expression of hub genes in the external validation set
Fig. 6
Fig. 6
Gene set variation analysis (GSVA) of each hub gene. Red signalling pathways are enriched with high expression of the hub genes, while the green signalling pathways are enriched with low expression of the hub genes. (A) AGTR1. (B) XPA. (C) RBM14. (D) CALR
Fig. 7
Fig. 7
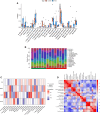
Immunoinfiltration analysis. (A) Discrepancy in the 22 types of immune cell infiltration between the control and PD groups. (B) Stacked histogram presenting the proportions of immune cells among the control and PD groups. (C) Correlation analysis of each hub genes and the different types of immune cells. (D) Correlation analysis among the different types of immune cells. *p < 0.05, **p < 0.01, *** p < 0.001
Fig. 8
Fig. 8
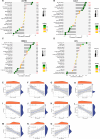
Correlation analysis of hub genes and immune cells. (A-D) Lollipop graphs presenting the correlations between each hub gene and immune cells. (E-F) Scatter plots presenting significant correlations between each hub gene and immune cells
Fig. 9
Fig. 9
Prediction of interactive genes, ceRNA networks, and target drugs. (A) Prediction of hub gene-related interactive genes. (B) Prediction of hub gene-related ceRNA networks. (C) Prediction of hub gene-targeted drugs
Fig. 10
Fig. 10
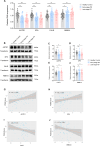
Verification of hub gene expression and associations with circadian rhythm function (sleep disorders). (A) Expression of mRNA was detected by RT‒qPCR. (B) Protein expression was detected by Western blotting. (C-F) Relative protein expression was calculated as the integrated density value relative to that of transferrin as a reference. (G-J) Pearson correlations between AGTR1, XPA, CALR, and RBM14 protein levels and PDSS scores. *p < 0.05, **p < 0.01, ***p < 0.001

Similar articles

Cited by

References

    1. Reich SG, Savitt JM. Parkinson’s Disease. Med Clin North Am. 2019;103(2):337–50. doi: 10.1016/j.mcna.2018.10.014. - DOI - PubMed
    1. Jankovic J. Parkinson’s disease: clinical features and diagnosis. J Neurol Neurosurg Psychiatry. 2008;79(4):368–76. doi: 10.1136/jnnp.2007.131045. - DOI - PubMed
    1. Schapira AHV, Chaudhuri KR, Jenner P. Non-motor features of Parkinson disease. Nat Rev Neurosci. 2017;18(7):435–50. doi: 10.1038/nrn.2017.62. - DOI - PubMed
    1. Liu Y, Niu L, Liu X, Cheng C, Le W. Recent progress in non-motor features of Parkinson’s Disease with a focus on Circadian Rhythm Dysregulation. Neurosci Bull. 2021;37(7):1010–24. doi: 10.1007/s12264-021-00711-x. - DOI - PMC - PubMed
    1. Obayashi K, Saeki K, Yamagami Y, Kurumatani N, Sugie K, Kataoka H. Circadian activity rhythm in Parkinson’s disease: findings from the PHASE study. Sleep Med. 2021;85:8–14. doi: 10.1016/j.sleep.2021.06.023. - DOI - PubMed