. 2024 Jul;13(7):e12476.
doi: 10.1002/jev2.12476.

Extracellular vesicle isolation methods identify distinct HIV-1 particles released from chronically infected T-cells

Affiliations

Extracellular vesicle isolation methods identify distinct HIV-1 particles released from chronically infected T-cells

Sebastian M Molnar et al. J Extracell Vesicles. 2024 Jul.

Abstract

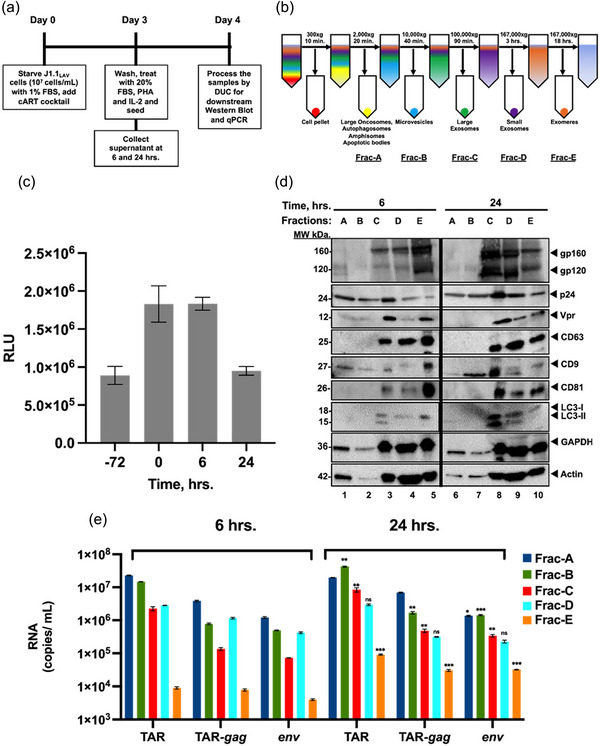
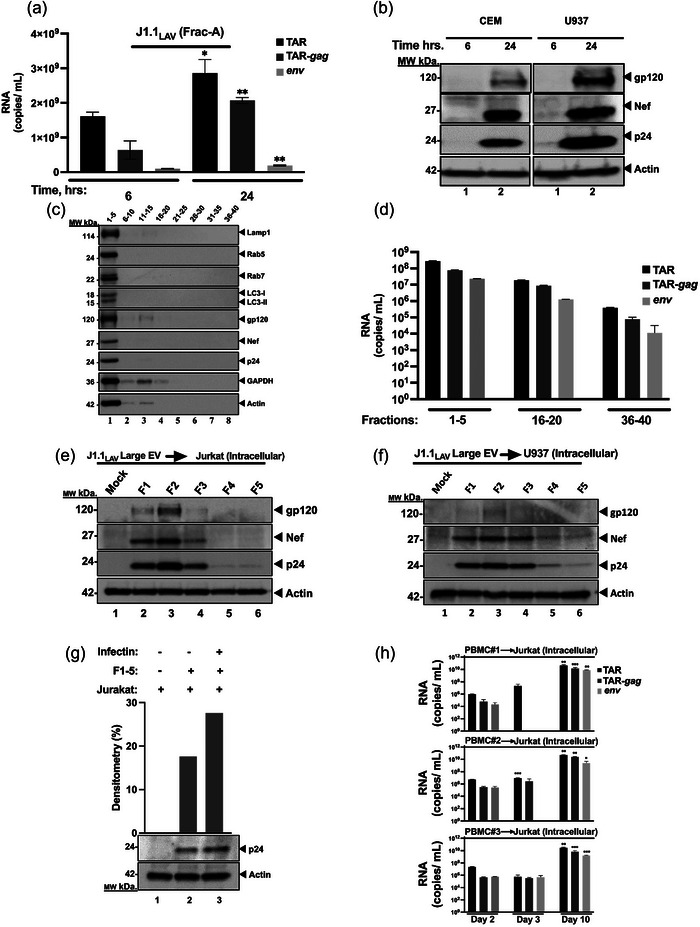
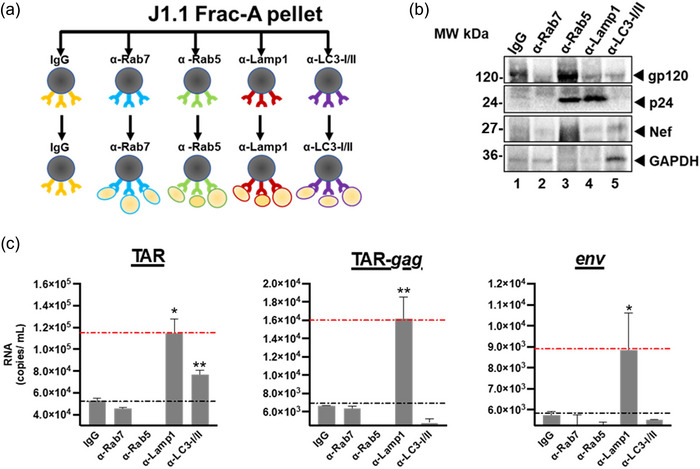
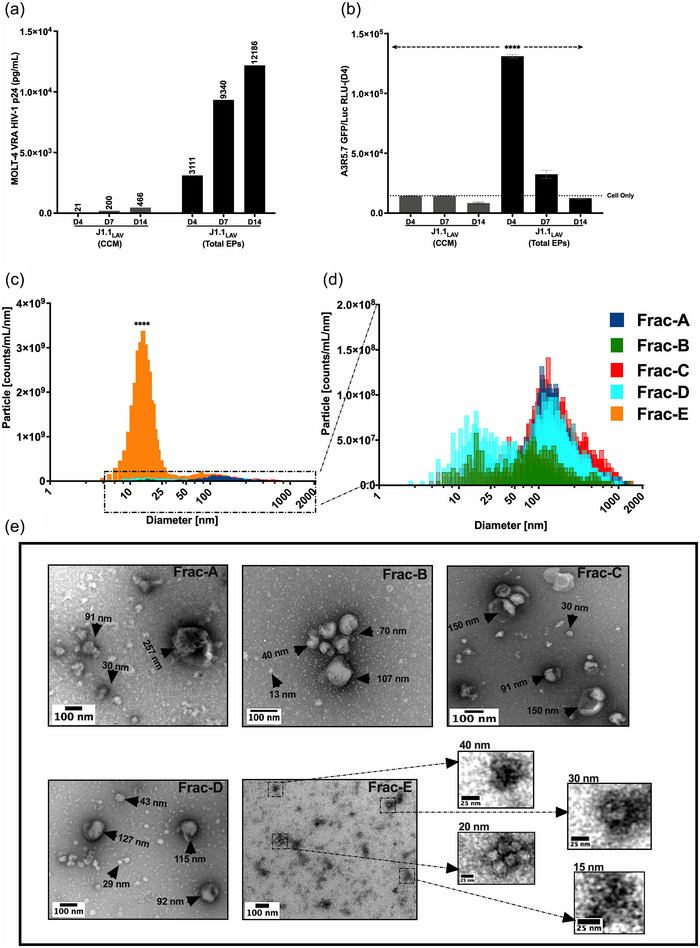
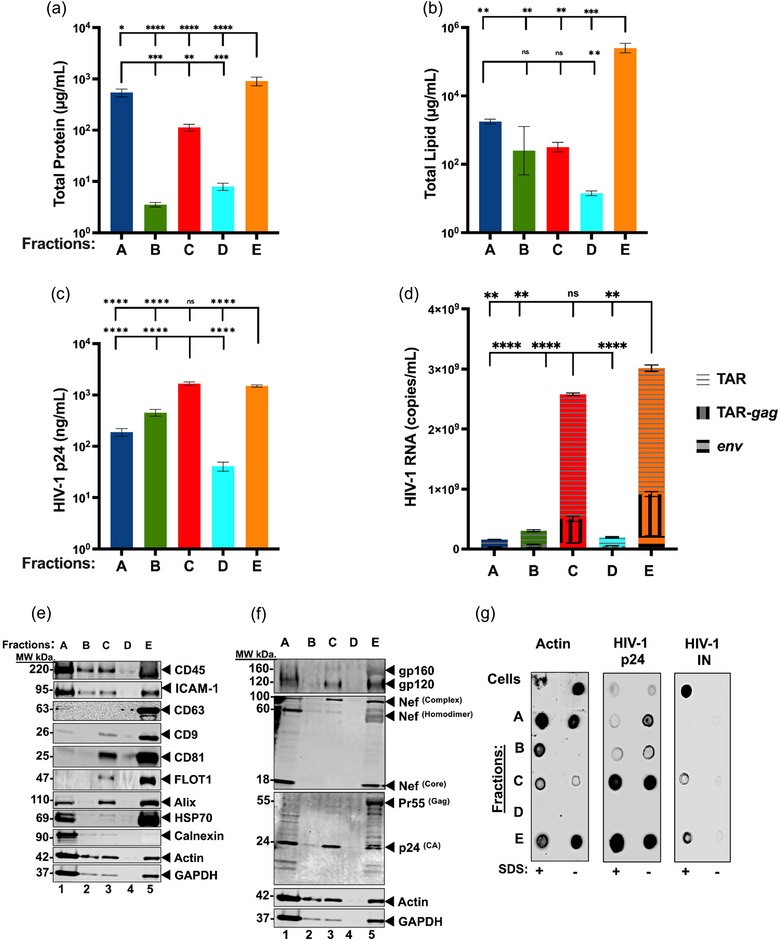
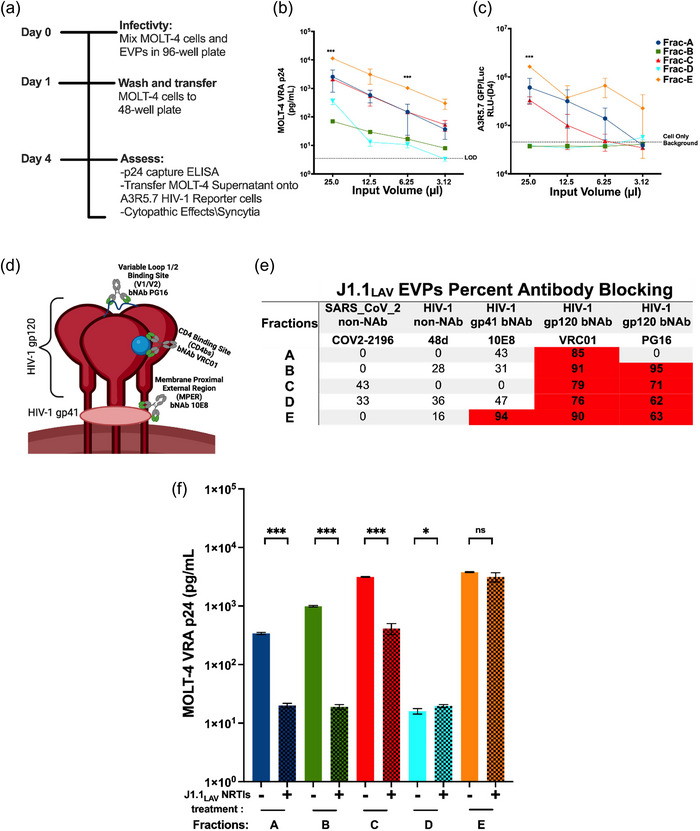
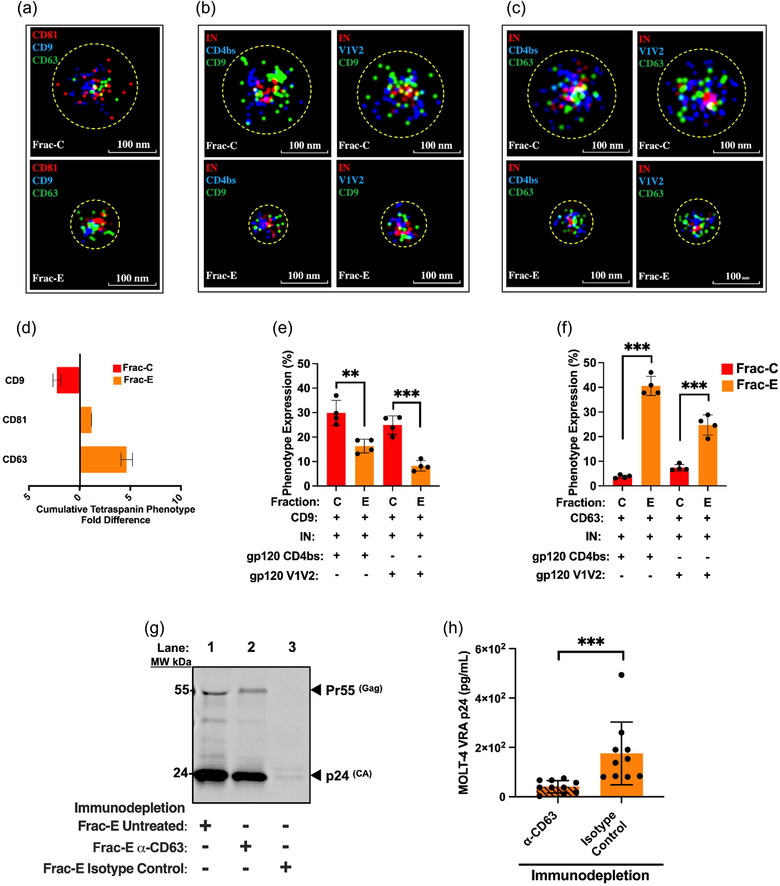
The current study analyzed the intersecting biophysical, biochemical, and functional properties of extracellular particles (EPs) with the human immunodeficiency virus type-1 (HIV-1) beyond the currently accepted size range for HIV-1. We isolated five fractions (Frac-A through Frac-E) from HIV-infected cells by sequential differential ultracentrifugation (DUC). All fractions showed a heterogeneous size distribution with median particle sizes greater than 100 nm for Frac-A through Frac-D but not for Frac-E, which contained small EPs with an average size well below 50 nm. Synchronized and released cultures contained large infectious EPs in Frac-A, with markers of amphisomes and viral components. Additionally, Frac-E uniquely contained EPs positive for CD63, HSP70, and HIV-1 proteins. Despite its small average size, Frac-E contained membrane-protected viral integrase, detectable only after SDS treatment, indicating that it is enclosed in vesicles. Single particle analysis with dSTORM further supported these findings as CD63, HIV-1 integrase, and the viral surface envelope (Env) glycoprotein (gp) colocalized on the same Frac-E particles. Surprisingly, Frac-E EPs were infectious, and infectivity was significantly reduced by immunodepleting Frac-E with anti-CD63, indicating the presence of this protein on the surface of infectious small EPs in Frac-E. To our knowledge, this is the first time that extracellular vesicle (EV) isolation methods have identified infectious small HIV-1 particles (smHIV-1) that are under 50 nm. Collectively, our data indicate that the crossroads between EPs and HIV-1 potentially extend beyond the currently accepted biophysical properties of HIV-1, which may have further implications for viral pathogenesis.

Keywords: HIV‐1; NRTIs; amphisomes; cART; exomeres; exosomes; extracellular particles; extracellular vesicles; smHIV‐1; small HIV.


Conflict of interest statement

The authors declare no conflicts of interest.

Figures

FIGURE 1
FIGURE 1
Isolation and characterization of early versus late extracellular vesicles from HIV‐1‐infected T‐cells. (a) J1.1 cells (5 × 10⁷ cells/mL) were serum‐starved in 1% FBS media to induce cell cycle synchronization (G0 stage of the cell cycle) and incubated with cART cocktail. Next, the cells were released in complete media containing 20% EPs‐depleted serum and PHA/IL‐2 (1 µg/mL and 25 units/mL, respectively) to increase HIV‐1 transcription and reverse latency; (b) Schematics of the DUC steps used to isolate various EPs populations including 2K, 10K, 100K, 167K/4 h, 167K/16 h (as Fracs A‐E); (c) Сell viability analysis of HIV‐1 infected T‐cells before serum starvation (‐72 h), before release (0 h), 6 h and 24 h post‐release; (d) EPs pellets of the fractions A‐E for 6 (lanes 1−5) and 24 h (lanes 6−10) were first processed on a G‐50 Sephadex spin column to remove ∼50% serum albumin (packed bed volume of 0.5 mL and spin of 2,000 × g for 2 min) and then analyzed by Western blotting for exosomal markers CD9, CD81 and CD63, autophagy markers (LC3‐I, and LC3‐II), HIV‐1 viral proteins (gp120, Vpr and p24), actin and GAPDH as a control; (e) total RNA from the pellets was extracted and analyzed by RT‐qPCR (technical triplicates) for HIV‐1 transcripts (TAR, TAR‐gag and env), a two‐tailed Student's t‐test was used to assess significance: **P <  0.01, ***P <  0.001.
FIGURE 2
FIGURE 2
J1.1LAV large extracellular vesicles (Frac‐A) isolation and characterization. (a) Total RNA from Frac‐A pellets collected at 6 and 24 h was extracted and analyzed by RT‐qPCR for HIV‐1 transcripts (TAR, TAR‐gag and env); (b) Frac‐A samples collected post‐release from J1.1 cells at 6 and 24 h were used to treat naïve CEM and U937 cells. A total of 106 naïve cells were resuspended in 100 µL supernatant and 200 µL of media and incubated for 8 h, then the supernatants were removed, and cells were placed in 1 mL fresh media and incubated for 48 h The cells were then collected and processed for Western blot and probed for HIV‐1 proteins; (c) Large J1.1 EPs (Frac‐A) were loaded onto Izon qEV 70 nm single columns. Forty fractions were collected and pooled in sets of 5. Pooled fractions were then nanotrapped and Western‐blotted for Lamp1, Rab5, Rab7, LC3, gp120, Nef, p24, GAPDH, and actin using Western blot; (d) HIV‐1 RNA content of pooled SEC fractions derived from large EVs population produced by J1.1 cells. Next, the fractions 1‐5 were used to treat naïve Jurkat (e), and U937 cells (f). A total of 106 naïve cells were resuspended in 100 µL supernatant, and 200 µL of media and 50 µL of Infectin™ and incubated for 8 h, then the supernatants were removed, and cells were placed in 1 mL fresh media and incubated for 2 days. The cells were then harvested and pelleted for Western blot analysis. Separately the pooled fractions 1‐5 were tested on infectivity with the use of Infectin™ as a control (g). Densitometry percent count of HIV‐1 p24 expression was determined relative to actin. (h) Next, infectivity of large EPs from HIV‐1‐infected primary cells was assessed. PBMCs from three donors were treated with PHA and IL‐2 and allowed to grow for 5 days in culture. The PBMCs were then infected with HIV‐1 89.6 (MOI: 10) with Infectin™ and cultured for another 4 days. Cells were then removed, and supernatants were centrifuged at 2,000 × g for 45 min to collect large EPs, that were fractionated by sizing columns and used to infect recipient cells. The recipient cells were separated in half and collected in 3‐ and 10 days post‐infection, respectively, and F#2 represents the starting material from fraction #2 used for infection of Jurkat cells; total RNA from fractionated EPs and recipient cells was isolated. Using 3′‐end primers specific to TAR, TAR‐gag and env regions, cDNA was produced. RNA levels were assessed by RT‐qPCR with TAR‐specific primers. Student's t‐tests compared HIV‐1 RNA copy numbers from the fractions used for infection and from the recipient cells collected at 3‐ and 10‐days post‐infection. *P < 0.05; **P < 0.01, ***P < 0.001. Error bars, SD.
FIGURE 3
FIGURE 3
Immunoprecipitation from J1.1LAV Frac‐A. (a) Diagram of the immunoprecipitation performed with a‐Rab7, a‐Rab5, a‐Lamp1, and a‐LC3 antibodies using fractions 1‐5 from qEV 70 size exclusion chromatography; (b) IP‐ed samples were pulled‐down washed and probed for the presence of viral proteins gp120/160, p24, Nef, and GAPDH by WB and (c) viral RNAs such as TAR, TAR‐gag and env by qRT‐PCR where IgG served as control. Data represents mean ± standard deviation (SD) of three technical replicate measurements. Statistical significance was calculated with a two‐tailed unpaired Student's t‐test *P < 0.05, **P < 0.01 significance level.
FIGURE 4
FIGURE 4
MOLT‐4 VRA of J1.1LAV cell culture conditioned media (CCM) and J1.1LAV ultracentrifuged (167,000 g × 18 H) total particles pellets (Total EPs 100 × concentrated CCM) and biophysical characterization of Fraction A through E. (a) J1.1 LAV (CCM) and J1.1LAV (Total Particles) MOLT‐4 VRA supernatant HIV‐1 p24 (pg/mL) assessment at day 4, 7 and 14; (b) Day 4, 7, and 14 MOLT‐4 VRA supernatant transferred onto A3R5.7 GFP/Luc HIV‐1 indicator cells, induction of firefly luciferase (Luc) expression measured as relative light units (RLU); (c) Graphical illustration of the particle size distribution (PSD) for J1.1 fractions, with Frac‐E in comparison to all the other fractions; (d) magnification of boxed in section from panel (a) for Frac‐A through Frac‐D; (e) TEM representative micrographs of Frac‐A through Frac‐E, black arrowheads and inserts indicate sizing of EPs contained in the fractions. The PSD graphs were generated with the data extracted from the constant bin tables with 1 nm bin sizes with an integration range set from 0 nm to 2,000 nm. Scale bars on the electron micrograph images represent 100 nm in the small inserts 25 nm. Data represents mean ± standard deviation (SD) of three technical replicate measurements. Statistical significance was calculated with One‐way ANOVA with Tukey's post‐hoc analysis multiple comparisons test with ****P < 0.0001 significance level.
FIGURE 5
FIGURE 5
Biochemical content analysis of J1.1LAV EPs. (a) Micro BCA total protein content (µg/mL); (b) Total lipid assay (µg/mL); (c) HIV‐1 p24‐antigen capture ELISA (pg/mL); (d) Cumulative RT‐qPCR for HIV‐1 RNA TAR TAR‐gag (copies/mL); (e) J1.1LAV EPs fractions western blotting (WB) probed for T‐cell marker (CD45), cell adhesion (ICAM‐1), extracellular vesicle tetraspanins markers (CD63, CD9, and CD81), extracellular cargo marker (TSG101, Alix, HSP70, Actin); (f) J1.1LAV EPs fractions WB for HIV‐1 protein content (gp120, Nef, and p24); (g) J1.1LAV EPs SDS membrane protection assay dot blotting of treated or not treated fractions probed for the presence Actin and HIV‐1 markers p24, Integrase (IN). For each measurement technical triplicates were executed. Data represents mean ± standard deviation (SD) of three technical replicate measurements. Statistical significance was calculated with One‐way ANOVA with Tukey's post‐hoc analysis multiple comparisons test with *P < 0.05, **P < 0.01, ***P < 0.001, ****P < 0.0001 significance level.
FIGURE 6
FIGURE 6
J1.1LAV EPs MOLT‐4 Virus recovery assay (VRA) with HIV‐1 monoclonal virus blocking and MOLT‐4 VRA assessment of viral production interference with NRTIs. (a) MOLT‐4 VRA assay schematics. (b) MOLT‐4 VRA supernatant HIV‐1 p24 pg/well levels measured on day 4 MOLT‐4 VRA initiation (LOD) Limit of Detection; (c) MOLT‐4 VRA supernatant transferred onto HIV‐1 A3R5.7 GFP/Luc viral indicator cells, where 4 days post‐transfer luciferase (Luc) activity was developed and measured as relative light units (RLU); (d) Model of HIV‐1 envelope glycoprotein (gp) with gp120 broadly neutralizing antibody (bNab) PG16 specific to the V1/V2 loop or VRC01 specific to the CD4bs, respectively, with gp41 specific bNab 10E8; (e) HIV‐1 bNAb blocking data, where equal volumes of EPs fractions were mixed with 12.5 µg/mL HIV‐1 bNAb to a final mAb concentration of 6.25 µg/mL or PBS (mock). The percent MOLT‐4 VRA infectivity reductions were calculated as a function of HIV‐1 p24 reduction compared to the PBS mock tread control wells. The data represents the percent average of two individual antibody blocking experiments where HIV‐1 non‐neutralizing antibody (non‐NAb); (f) NRTIs viral production interference, where the EPs fractions were recovered from naïve J1.1LAV or J1.1LAV NRTIs‐treated cells cultures and used in MOLT‐4 VRA and at day 4 p24 (pg/mL) was measurement with p24 capture ELISA, the input for the fractions was normalized within each pair based on the EPs counts. Data represents mean ± standard deviation (SD) of three technical replicate measurements. Statistical significance was calculated for panel (a and b) with One‐way ANOVA with Tukey's post‐hoc analysis multiple comparisons test and for panel (f) with two‐tailed unpaired Student's t‐test significance level *P < 0.05, **P < 0.01, ***P < 0.001, ****P < 0.0001 significance level.
FIGURE 7
FIGURE 7
Analysis of J1.1LAV Frac‐C and Frac‐E with Frac‐E CD63 immunodepletion. (a) Representative dSTROM images for Frac‐C and Frac‐E EPs tetraspanin staining triple positive CD81+/CD9+/CD63+; (b) representative triple positive CD9+/IN+/CD4bs+ and CD9+/IN+/V1V2+ dSTROM images for Frac‐C and Frac‐E;(c) representative triple positive CD63+/IN+/CD4bs+ and CD63+/IN+/V1V2+ dSTROM images for Frac‐C and Frac‐E; (d) cumulative tetraspanin CD81+, CD9+, CD63+ percent phenotype fold difference between Frac‐C and Frac‐E; (e) CD9 triple positive with HIV‐1 IN+, HIV‐1 gp120 CD4bs+ or gp120 V1V2+ phenotype expression differences between Frac‐C and Frac‐E; (f) CD63 triple positive with HIV‐1 IN+, HIV‐1 gp120 CD4bs+ or gp120 V1V2+ phenotype expression differences between Frac‐C and Frac‐E; (g) Frac‐E CD63 or IgG isotype control immunodepleted complex retained on magnetic protein‐G capture beads resuspended in 1XSDS loading buffer under non‐reducing conditions and used for WB (as described in the methods sections), which was probed for p24 HIV‐1 core protein; (h) MOLT‐4 VRA of Frac‐E supernatants after CD63 and isotype control immunodepletion, results reflect three independent biological immunodepletion replicate experiments with three technical replicate measurements of HIV‐1 p24 by capture ELISA. dSTORM images were analyzed (n > 5000 EPs per quadruplicate experiment) at a magnification of 0.578 nm/pixels with the circles (yellow segmented line) representing the relative size of each EPs as measured in CODI using clustering analysis. Data represents mean ± standard deviation (SD) of either four technical replicate measurements (dSTORM) or five biological experiments with duplicate measurements (MOLT‐4 VRA Immunoprecipitation). Statistical significance for panels (e, f, and g) was calculated with unpaired two‐tailed Student's t‐test according to its distribution where the *P < 0.05; ***P < 0.001 significance.

References

    1. Anand, S. , Samuel, M. , & Mathivanan, S. (2021). Exomeres: A new member of extracellular vesicles family. Sub‐cellular biochemistry, 97, 89–97. - PubMed
    1. Arakelyan, A. , Fitzgerald, W. , Zicari, S. , Vanpouille, C. , & Margolis, L. (2017). Extracellular vesicles carry HIV env and facilitate HIV infection of human lymphoid tissue. Scientific reports, 7(1), 1695. - PMC - PubMed
    1. Archin, N. M. , Sung, J. M. , Garrido, C. , Soriano‐Sarabia, N. , & Margolis, D. M. (2014). Eradicating HIV‐1 infection: Seeking to clear a persistent pathogen. Nature reviews. Microbiology, 12(11), 750–764. - PMC - PubMed
    1. Barclay, R. A. , Schwab, A. , DeMarino, C. , Akpamagbo, Y. , Lepene, B. , Kassaye, S. , Iordanskiy, S. , & Kashanchi, F. (2017). Exosomes from uninfected cells activate transcription of latent HIV‐1. The Journal of biological chemistry, 292(28), 11682–11701. - PMC - PubMed
    1. Berman, J. J. (2019). Changing how we think about infectious diseases. Taxonomic Guide to Infectious Diseases, 321–365. 10.1016/B978-0-12-817576-7.00008-0. PMCID: PMC7149514. - DOI

LinkOut - more resources