. 2024 Sep;11(34):e2309473.
doi: 10.1002/advs.202309473. Epub 2024 Jul 8.

Melatonin Ameliorates Depressive-Like Behaviors in Ovariectomized Mice by Improving Tryptophan Metabolism via Inhibition of Gut Microbe Alistipes Inops

Affiliations

Melatonin Ameliorates Depressive-Like Behaviors in Ovariectomized Mice by Improving Tryptophan Metabolism via Inhibition of Gut Microbe Alistipes Inops

Kai-Yu Zheng et al. Adv Sci (Weinh). 2024 Sep.

Abstract

Melatonin (N-acetyl-5-methoxytryptamine) is reported to improve mood disorders in perimenopausal women and gut microbiome composition is altered during menopausal period. The possible role of microbiome in the treatment effect of melatonin on menopausal depression remains unknown. Here, it is shown that melatonin treatment reverses the gut microbiota dysbiosis and depressive-like behaviors in ovariectomy (OVX) operated mice. This effect of melatonin is prevented by antibiotic cocktails (ABX) treatment. Transferring microbiota harvested from adolescent female mice to OVX-operated mice is sufficient to ameliorate depressive-like behaviors. Conversely, microbiota transplantation from OVX-operated mice or melatonin-treated OVX-operated mice to naïve recipient mice exhibits similar phenotypes to donors. The colonization of Alistipes Inops, which is abundant in OVX-operated mice, confers the recipient with depressive-like behaviors. Further investigation indicates that the expansion of Alistipes Inops induced by OVX leads to the degradation of intestinal tryptophan, which destroys systemic tryptophan availability. Melatonin supplementation restores systemic tryptophan metabolic disorders by suppressing the growth of Alistipes Inops, which ameliorates depressive-like behaviors. These results highlight the previously unrecognized role of Alistipes Inops in the modulation of OVX-induced behavioral disorders and suggest that the application of melatonin to inhibit Alistipes Inops may serve as a potential strategy for preventing menopausal depressive symptoms.

Keywords: gut microbiota; melatonin; menopausal depression; tryptophans.


Conflict of interest statement

The authors declare no conflict of interest.

Figures
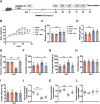
Figure 1
Figure 1
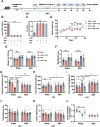
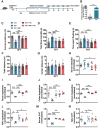
Exogenous supplementation of melatonin ameliorates OVX‐induced depressive‐like behaviors in mice. A) Schematic illustration of the experimental design. B) Body weight was monitored. n = 10–11 per group. C) Body weight on day 28. n = 10–11 per group. D) Weight gain from OVX operation until day 28. n = 10–11 per group. E) The sucrose‐in‐water ratio during SPT of Sham mice, Sham + Mel mice, OVX mice, and OVX + Mel mice. n = 10–11 per group. F) Total time immobile in the TST. n = 10–11 per group. G) The floating time in the FST. n = 10–11 per group. H) Total distance during OFT. n = 10–11 per group. I) Distance spent in the center during OFT. n = 10–11 per group. J) Serum level of estradiol was analyzed by ELISA. n = 5–8 per group. K) ELISA analysis of colonic melatonin protein normalized to controls. n = 7–10 per group. L) Melatonin level in serum was measured by ELISA. n = 7–12 per group. Data are the mean ± SEM and analyzed by three‐way ANOVA (B) or two‐way ANOVA (C–L) with Bonferroni's post‐hoc test, *p < 0.05, **p < 0.01, ***p < 0.001 Sham versus OVX; # p < 0.05, ### p < 0.001 Sham versus OVX + Mel; Mel: melatonin, ARS: acute restraint stress, SPT: sucrose preference test, OFT: open field test, TST: tail suspension test, FST: forced swim test, Sham: sham‐operated mice, Sham + Mel: melatonin treated sham‐operated mice, OVX: ovariectomy‐operated mice, OVX + Mel: melatonin treated ovariectomy‐operated mice.
Figure 2
Figure 2
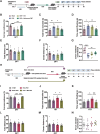
Melatonin produces antidepressant effects in a microbiota‐dependent manner. Sham mice, Sham + Mel mice, OVX mice, and OVX + Mel mice were treated with ABX or without ABX (Water). A) Schematic illustration of experimental design for depletion of the gut microbiota. B, C) Fecal DNA was isolated from ABX‐treated or no‐treated mice. B) DNA concentration was measured. n = 3–4 per group. C) 30 ng of DNA was used for quantification of the universal bacterial 16S rDNA gene by qRT‐PCR. n = 3–4 per group. Ct values of qRT‐PCR reflect relative bacterial burden in different treatment groups. D) Body weight was monitored after ABX treatment. n = 10–14 per group. E) Body weight on day 28 after OVX operation with water treatment (left) or ABX treatment (right). n = 9–25 per group. F) Weight gain during water treatment(left) or ABX treatment (right). n = 9–25 per group. G) The sucrose‐in‐water ratio during SPT after water treatment (left) or ABX treatment (right). n = 9–24 per group. H) Total time immobile in the TST after water treatment (left) or ABX treatment (right). n = 9–24 per group. I) The floating time in the FST after water treatment (left) or ABX treatment (right). n = 9–24 per group. J) Total distance during OFT after water treatment (left) or ABX treatment (right). n = 9–24 per group. K) Distance spent in the center zone during OFT after water treatment (left) or ABX treatment (right). n = 9–24 per group. L) ELISA quantification of melatonin after water treatment (left) or ABX treatment (right). n = 5–9 per group. All of the data are the mean ± SEM and analyzed by one‐way ANOVA (B–C) or three‐way ANOVA (D–L) with Bonferroni's post‐hoc test, *p < 0.05, **p < 0.01, ***p < 0.001 Sham + ABX versus OVX + ABX; ## p < 0.01, ### p < 0.001 Sham + ABX versus OVX + ABX + Mel.
Figure 3
Figure 3
FMT from either adolescent female mice or melatonin‐treated OVX mice is sufficient to relieve OVX‐induced depressive‐like behaviors. A) Schematic illustration of experimental design for assessing the effect of microbiota from adolescent female mice to OVX‐operated mice. B) The sucrose‐in‐water ratio during SPT of Sham mice, OVX mice, OVX + Vehicle mice, and OVX + Adolescent‐FMT mice. n = 10 per group. C) Total time immobile in the TST. n = 10 per group. D) The floating time in the FST. n = 9–10 per group. E) Total distance during OFT. n = 10 per group. F) Distance spent in the center zone during OFT. n = 10 per group. G) ELISA quantification of melatonin protein level in the colon normalized to controls. n = 13–19 per group. H) Schematic of the experimental design for assessing the effect of microbiota from OVX‐operated mice and melatonin‐treated OVX‐operated mice to recipient mice that were pretreated with ABX. I) The sucrose‐in‐water ratio during SPT of V‐FMT mice, Sham‐FMT mice, OVX‐FMT mice, and OVX + Mel‐FMT mice. n = 10–11 per group. J) Total time immobile in the TST. n = 10–11 per group. K) The floating time in the FST. n = 9–11 per group. L) Total distance during OFT. n = 10–11 per group. M) Distance spent in the center zone during OFT. n = 10–11 per group. N) Serum level of estradiol was analyzed by ELISA. n = 7–8 per group. All of the data are the mean ± SEM and analyzed by one‐way ANOVA (B–G and I–N) with Bonferroni's post‐hoc test, *p < 0.05, **p < 0.01, ***p < 0.001. Sham: sham‐operated mice, OVX: ovariectomy‐operated mice, OVX + Veh: ovariectomy‐operated mice treated with sterile saline, OVX + Adolescent‐FMT mice: ovariectomy‐operated mice received microbiota from adolescent female donor mice, V‐FMT: naïve female mice received sterile saline treatment, Sham‐FMT: naïve female mice received microbiota from sham‐operated donor mice, OVX‐FMT: naïve female mice received microbiota from ovariectomy‐operated donor mice, OVX + Mel‐FMT: naïve female mice received microbiota from melatonin‐treated ovariectomy‐operated donor mice.
Figure 4
Figure 4
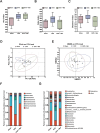
Exogenous melatonin supplementation reshapes the gut microbiota in ovariectomized mice. A–H) WT female mice were submitted to OVX and fed with 0.2 mg mL−1 melatonin in drinking water for 28 days. Stool samples were collected, and genomic DNA was isolated and sequenced for 16S rDNA gene at the V3‐V4 region. αDiversity was calculated by Ace index A), Sobs index B), and Shannon index C). n = 5 per group. D,E) β‐Diversity analysis of gut microbiota of different groups based on the OTU using the PCoA D) and NMDS E). n = 5 per group. F,G) Percent of community abundance on the phylum level F) and the genus level G). n = 5 per group.
Figure 5
Figure 5
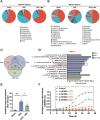
Melatonin selectively suppresses the proliferation of Alistipes Inops in ovariectomized mice. A, B) Relative abundance of fecal bacteria of Sham, OVX, and OVX + Mel mice on the phylum level A) and the genus level B). n = 5 per group. C) Venn diagrams illustrating the number of shared and exclusive bacteria at the species level under different conditions. n = 5 per group. D) Differences in microbial taxa at the species level between different groups were calculated by LEfSe. Kruskal‐Wallis test was used with a statistical significance cut‐off of p < 0.01 and LDA score > 2.00. E) Relative abundance of Alistipes Inops in the feces of Sham, OVX, and OVX + Mel mice. n = 5–6 per group. F) The growth curves of Alistipes Inops under melatonin treatment with various dosages in vitro (1, 2, 4, and 8 mm) OD 600 nm. n = 3 per group. Data are the mean ± SEM and calculated by one‐way ANOVA E) or two‐way ANOVA F) with Bonferroni's post‐hoc test, *p < 0.05, ***p < 0.001.
Figure 6
Figure 6
Melatonin attenuates OVX‐induced disturbance of tryptophan‐5‐HT metabolism in a microbiota‐dependent manner. A) The expression of fecal tryptophan was measured by ELISA of Sham mice, Sham + Mel mice, OVX mice, and OVX + Mel mice. n = 5–7 per group. B) The expression of colonic tryptophan was measured by ELISA. n = 7–8 per group. C) Serum level of tryptophan was analyzed by ELISA. n = 6–9 per group. D) Serum level of 5‐HT was analyzed by ELISA. n = 6–9 per group. E) ELISA quantification of tryptophan protein level in NAc normalized to controls. n = 10–12 per group. F) ELISA quantification of 5‐HT protein level in NAc normalized to controls. n = 10–11 per group. G) The expression of fecal tryptophan was measured by ELISA of V‐FMT mice, Sham‐FMT mice, OVX‐FMT mice, and OVX + Mel‐FMT mice. n = 6 per group. H) The expression of colonic tryptophan was measured by ELISA. n = 7–8 per group. I) Serum level of tryptophan was analyzed by ELISA. n = 7–8 per group. J) Serum level of 5‐HT was analyzed by ELISA. n = 7–8 per group. K) The level of tryptophan in the NAc was measured by ELISA. n = 5–8 per group. L) ELISA quantification of 5‐HT protein level in the NAc normalized to controls. n = 6–8 per group. All of the data are the mean ± SEM and analyzed by two‐way ANOVA (A–F) or one‐way ANOVA (G–L) with Bonferroni's post‐hoc test, *p < 0.05, **p < 0.01, ***p < 0.001.
Figure 7
Figure 7
Melatonin produces antidepressant action in Alistipes Inops‐colonized mice by restoring tryptophan‐5‐HT metabolism. A) Schematic representation of Alistipes Inops colonization paradigm for female mice. B) The graph represents the Alistipes Inops levels in the fecal samples collected from the colon of Con and Alis groups of mice. n = 5–7 per group. C) The sucrose‐in‐water ratio in the SPT of Con mice, Alis mice, Alis + Mel mice, Alis + Trp mice, and Alis + Mel + Trp mice. n = 16–19 per group. D) Total time immobile in the TST. n = 14–19 per group. E) The floating time in the FST. n = 14–19 per group. F) Total distance during OFT. n = 16–19 per group. G) Distance spent in the center zone during OFT. n = 16–19 per group. H) Serum level of estradiol was analyzed by ELISA. n = 10–13 per group. I) Fecal level of tryptophan was analyzed by ELISA. n = 5–6 per group. J) Colonic level of tryptophan was analyzed by ELISA n = 5–7 per group. K) Serum level of tryptophan was analyzed by ELISA n = 5–7 per group. L) The level of tryptophan in the NAc was measured by ELISA. n = 4–7 per group. M) Serum level of 5‐HT was analyzed by ELISA. n = 5–7 per group. N) ELISA quantification of 5‐HT protein level in the NAc normalized to controls. n = 5–7 per group. All of the data are the mean ± SEM and analyzed by Student's t‐test (B) or one‐way ANOVA (C–N) with Bonferroni's post‐hoc test, *p < 0.05, **p < 0.01, ***p < 0.001. Con: naïve female mice received sterile saline treatment, Ali: Alistipes Inops‐colonized mice, Ali + Mel: Alistipes Inops‐colonized mice treated with melatonin, Ali + Trp: Alistipes Inops‐colonized mice treated with tryptophan, Ali + Mel + Trp: Alistipes Inops‐colonized mice treated with melatonin and tryptophan.
Figure 8
Figure 8
Schematic illustration of the antidepressant effect of melatonin on OVX model of depression. An increase in the abundance of Alisipes Inops led to the degradation of intestinal tryptophan, which destroyed the systemic tryptophan‐5‐HT availability and thus induced depressive‐like behaviors. Melatonin supplementation restored systemic tryptophan‐5‐HT metabolic disorders by suppressing the growth of Alistipes Inops, which ameliorated depressive‐like behaviors.

References

    1. Roberts N. L., Mountjoy‐Venning W. C., Anjomshoa M., Banoub J. A., Yasin Y. J., Lancet 2018, 392, 1789.
    1. Kuehner C., The Lancet Psychiatry 2017, 4, 146. - PubMed
    1. Bromberger J. T., Kravitz H. M., Chang Y. F., Cyranowski J. M., Brown C., Matthews K. A., Psychol Med 2011, 41, 1879. - PMC - PubMed
    1. Freeman E. W., Sammel M. D., Boorman D. W., Zhang R., JAMA Psychiatry 2014, 71, 36. - PMC - PubMed
    1. Graham M. E., Herbert W. G., Song S. D., Raman H. N., Zhu J. E., Gonzalez P. E., Walther‐António M. R. S., Tetel M. J., Trends Endocrinol. Metab. 2021, 32, 554. - PMC - PubMed

LinkOut - more resources