[Preprint]. 2024 Jun 25:rs.3.rs-4410500.
doi: 10.21203/rs.3.rs-4410500/v1.

Multi-omic analysis of SDHB-deficient pheochromocytomas and paragangliomas identifies metastasis and treatment-related molecular profiles

Affiliations

Multi-omic analysis of SDHB-deficient pheochromocytomas and paragangliomas identifies metastasis and treatment-related molecular profiles

Aidan Flynn et al. Res Sq. .

Update in

Abstract

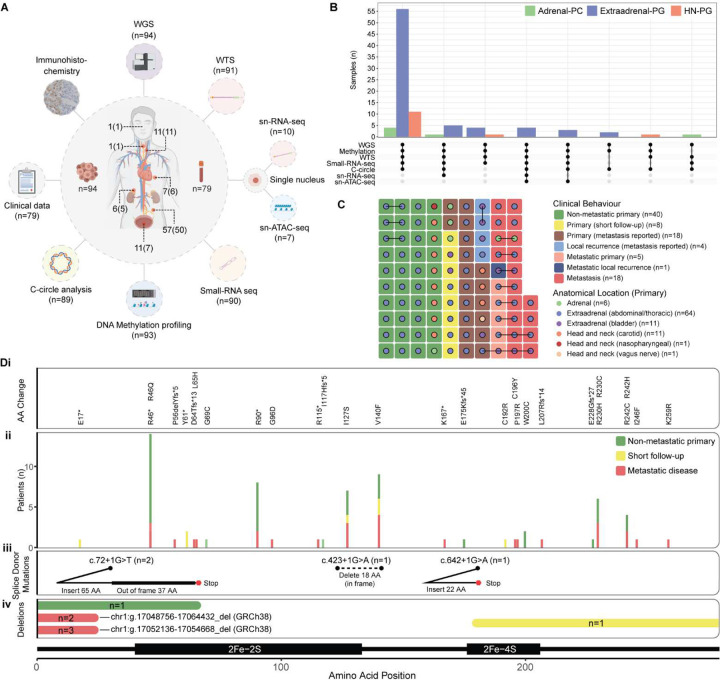
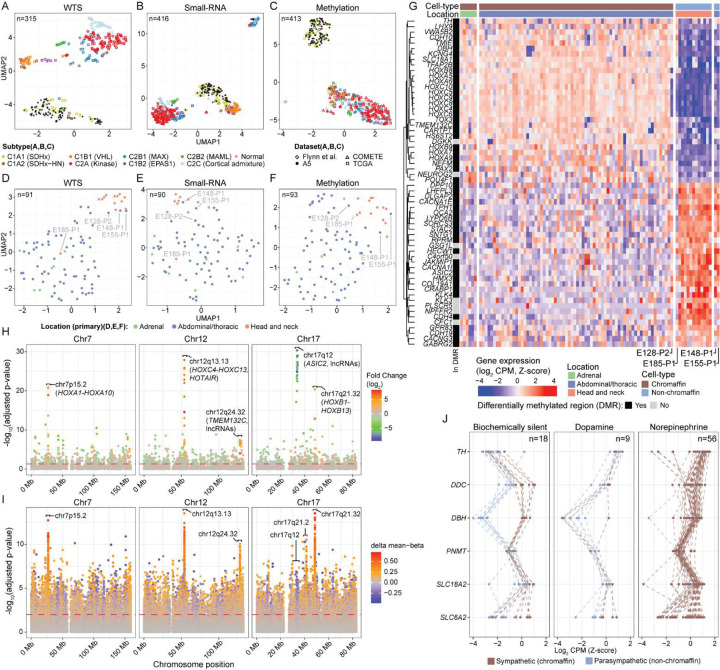
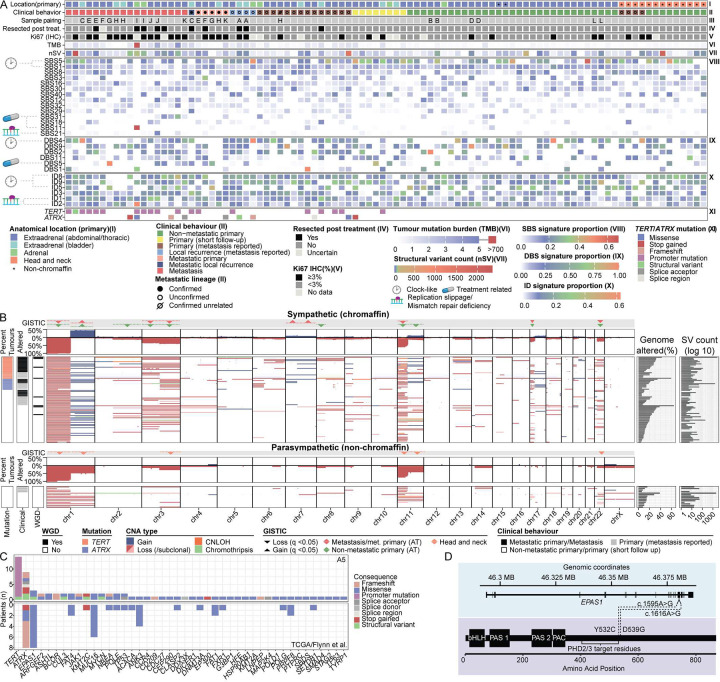
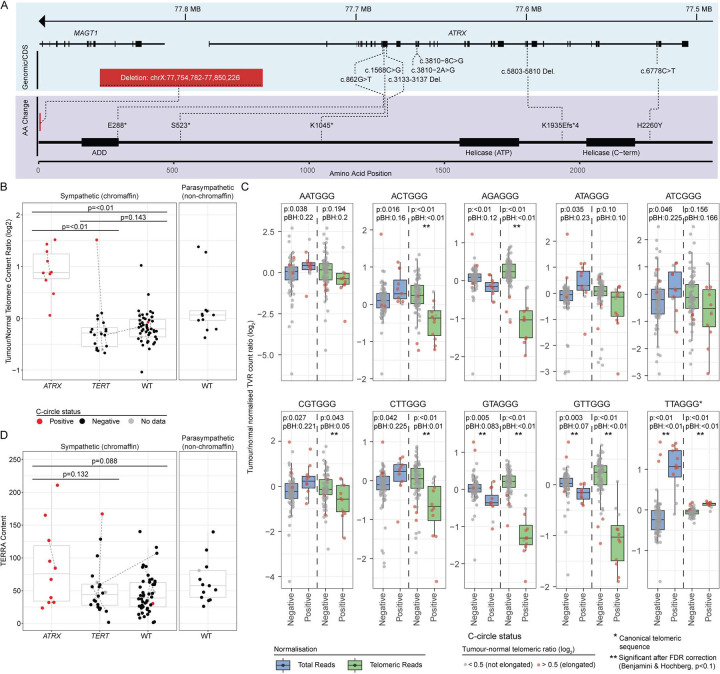
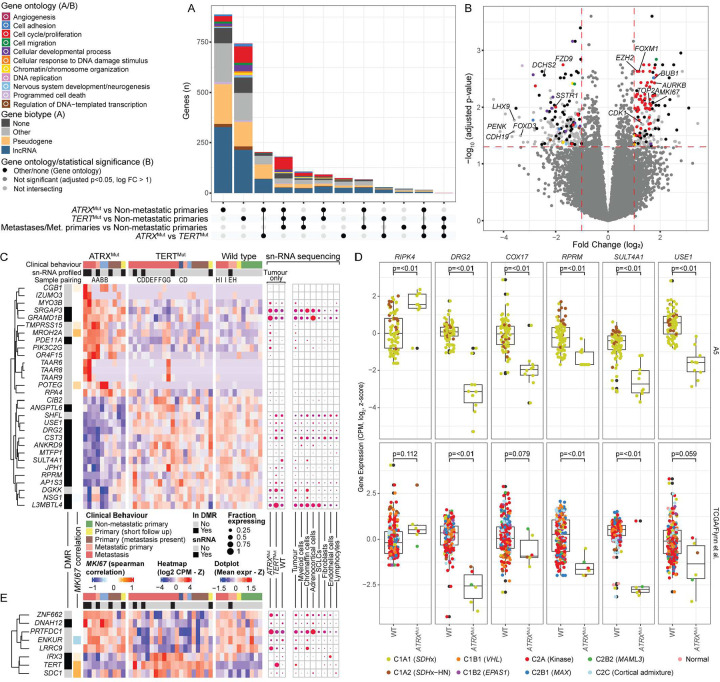
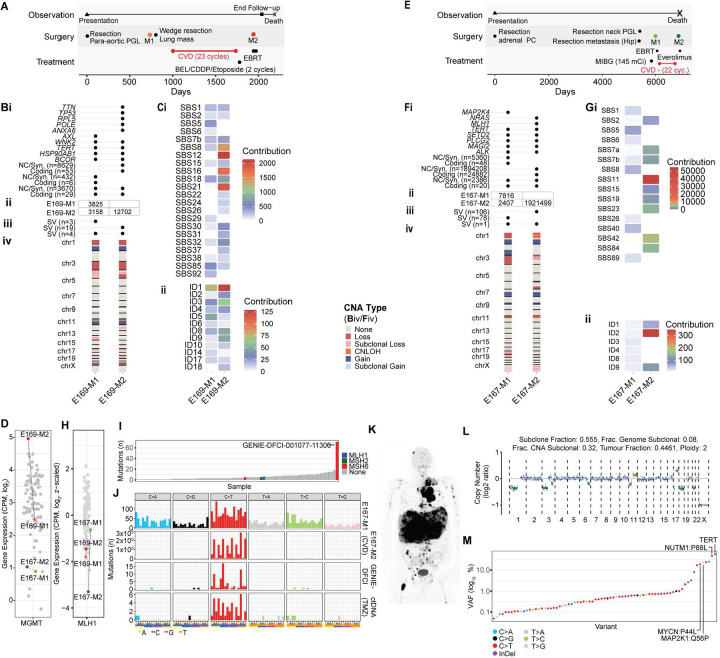
Hereditary SDHB-mutant pheochromocytomas (PC) and paragangliomas (PG) are rare tumours with a high propensity to metastasize although their clinical behaviour is unpredictable. To characterize the genomic landscape of these tumours and identify metastasis biomarkers, we performed multi-omic analysis on 94 tumours from 79 patients using seven molecular methods. Sympathetic (chromaffin cell) and parasympathetic (non-chromaffin cell) PCPG had distinct molecular profiles reflecting their cell-of-origin and biochemical profile. TERT and ATRX-alterations were associated with metastatic PCPG and these tumours had an increased mutation load, and distinct transcriptional and telomeric features. Most PCPG had quiet genomes with some rare co-operative driver events observed, including EPAS1/HIF-2α mutations. Two mechanisms of acquired resistance to DNA alkylating chemotherapies were also detected - MGMT overexpression and mismatch repair-deficiency causing hypermutation. Our comprehensive multi-omic analysis of SDHB-mutant PCPG therefore identified features of metastatic disease and treatment response, expanding our understanding of these rare neuroendocrine tumours.


Conflict of interest statement

Competing interests The authors declare no competing interests.

Figures

Figure 1:
Figure 1:. Multi-omic analysis of SDHB-mutated PCPG
(A) Outer ring: Overview of the analytical methods applied to the cohort annotated with the number of tumours analysed. Inner ring: The number of tumours and patients (in parenthesis) analysed from each anatomical location. Where a metastasis was analysed, the location of the primary tumour is indicated. (B) A summary of the combination of analytical methods applied to each tumour with respect to anatomical primary location. The upper panel indicates the total number of samples from each anatomical location analysed with the respective combination of assays (lower panel). (C) Anatomical location (dot colour) and clinical behaviour (tile colour) of each tumour analysed. Paired samples from the same patient are joined by a line. (D) Summary of the germline SDHB mutations detected by WGS across the cohort and their respective position within the protein amino acid sequence. (i) Amino acid changes for single nucleotide variants and small insertion/deletion events (NP_002991.2). (ii) The total number of patients observed with each amino acid change where bar colour indicates the clinical disease course. (iii) Schematic of the consequence of splice donor mutations. (iv) Regions of the SDHB protein sequence deleted by large scale structural events. Bar colour indicates the clinical disease course and the number of patients affected is indicated within the bar.
Figure 2:
Figure 2:. Genomic profiling separates sympathetic and parasympathetic PGL
UMAP dimensional reduction was used to cluster WTS (A), small-RNA-seq (B) and DNA methylation data (C) with previously published data. UMAP clustering was also repeated for respective A5 data types in isolation (D-F). (G) Differential expression profiling was performed between abdominal-thoracic PCPG and HN-PG. The heatmap shows CPM (log2, z-score) expression values for each tumour (x-axis) for the top differentially expressed genes (adjusted p-value < 0.05, ranked by log-fold-change, top and bottom 30 genes are shown)(y-axis). The top annotation bars indicate the suspected cell-of-origin based on UMAP clustering and the anatomical location of the tumour, respectively. The left annotation bar indicates whether the gene was also in a differentially methylated region for the same contrast. (H/I) Spatial distribution of adjusted p-values (y-axis, −log10) along chromosomes 7, 12, and 17 (x-axis) from differential expression (H) and probe-level differential methylation analysis (I) between sympathetic PCPG and HN-PG. (J) Expression of catecholamine biosynthesis and processing pathway genes. Line colour indicates the anatomical location of the tumour and sub-panels segregate tumours based on which catecholamines were above upper normal limit during clinical testing. Expression data for the A5 cohort were combined with a larger compendium of publicly available PCPG representing the different PCPG subtypes before values were normalized to Z-scores. Only A5 tumours are shown.
Figure 3:
Figure 3:. Genomic and clinical features of PCPG
(A)(i) Tile colour indicates the anatomical location of the tumour or, in the case of a metastasis, the associated primary tumour. An asterisk indicates whether the tumour had a non-chromaffin expression signature. (ii) Tile colour indicates the clinical behaviour of the tumour. Primary tumours resected from patients with metastatic disease are further annotated as to whether the tumour was able (filled circle) or unable (open circle) to be confirmed as the metastatic clone through sequencing of a paired metastasis. (iii) An identifier linking samples from the same patient. (iv) Indicates if the sample was resected after a cytotoxic treatment regime. (v) Immunohistochemical scoring of Ki67 expression, tumours with greater than 3% positive cells are indicated by a black square. (vi) Tumour mutation burden (mutations per megabase) and (vii) number of structural variants are indicated using a heatmap. (viii-x) Signature analysis was performed using the MutationalSignatures package for R. SBS signatures ranked (top to bottom) based on the mean proportional contribution of variants. Output was filtered to retain signatures that contributed 15% of mutations and at least 500, 50, or 10 mutations for SBS, ID, and DBS signatures, respectively, in at least one tumour. Colour indicates the proportion of mutations from each class attributable to the respective signature for a given sample. (xi) The presence of a TERT or ATRX mutation detected by WGS. (B) Aggregate and per-sample copy number aberrations detected by WGS in sympathetic (rows 2 and 3) and parasympathetic (rows 5 and 6) PCPG. Regions that were detected as significantly recurrently deleted (downward arrow) or amplified (upwards arrow) are indicated (rows 1 and 4). Clinical behaviour and the presence of whole genome doubling are annotated to the left of per-sample data (rows 3 and 5), while the percentage of genome altered and number of structural variants observed in each tumour are annotated on the right. Losses and gains as well as percent genome altered are expressed relative to sample ploidy rather than diploid. (C) Genes that were detected as recurrently altered by WGS and predicted to be drivers by Cancer Genome Interpreter across the A5 cohort (top) and the respective number of mutations observed in two previously published datasets (bottom). (D) Schematic showing the DNA and protein position of two somatic mutations observed in EPAS1.
Figure 4.
Figure 4.. TERT promoter mutations and structural alterations
(A) sn-ATAC-seq covering the TERT gene and promoter (inset) region. Data is shown for tumour cells from two ATRX mutant tumours, three TERT mutant tumours, and one tumour with a TERT structural variant. Normal chromaffin, adrenocortical, fibroblast, and endothelial cells are shown for contrast. (B)(i) Circos plot describing somatic alterations detected by WGS in E123-M1. Outer ring indicates chromosome, second outer ring marks SNVs (blue: C>A, black: C>G, red: C>T, grey: T>A, green: T>C, pink: T>G) and Indels (yellow: insertions, red: deletions). Third outer ring indicates total copy number, (green: >2, red: <2), the fourth outer ring indicates the copy number of the minor allele (blue: >1, orange: <1). The center circle displays structural variants. (ii) Copy number segmentation data from the AFF4 and TERT gene regions in E123-M1 showing multiple short segmental copy-number changes due to chromothripsis. The break points contributing to an AFF4-TERT fusion are marked with red dashed lines. (iii) Schematic of AFF4-TERT fusion detected by WTS. (C) TERT expression (y-axis, log2 CPM) versus gene copy number at the TERT locus (x-axis) (D) TERT expression (y-axis, log2 CPM) versus the methylation status (x-axis) of probes in the TERT promoter and TERT hypermethylated oncological regions (rows 1 and 3). Density plot of probe methylation beta-values (rows 2 and 4). Point and line colour indicate TERT/ATRX mutation status.
Figure 5:
Figure 5:. Loss of ATRX leads to telomere dysregulation
(A) Genomic (top) and protein (bottom) position of alterations detected in the ATRX gene by WGS. (B) Ratio of tumour to normal telomere read content (y-axis) in relation to ATRX and TERT mutation status (x-axis). Presence (red) or absence (black) of C-circles is indicated by the dot colour. Paired tumours from the same patient are joined by a dashed line. A two-sided Student’s t-test was used to test for differences. Values were averaged across paired tumours prior to statistical testing. (C) Telomere variant repeats (TVRs) of the type NNNGGG (and the reverse complement) were detected in WGS data from tumour and matched normal using TelomereHunter. Count values were normalized against intratelomeric read count (green) or total read count (blue). The tumour/normal ratio of normalized counts (y-axis) are shown with respect to the presence or absence of detected c-circles (x-axis). Only TVR sequences that were significantly different using a Students t-test (p<0.05) applied to values normalized to total reads are shown. TVRs that were significant after false-discovery correction (Benjamini & Hochberg, p<0.1) are indicated with a double-asterisk. P-values before (p) and after (pBH) correction are shown. Data points are coloured to indicate a tumour/normal telomere content ratio (log2) greater than (red) or less than (grey) 0.5 (D) Reads containing telomeric sequences were counted from WTS data using TelomereHunter. The telomeric content (y-axis) was computed as the number of unmapped reads containing telomeric sequence times 1,000,000 divided by the total number of reads with a GC content similar to telomeric repeats. Data point colours, x-axis, and statistical testing are as described in panel B. The lower and upper hinges of each boxplot correspond to the first and third quartiles, respectively, and the median value is marked. The whiskers extend to the largest and smallest value no greater than 1.5 times the interquartile range above or below the upper and lower hinges, respectively.
Figure 6:
Figure 6:. TERT/ATRX-alterations and their association with metastatic progression
(A) A schematic illustrating the case categories with presence or absence of TERT/ATRX mutations in primary and paired metastatic tumours. (B) A polyclonal primary harbouring ALT and pTERT mutations giving rise to metastases (i) The centre panel shows the variant allele frequency (VAF, y-axis) for all somatic mutations detected in a metastatic primary (E143-P1) and the two paired metastases (E143-M1/2) from patient E143 (x-axis). The colour of each dot denotes the genomic copy number status in the region of each variant. The horizontal lines indicate the purity of each tumour and can be read as a proportion from the x-axis. Grey lines connect mutations shared across the paired tumours while a pTERT mutation is highlighted with a red line. The top panel shows the tumour to normal telomere content ratio for each tumour and the colour of each bar indicates the presence or absence of C-circles. The panel on the right shows the genomic copy number status along each chromosome (y-axis) for each tumour (x-axis). (ii) A schematic illustration of the clonal evolution of metastatic disease in patient E143. The cell colour indicates the presence of the ALT phenotype (green) or pTERT mutation (red). (C) The tumour mutation burden (mutations per megabase, y-axis) observed in each tumour with respect to TERT/ATRX gene mutation status (x-axis). A one-tailed Student’s t-test was used. The y-axis has been truncated to accommodate an extreme outlier which was excluded during statistical testing. (D) The dimensions (centimetres, y-axis) of the largest primary tumour reported for each patient. Patients are stratified by the presence of a TERT/ATRX mutation and the presence (M) or absence (NM) of metastatic disease. The lower and upper hinges of each boxplot correspond to the first and third quartiles, respectively, and the median value is marked. The whiskers extend to the largest and smallest value no greater than 1.5 times the interquartile range above or below the upper and lower hinges, respectively. A one-tailed Student’s t-test used to test for significance.
Figure 7:
Figure 7:. Differential gene expression between TERT and ATRX-altered and non-metastatic tumours
Differential gene expression analysis was performed contrasting non-metastatic primary tumours with either (i) ATRX mutant tumours, (ii) TERT mutant tumours, or (iii) all metastasis and confirmed metastatic primaries. A fourth contrast between TERT and ATRX mutant tumours was also performed. (A) An upset plot showing the intersection of genes that were significant (adjusted p-value < 0.05, log-fold-change > 1) in each contrast. Bar colour indicates gene-ontology association for protein coding genes or gene biotype for non-protein-coding genes. (B) Differential gene-expression between non-metastatic primary and metastatic tumours showing fold change (log2, y-axis) versus adjusted p-value (−log10, x-axis). Genes that were also significant in non-metastatic primary vs TERT-altered and non-metastatic primary versus ATRX-altered contrasts are coloured according to gene ontology annotation. (C) Heatmap (centre panel) showing genes that were differentially expressed in both the ATRX vs non-metastatic primary and ATRX vs TERT contrasts. Annotation bars on the left indicate whether the gene was also found in a differentially methylated region (ATRX vs non-metastatic primary), and the correlation of the expression of MKI67 to the expression of each gene (Spearman correlation). The right panel shows the gene expression determined by snRNA-seq in cells aggregated by cell type (right sub-panel) or ATRX/TERT mutation status (left sub-panel). Dot colour indicates mean expression while dot size indicates the fraction of cells expressing the gene. (D) Expression (log2 CPM, y-axis) of genes found to be differentially expressed between ATRX-altered and non-metastatic primary tumours. Expression data is shown from the A5 cohort (top) and the TCGA/Flynn et al. cohorts (bottom). Data point colour indicates PCPG subtype. A Student’s t-test was used to test for differences (E) Differentially expressed genes in both the TERT-altered vs non-metastatic primary and ATRX-altered vs TERT-altered contrasts. See panel C description for panel elements. The lower and upper hinges of each boxplot correspond to the first and third quartiles, respectively, and the median value is marked. The whiskers extend to the largest and smallest value no greater than 1.5 times the interquartile range above or below the upper and lower hinges, respectively.
Figure 8:
Figure 8:. Evolution of PCPG under treatment pressure
(A) Clinical timeline of for patient E169. (Bi) Shared and private variants (y-axis) between paired metastases (x-axis) taken before and after CVD treatment. (Bii) Total number of variants detected by WGS (top left, bottom right) and number of variants shared between tumours (bottom left). (Biii) Shared and private structural variants between paired metastases. (Biv) Copy number status along each chromosome (y-axis) in paired metastases (x-axis). (C) Mutation signature analysis using COSMIC v3 SBS (i) and InDel (ii) signatures (y-axis) in paired metastases (x-axis). Heatmap colour indicates signature contribution. (D) Expression of MGMT in the A5 cohort. (E-G) Patient E167, see description for panels B-C. (H) Expression of MLH1 in the A5 cohort. (I) Total mutation counts (y-axis) for PCPG tumours (x-axis) in the Project GENIE data registry. Bar colour indicates the presence of a mutation in the mismatch repair pathway. (J) Trinucleotide context for mutations observed in E167-M1 (top), E167-M2 (second from top), the highest mutation load tumour from the GENIE dataset (second from bottom), and ctDNA derived from a patient with metastatic SHDB-related PGL treated with Temozolomide. (K) 18F-FDG-PET imaging for Temozolomide treated patient at time of blood draw for cfDNA analysis. (L) Ichor CNA analysis of ctDNA derived from Temozolomide treated patient (M) Variant allele frequencies (y-axis) for somatic variants (x-axis) observed in ctDNA derived from Temozolomide treated patient. Datapoints are coloured to indicate transition/transversion or insertion/deletion type.

References

    1. Nazari M.A., et al. Catecholamine-induced hypertensive crises: current insights and management. Lancet Diabetes Endocrinol 11, 942–954 (2023). - PubMed
    1. Lenders J.W., Eisenhofer G., Mannelli M. & Pacak K. Phaeochromocytoma. Lancet 366, 665–675 (2005). - PubMed
    1. Ayala-Ramirez M., et al. Clinical risk factors for malignancy and overall survival in patients with pheochromocytomas and sympathetic paragangliomas: primary tumor size and primary tumor location as prognostic indicators. J Clin Endocrinol Metab 96, 717–725 (2011). - PubMed
    1. Lenders J.W.M., et al. Genetics, diagnosis, management and future directions of research of phaeochromocytoma and paraganglioma: a position statement and consensus of the Working Group on Endocrine Hypertension of the European Society of Hypertension. Journal of hypertension 38, 1443–1456 (2020). - PMC - PubMed
    1. Amar L., et al. International consensus on initial screening and follow-up of asymptomatic SDHx mutation carriers. Nat Rev Endocrinol 17, 435–444 (2021). - PMC - PubMed

Publication types

LinkOut - more resources