. 2024 Jun 21:11:1385469.
doi: 10.3389/fvets.2024.1385469. eCollection 2024.

Behavioral comorbidities treatment by fecal microbiota transplantation in canine epilepsy: a pilot study of a novel therapeutic approach

Affiliations

Behavioral comorbidities treatment by fecal microbiota transplantation in canine epilepsy: a pilot study of a novel therapeutic approach

Antja Watanangura et al. Front Vet Sci. .

Abstract

Introduction: Anxiety and cognitive dysfunction are frequent, difficult to treat and burdensome comorbidities in human and canine epilepsy. Fecal microbiota transplantation (FMT) has been shown to modulate behavior in rodent models by altering the gastrointestinal microbiota (GIM). This study aims to investigate the beneficial effects of FMT on behavioral comorbidities in a canine translational model of epilepsy.

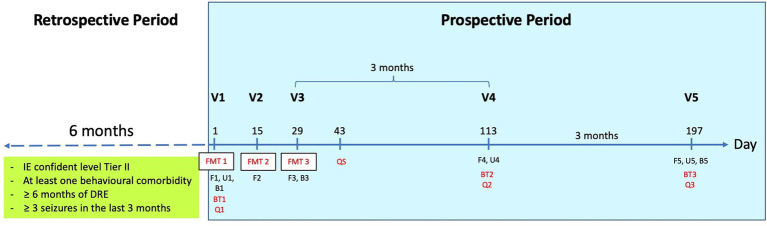
Methods: Nine dogs with drug-resistant epilepsy (DRE) and behavioral comorbidities were recruited. The fecal donor had epilepsy with unremarkable behavior, which exhibited a complete response to phenobarbital, resulting in it being seizure-free long term. FMTs were performed three times, two weeks apart, and the dogs had follow-up visits at three and six months after FMTs. Comprehensive behavioral analysis, including formerly validated questionnaires and behavioral tests for attention deficit hyperactivity disorder (ADHD)- and fear- and anxiety-like behavior, as well as cognitive dysfunction, were conducted, followed by objective computational analysis. Blood samples were taken for the analysis of antiseizure drug (ASD) concentrations, hematology, and biochemistry. Urine neurotransmitter concentrations were measured. Fecal samples were subjected to analysis using shallow DNA shotgun sequencing, real-time polymerase chain reaction (qPCR)-based Dysbiosis Index (DI) assessment, and short-chain fatty acid (SCFA) quantification.

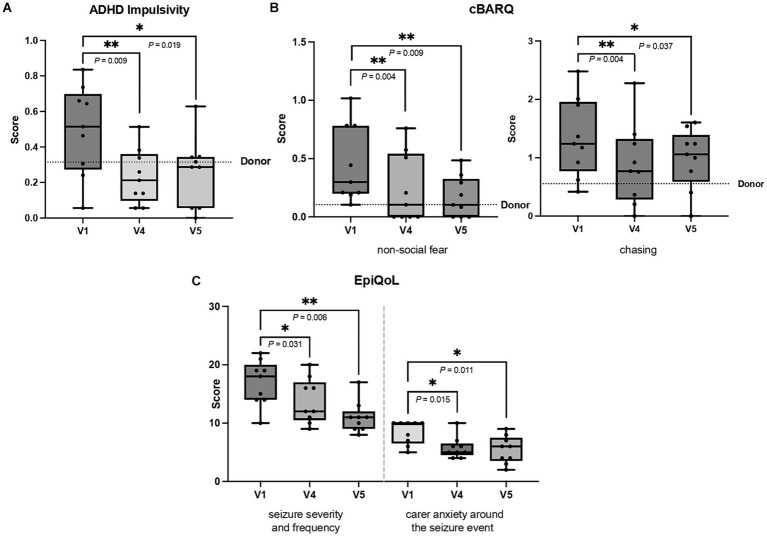
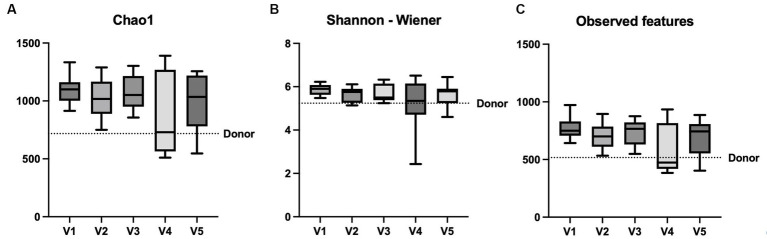
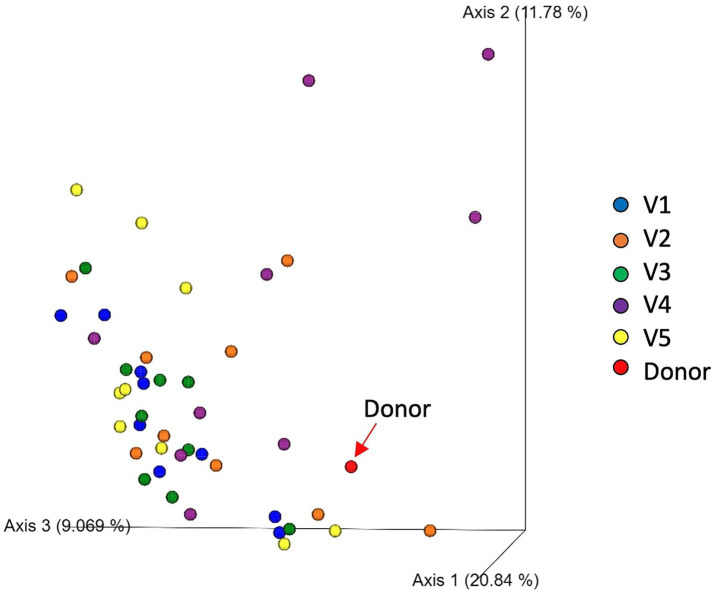
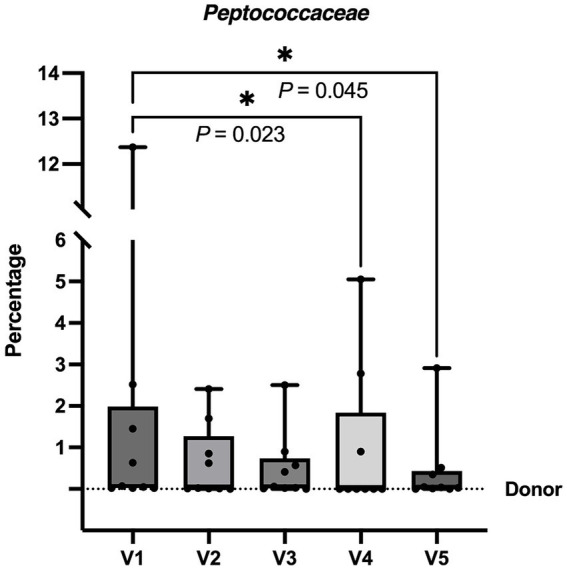
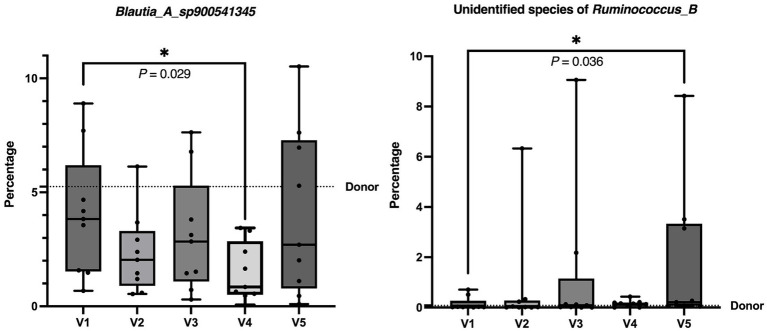
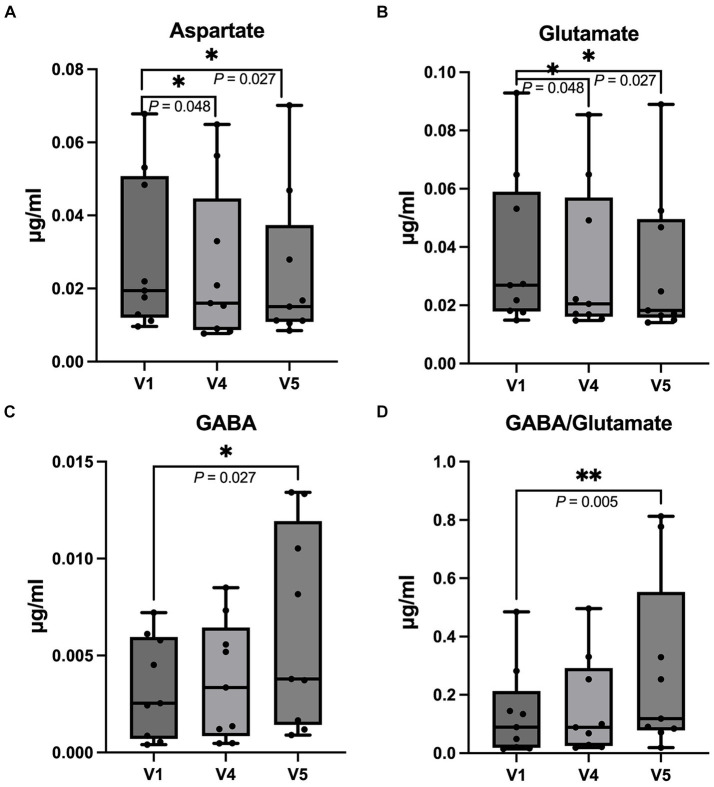
Results: Following FMT, the patients showed improvement in ADHD-like behavior, fear- and anxiety-like behavior, and quality of life. The excitatory neurotransmitters aspartate and glutamate were decreased, while the inhibitory neurotransmitter gamma-aminobutyric acid (GABA) and GABA/glutamate ratio were increased compared to baseline. Only minor taxonomic changes were observed, with a decrease in Firmicutes and a Blautia_A species, while a Ruminococcus species increased. Functional gene analysis, SCFA concentration, blood parameters, and ASD concentrations remained unchanged.

Discussion: Behavioral comorbidities in canine IE could be alleviated by FMT. This study highlights FMT's potential as a novel approach to improving behavioral comorbidities and enhancing the quality of life in canine patients with epilepsy.

Keywords: behavioral comorbidities; canine idiopathic epilepsy; fecal microbiota transplantation; gastrointestinal microbiota; microbiota-gut-brain axis.


Conflict of interest statement

HV has served as a paid consultant in the field of epilepsy for Boehringer Ingelheim, CEVA Animal Health, Nestle Purina and served as contract researcher for: Nestle Purina, Desitin Pharma and Boehringer Ingelheim. JS and RP were employees of the Gastrointestinal Laboratory at Texas A&M University which offers microbiome assessment on a fee-for-service basis. JS was the Purina PetCare Endowed Chair for Microbiome Research and receives support for microbiome research through the Purina PetCare Research Excellence Funds. JS has also received consulting or speaking fees from Nestle Purina, IDEXX Laboratories, Royal Canin and Hill’s Pet Nutrition, Inc. AF participates in academia-industry partnerships with Nestle Purina and Vetoquinol. The remaining authors declare that the research was conducted in the absence of any commercial or financial relationships that could be construed as a potential conflict of interest. The reviewer AW declared a past collaboration with the authors HV to the handling editor.

Figures

Figure 1
Figure 1
The diagram demonstrates the study plan. Baseline seizure frequency was evaluated retrospectively over a six-month period. Behavior was assessed prior to the first fecal microbiota transplant (FMT). Seizure and behavior were then monitored on a three-monthly basis. At V1, all sample collections and tests were performed before the first FMT. DRE, drug-resistant epilepsy; V, visit; FMT, fecal microbiota transplantation; F, fecal sample; U, urine sample; B, blood sample; BT, behavioral test; Q, questionnaire; QS, questionnaire for FMT effects and side effects.
Figure 2
Figure 2
(A–C) The figures show significant improvement in (A) attention deficit hyperactivity disorder (ADHD) impulsivity and (B) non-social fear and chasing behavior from canine behavioral assessment and research questionnaire (C-BARQ) and (C) seizure severity and frequency, and carer anxiety around the seizure event from quality of life questionnaire (EpiQoL). The first questionnaire at V1 prior to FMT was compared to those at V4 (three months after FMT) and V5 (six months after FMT). Results are presented as box and whisker plots, where the horizontal line in each box represents the median, the boxes represent the interquartile range and the whiskers represent the full range of data. The dots represent individual values. The donor’s score is represented by dotted line, except for EpiQoL because the donor was seizure-free (Wilcoxon signed-rank test, *p < 0.050, **p < 0.010).
Figure 3
Figure 3
Comparison of alpha diversity parameters in box and whisker plots. The graphs show the comparison between V1, V2, V3, V4, and V5 (A) Chao1, (B) Shannon-Wiener index and (C) observed features. A transverse line in each box represents the median of each visit and the boxes represent the interquartile range, while the whiskers represent the minimum and maximum of the data. The dotted line represents the donor’s value. *p < 0.05 (Friedman test).
Figure 4
Figure 4
Principal coordinates analysis (PCoA) of weighted UniFrac distances of taxa diagrams demonstrating beta diversity of fecal samples of 9 dogs from V1 (blue), V2 (orange), V3 (green), V4 (purple), V5 (yellow) and the donor (red).
Figure 5
Figure 5
The graph illustrates the percentage of Family Peptococcaceae in the fecal samples of dogs before and after FMT from V1 to V5. The percentage levels of V4 and V5 were significantly lower than V1, indicating a reduction in the abundance of this family. Each box plot displays the median as a line and the interquartile range as the box. The whiskers represent the minimum and maximum values of the data. The dotted line represents the donor’s value. * p < 0.050 (Friedman test followed by Dunn test).
Figure 6
Figure 6
The graphs demonstrate the percentage of Blautia_A_sp900541345 species and unidentified species of Ruminococcus_B in the fecal samples of dogs before and after FMT from V1 to V5. There was a decrease in Blautia_A_sp900541345 species at V4 and an increase in unidentified species of Ruminococcus_B at V5 compared to the baseline at V1. Each box plot represents the median as a line and the interquartile range as the box. The whiskers represent the minimum and maximum values of the data. The dotted line represents the donor’s value. *p < 0.050 (Friedman test followed by Dunn test).
Figure 7
Figure 7
Box and whisker plots demonstrate a comparison of the urinal neurotransmitter concentration at the first appointment before FMT (V1) with the fourth (V4, three months after FMT) and fifth follow-up time point (V5, six months after FMT). (A) Aspartate; there was a decrease in aspartate concentration at V4 and V5 (B) Glutamate; the glutamate concentration was decreased at V4 and V5 compared to V1. (C) GABA; the GABA concentration at V5 was increased compared to V1. (D) the GABA/glutamate ratio; the graph shows an increase in the GABA/glutamate ratio at V5 compared to V1. The horizontal line in each box represents median, while the boxes represent the interquartile range. The whiskers represent the full range of data and the dots represent individual values (Wilcoxon signed-rank test, *p < 0.050, **p < 0.010).

Similar articles

Cited by

References

    1. Löscher W. Dogs as a natural animal model of epilepsy. Front Vet Sci. (2022) 9:928009. doi: 10.3389/fvets.2022.928009, PMID: - DOI - PMC - PubMed
    1. Packer RMA, Hobbs SL, Blackwell EJ. Behavioral interventions as an adjunctive treatment for canine epilepsy: a missing part of the epilepsy management toolkit? Front Vet Sci. (2019) 6:3. doi: 10.3389/fvets.2019.00003, PMID: - DOI - PMC - PubMed
    1. Watson F, Packer RMA, Rusbridge C, Volk HA. Behavioural changes in dogs with idiopathic epilepsy. Vet Rec. (2020) 186:93. doi: 10.1136/vr.105222, PMID: - DOI - PubMed
    1. Wessmann A, Volk HA, Parkin T, Ortega M, Anderson TJ. Evaluation of quality of life in dogs with idiopathic epilepsy. J Vet Intern Med. (2014) 28:510–4. doi: 10.1111/jvim.12328, PMID: - DOI - PMC - PubMed
    1. Rocamora R, Chavarria B, Perez E, Perez-Enriquez C, Barguilla A, Panades-de Oliveira L, et al. . Mood disturbances, anxiety, and impact on quality of life in patients admitted to epilepsy monitoring units. Front Neurol. (2021) 12:761239. doi: 10.3389/fneur.2021.761239, PMID: - DOI - PMC - PubMed

LinkOut - more resources