[Preprint]. 2025 Mar 28:2024.06.26.24309530.
doi: 10.1101/2024.06.26.24309530.

A proteomic signature of healthspan

Affiliations

A proteomic signature of healthspan

Chia-Ling Kuo et al. medRxiv. .

Update in

  • A proteomic signature of healthspan.
    Kuo CL, Liu P, Drouard G, Vuoksimaa E, Kaprio J, Ollikainen M, Chen Z, Pilling LC, Atkins JL, Fortinsky RH, Kuchel GA, Diniz BS. Kuo CL, et al. Proc Natl Acad Sci U S A. 2025 Jun 10;122(23):e2414086122. doi: 10.1073/pnas.2414086122. Epub 2025 Jun 6. Proc Natl Acad Sci U S A. 2025. PMID: 40478878

Abstract

The focus of aging research has shifted from increasing lifespan to enhancing healthspan to reduce the time spent living with disability. Despite significant efforts to develop biomarkers of aging, few studies have focused on biomarkers of healthspan. We developed a proteomics-based signature of healthspan (healthspan proteomic score (HPS)) using proteomic data from the Olink Explore 3072 assay in the UK Biobank Pharma Proteomics Project (53,018 individuals and 2920 proteins). A lower HPS was associated with higher mortality risk and several age-related conditions, such as COPD, diabetes, heart failure, cancer, myocardial infarction, dementia, and stroke. HPS showed superior predictive accuracy for these outcomes compared to other biological age measures. Proteins associated with HPS were enriched in hallmark pathways such as immune response, inflammation, cellular signaling, and metabolic regulation. The external validity was evaluated using the Essential Hypertension Epigenetics study with proteomic data also from the Olink Explore 3072 and complementary epigenetic data, making it a valuable tool for assessing healthspan and as a potential surrogate marker to complement existing proteomic and epigenetic biological age measures in geroscience-guided studies.


Conflict of interest statement

Conflict of Interest Statement We have no conflicting interests to disclose.

Figures
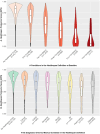
Figure 1
Figure 1
[UKB] Healthspan Proteomic Score (HPS) distributions in UKB PPP participants (n=53,018), separated by the number of conditions in the healthspan definition at baseline (Figure 1A), and within those with a specific condition only at baseline (Figure 1B).
Figure 2
Figure 2
[UKB] Kaplan-Meier survival curves of the low (≤0.73) and high (>0.73) HPS groups for a first condition and individual conditions in the healthspan definition (n=12,935)
Figure 3
Figure 3
[UKB] Predictive power of healthspan proteomic score (HPS) versus proteomic aging clock (PAC), proteomic age (ProtAge), PhenoAge, and BioAge, assessed by C-statistics for time to a first condition and individual conditions in the healthspan definition (test sample, n=12,935).
Figure 4
Figure 4
[UKB] Predictive power of healthspan proteomic score (HPS) and proteomic aging clock (PAC) versus organ-specific proteomic clocks trained to predict chronological age (a) or mortality (b), with top five C-statistics presented per condition
Figure 5
Figure 5
[UKB] HPS-associated proteins and enriched hallmark gene sets (test sample, n=12,935). A. Each point represents a protein, with the x-axis indicating the mean standard deviation (SD) difference in expression after inverse normal transformation (beta value) between the low and high HPS groups and the y-axis representing the statistical significance (−log10 adjusted p-value for multiple testing using Bonferroni correction). Blue points indicate significantly downregulated proteins in the low HPS group (beta < −0.4 and adjusted p-value < 0.05). Red points indicate significantly upregulated proteins in the low HPS group (beta > 0.4 and adjusted p-value < 0.05). Black points indicate proteins that are not significantly differentially expressed. B. The x-axis represents the significant gene sets, ordered by adjusted p-values for multiple testing, and the y-axis shows the −log10 of the adjusted p-value for each significant gene set (Bonferroni-corrected p-value <0.05).
Figure 6
Figure 6
[EH-Epi] Kaplan-Meier survival curves of the low and high HPS groups for mortality (external validation sample, n=399)

References

    1. GHE: Life expectancy and healthy life expectancy. Available at: https://www.who.int/data/gho/data/themes/mortality-and-global-health-est... [Accessed 21 May 2024].
    1. Garmany A., Yamada S., Terzic A., Longevity leap: mind the healthspan gap. NPJ Regen Med 6, 57 (2021). - PMC - PubMed
    1. Khan M., et al. , Global Healthspan Summit 2023: closing the gap between healthspan and lifespan. Nat Aging 4, 445–448 (2024). - PubMed
    1. Kennedy B. K., et al. , Geroscience: linking aging to chronic disease. Cell 159, 709–713 (2014). - PMC - PubMed
    1. Fuellen G., et al. , Health and Aging: Unifying Concepts, Scores, Biomarkers and Pathways. Aging Dis 10, 883–900 (2019). - PMC - PubMed

Publication types

LinkOut - more resources