[Preprint]. 2024 Oct 9:2024.06.26.24309550.
doi: 10.1101/2024.06.26.24309550.

Complement 3a Receptor 1 on Macrophages and Kupffer cells is not required for the Pathogenesis of Metabolic Dysfunction-Associated Steatotic Liver Disease

Affiliations

Complement 3a Receptor 1 on Macrophages and Kupffer cells is not required for the Pathogenesis of Metabolic Dysfunction-Associated Steatotic Liver Disease

Edwin A Homan et al. medRxiv. .

Update in

Abstract

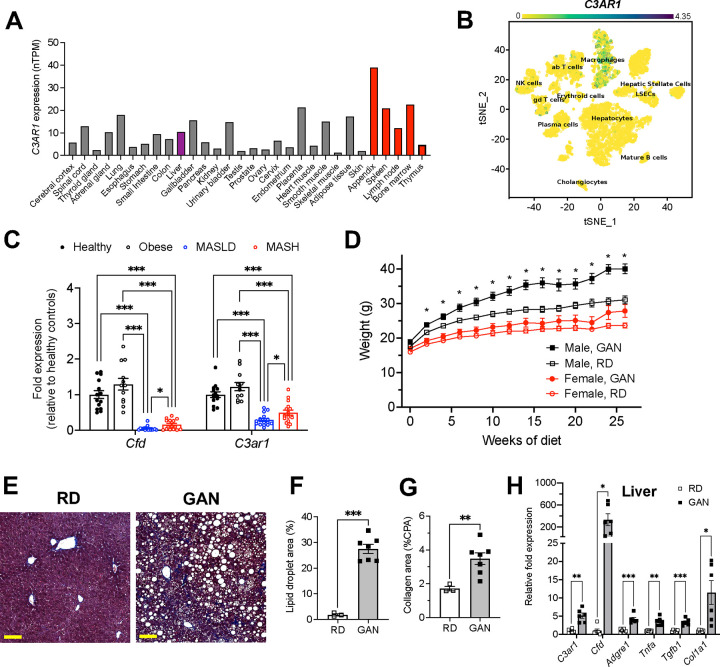
Together with obesity and type 2 diabetes, metabolic dysfunction-associated steatotic liver disease (MASLD) is a growing global epidemic. Activation of the complement system and infiltration of macrophages has been linked to progression of metabolic liver disease. The role of complement receptors in macrophage activation and recruitment in MASLD remains poorly understood. In human and mouse, C3AR1 in the liver is expressed primarily in Kupffer cells, but is downregulated in humans with MASLD compared to obese controls. To test the role of complement 3a receptor (C3aR1) on macrophages and liver resident macrophages in MASLD, we generated mice deficient in C3aR1 on all macrophages (C3aR1-MφKO) or specifically in liver Kupffer cells (C3aR1-KpKO) and subjected them to a model of metabolic steatotic liver disease. We show that macrophages account for the vast majority of C3ar1 expression in the liver. Overall, C3aR1-MφKO and C3aR1-KpKO mice have similar body weight gain without significant alterations in glucose homeostasis, hepatic steatosis and fibrosis, compared to controls on a MASLD-inducing diet. This study demonstrates that C3aR1 deletion in macrophages or Kupffer cells, the predominant liver cell type expressing C3aR1, has no significant effect on liver steatosis, inflammation or fibrosis in a dietary MASLD model.

Keywords: C3aR1; Kupffer cell; hepatic steatosis; macrophage; obesity; steatohepatitis.


Conflict of interest statement

Declaration of Competing Interest None

Figures

Figure 1.
Figure 1.. C3AR1 is found in macrophages, is modulated by MASLD/MASH in humans, and is induced by a murine dietary model of MASH.
A) Relative C3AR1 human tissue expression level by tissue, derived from deep sequencing of the mRNA combined dataset (HPA and GTEx) in the Human Protein Atlas, shown as normalized transcripts per million (nTPM). Liver is highlighted in purple and immunologic tissues are highlighted in red. B) Single-cell RNA sequencing distribution of C3AR1 expression in human liver (tSNE, t-distributed Stochastic Neighbor Embedding). C) Analysis of CFD and C3AR1 expression from liver biopsy samples in patients with MASH, MASLD, obesity without MASLD, and age-matched healthy controls (n = 12–16 per group, Welch t test with Holm-Šídák correction for multiple comparisons). D) Weight curve in male and female flox/flox control mice placed on GAN high-fat diet compared to regular diet (RD) controls (males, n = 7; females, n = 6). E) Representative liver section staining by Masson’s Trichrome in male control mice on RD or GAN diet for 28 weeks (scale bar = 100 μm). F) Lipid droplet area quantification in liver sections from male control mice, excluding vessel lumens (RD, n = 3; GAN, n = 7). G) Collagen area quantification in liver sections of male control mice (RD, n = 3; GAN, n = 7). H) Gene expression of key macrophage or fibrosis genes in male control mice on GAN or RD (n = 6 per group). Unpaired two-tailed Student’s t test (Except 1C as above). Annotations: *, p < 0.05; **, p < 0.01; ***, p < 0.001.
Figure 2.
Figure 2.. C3aR1 deletion in all macrophages does not affect weight gain, glucose homeostasis, liver steatosis or fibrosis.
A) Expression of C3ar1 in isolated peritoneal F4/80+/CD68+ cells from control mice (n = 6) or C3aR1-MφKO male mice (n = 3). B) Expression of C3ar1 in whole liver from control or C3aR1-MφKO mice (n = 11–12 per male group, n = 13–14 per female group). C) Body mass curve of control or C3aR1-MφKO mice on GAN high-fat diet starting at 5 weeks of age (n = 11–12 per male group, n = 14 per female group). D) Body composition analysis by EchoMRI in control or C3aR1-MφKO mice after 30 weeks GAN diet (n = 6–9 per male group, n = 9–13 per female group). E) Glucose tolerance test in control or C3aR1-MφKO mice with 14h fast after 28 weeks GAN diet (n = 6–9 per male group, n = 9–14 per female group). F) Liver mass in control or C3ar1-MφKO male mice at time of euthanasia after 30 weeks GAN diet (n = 6–9 per male group, n = 9–14 per female group). G) Representative liver section staining by Masson’s Trichrome in male control or C3ar1-MφKO mice (scale bar = 100 μm). H) Lipid droplet area in liver sections from male control or C3ar1-MφKO mice, excluding vessel lumens (n = 6–7 per group). I) Collagen area in liver sections from male control or C3ar1-MφKO mice (n = 6–7 per group). J,K) Relative mRNA expression of key markers for inflammation, fibrosis, and liver metabolism in liver from male control or C3ar1-MφKO mice after 30 weeks of either GAN (J) diet (n = 11–12 per group) or regular (K) diet (n = 3–5 per group). Unpaired two-tailed Student’s t test: Student’s t test: *, p < 0.05.
Figure 3.
Figure 3.. C3aR1 deletion in Kupffer cells does not affect weight gain, glucose homeostasis, liver steatosis or fibrosis.
A) Body mass on GAN diet in flox/flox control or C3aR1-KpKO mice beginning at 5 weeks of age (n = 8–10 per group). B) Body composition analysis by EchoMRI in control or C3aR1-KpKO mice after 28 weeks GAN diet (n = 8–10). C) Glucose tolerance test in control or C3aR1-KpKO mice with 14h fast after 26 weeks GAN diet (n = 8–10). D) Liver mass in control or C3aR1-KpKO male mice at time of euthanasia after 28 weeks GAN diet (n = 8–10). E) Representative liver section staining by Masson’s Trichrome in control or C3aR1-KpKO male mice (scale bar = 100 μm). F) Lipid droplet area quantified on liver sections of control or C3aR1-KpKO male mice, excluding vessel lumens (n = 8–9). G) Collagen area quantified on whole liver section of control or C3aR1-KpKO male mice (n= 8–9). H) Relative gene expression in control or C3aR1-KpKO male mice after 30 weeks GAN diet (n = 5–6). Unpaired two-tailed Student’s t test: **, p < 0.01.

References

    1. Ge X., Zheng L., Wang M., Du Y. & Jiang J. Prevalence trends in non-alcoholic fatty liver disease at the global, regional and national levels, 1990–2017: a population-based observational study. BMJ Open 10, e036663 (2020). 10.1136/bmjopen-2019-036663 - DOI - PMC - PubMed
    1. Younossi Z. et al. Global burden of NAFLD and NASH: trends, predictions, risk factors and prevention. Nat Rev Gastroenterol Hepatol 15, 11–20 (2018). 10.1038/nrgastro.2017.109 - DOI - PubMed
    1. Ferguson D. & Finck B. N. Emerging therapeutic approaches for the treatment of NAFLD and type 2 diabetes mellitus. Nat Rev Endocrinol 17, 484–495 (2021). 10.1038/s41574-021-00507-z - DOI - PMC - PubMed
    1. Friedman S. L., Neuschwander-Tetri B. A., Rinella M. & Sanyal A. J. Mechanisms of NAFLD development and therapeutic strategies. Nat Med 24, 908–922 (2018). 10.1038/s41591-018-0104-9 - DOI - PMC - PubMed
    1. Stefan N., Haring H. U. & Cusi K. Non-alcoholic fatty liver disease: causes, diagnosis, cardiometabolic consequences, and treatment strategies. Lancet Diabetes Endocrinol 7, 313–324 (2019). 10.1016/S2213-8587(18)30154-2 - DOI - PubMed

Publication types

LinkOut - more resources