

Differential distribution of plasma apoA-I and apoB levels and clinical significance of apoB/apoA-I ratio in ischemic stroke subtypes
- PMID: 38978811
- PMCID: PMC11228298
- DOI: 10.3389/fneur.2024.1398830
Differential distribution of plasma apoA-I and apoB levels and clinical significance of apoB/apoA-I ratio in ischemic stroke subtypes
Abstract
Background and purpose: Ischemic stroke (IS) is classified into clinical subtypes and likely influenced by various lipid components. Nevertheless, the roles of apolipoprotein A-I (apoA-I), apolipoprotein B (apoB), and apoB/apoA-I ratio in different IS subtypes remain underexplored. This study aimed to investigate the differential distribution of plasma apoA-I and apoB levels among IS subtypes and to evaluate the predictive value of the apoB/apoA-I ratio in assessing IS subtypes and disease severity.
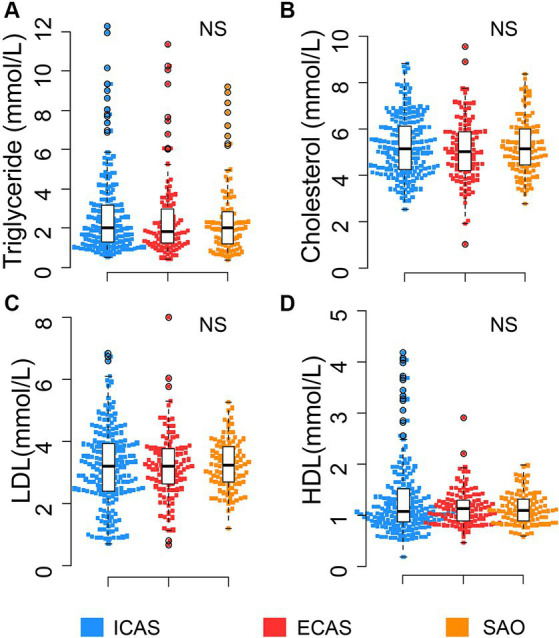
Methods: In this study, 406 IS patients were categorized into three IS-subtypes based on clinical manifestations and imaging assessment, including intracranial atherosclerosis-related IS patients (ICAS, n = 193), extracranial atherosclerosis-related IS patients (ECAS, n = 111), and small artery occlusion-related IS patients (SAO, n = 102). Plasma apoA-I and apoB levels were measured upon hospital admission. Random forest (RF) models were performed to assess predictive values of these apolipoproteins apoB, apoA-I and their ratio in assessing IS subtype stratification and disease severity.
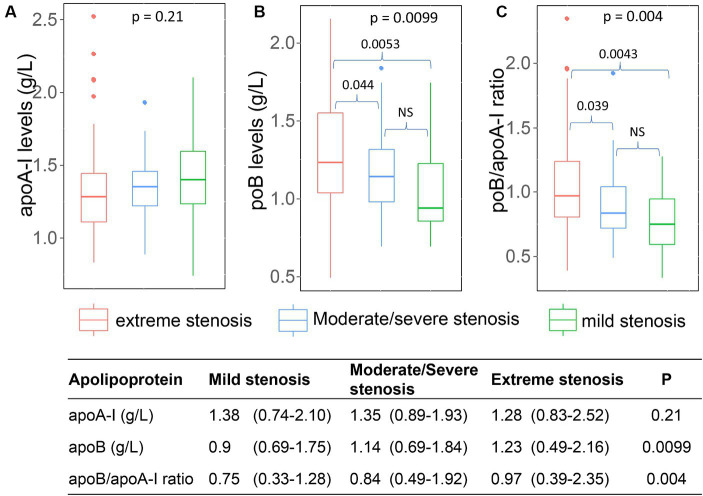
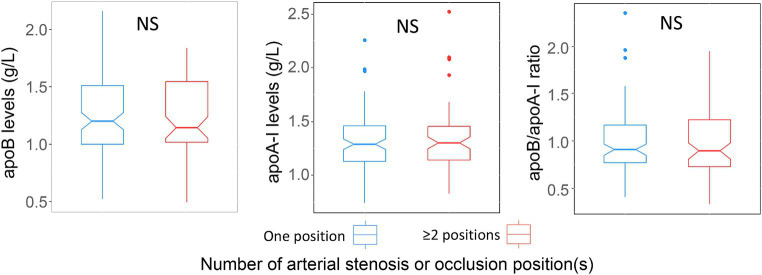
Results: Serum apoA-I levels were significantly lower in ICAS compared to ECAS and SAO patients (p < 0.0001), while apoB levels were higher in ICAS patients (p < 0.0001). The apoB/apoA-I ratio was significantly higher in ICAS compared to ECAS and SAO patients (p < 0.0001). Correlation analyses found a significant correlation between the apoB/apoA-I ratio and conventional lipid components. Additionally, RF models and plots of variable importance and distribution of minimal depth revealed that the apoB/apoA-I ratio played the most influential predictor in predicting IS subtypes and stenosis severity.
Conclusion: Our study shows the differential distribution of apoA-I and apoB IS subtypes and reveals the significance of the apoB/apoA-I ratio in assessing IS subtypes and arterial stenosis severity. Further studies are warranted to validate these findings and enhance their clinical applicability.
Keywords: apoA-I; apoB; apoB/apoA-I ratio; extracranial atherosclerosis; intracranial atherosclerosis; ischemic stroke; small artery occlusion.
Copyright © 2024 Van Tuyen, Hoang Ngoc, Quoc Hoan, Thi Yen, Hoan and Cam Thach.
Conflict of interest statement
The authors declare that the research was conducted in the absence of any commercial or financial relationships that could be construed as a potential conflict of interest.
Figures


Similar articles
-
Association of ApoB/apoA1 ratio with stenosis of intracranial and extracranial arteries in patients with ischaemic stroke.Sci Rep. 2025 Apr 19;15(1):13622. doi: 10.1038/s41598-025-97625-9. Sci Rep. 2025. PMID: 40253439 Free PMC article.
-
Differential association between apolipoprotein B and LDL cholesterol and cerebral atherosclerosis according to pre-stroke statin use.Atherosclerosis. 2023 Apr;371:14-20. doi: 10.1016/j.atherosclerosis.2023.03.014. Epub 2023 Mar 20. Atherosclerosis. 2023. PMID: 36966561
-
High ApoB/ApoA-I Ratio Predicts Post-Stroke Cognitive Impairment in Acute Ischemic Stroke Patients with Large Artery Atherosclerosis.Nutrients. 2023 Nov 4;15(21):4670. doi: 10.3390/nu15214670. Nutrients. 2023. PMID: 37960323 Free PMC article.
-
High levels of apolipoprotein B/AI ratio are associated with intracranial atherosclerotic stenosis.Stroke. 2011 Nov;42(11):3040-6. doi: 10.1161/STROKEAHA.111.620104. Epub 2011 Aug 25. Stroke. 2011. PMID: 21868729
-
The apoB/apoA-I ratio: a strong, new risk factor for cardiovascular disease and a target for lipid-lowering therapy--a review of the evidence.J Intern Med. 2006 May;259(5):493-519. doi: 10.1111/j.1365-2796.2006.01643.x. J Intern Med. 2006. PMID: 16629855 Review.
Cited by
-
Correlation of sdLDL-C and Apob with the degree of cerebral artery stenosis in posterior circulation stroke.Sci Rep. 2025 Mar 11;15(1):8343. doi: 10.1038/s41598-025-93074-6. Sci Rep. 2025. PMID: 40069330 Free PMC article.
References
LinkOut - more resources
Full Text Sources
Miscellaneous