[Preprint]. 2024 Jun 30:2024.06.26.600812.
doi: 10.1101/2024.06.26.600812.

Dopamine transmission at D1 and D2 receptors in the nucleus accumbens contributes to the expression of incubation of cocaine craving

Affiliations

Dopamine transmission at D1 and D2 receptors in the nucleus accumbens contributes to the expression of incubation of cocaine craving

Sophia J Weber et al. bioRxiv. .

Update in

Abstract

Relapse represents a consistent clinical problem for individuals with substance use disorder. In the incubation of craving model of persistent craving and relapse, cue-induced drug seeking progressively intensifies or 'incubates' during the first weeks of abstinence from drug self-administration and then remains high for months. Previously, we and others have demonstrated that expression of incubated cocaine craving requires strengthening of excitatory synaptic transmission in the nucleus accumbens core (NAcc). However, despite the importance of dopaminergic signaling in the NAcc for motivated behavior, little is known about the role that dopamine (DA) plays in the incubation of cocaine craving. Here we used fiber photometry to measure DA transients in the NAcc of male and female rats during cue-induced seeking tests conducted in early abstinence from cocaine self-administration, prior to incubation, and late abstinence, after incubation of craving has plateaued. We observed DA transients time-locked to cue-induced responding but their magnitude did not differ significantly when measured during early versus late abstinence seeking tests. Next, we tested for a functional role of these DA transients by injecting DA receptor antagonists into the NAcc just before the cue-induced seeking test. Blockade of either D1 or D2 DA receptors reduced cue-induced cocaine seeking after but not before incubation. We found no main effect of sex in our experiments. These results suggest that DA contributes to incubated cocaine seeking but the emergence of this role reflects changes in postsynaptic responsiveness to DA rather than presynaptic alterations.


Conflict of interest statement

COMPETING INTERESTS Dr. Wolf and OHSU have a financial interest in Eleutheria Pharmaceuticals LLC, a company that may have a commercial interest in results related to the research described herein. This potential conflict of interest has been reviewed and managed by OHSU. Dr. Wolf also serves as a Consultant for the University of Texas-Austin and has received compensation. The other authors declare no competing interests.

Figures

Figure 1.
Figure 1.
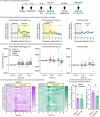
Behavior and virus expression in rats destined for fiber photometry. A. Timeline for photometry experiment (green denotes stages shown in this figure). B. Top: AAV9-hSyn-GRAB_DA2m expression in NAcc quantified (mean ± SEM) over time in three groups: no virus control group (n = 2 hemispheres), 500nL of virus assessed after 3 weeks of expression (n = 3 rats/6 hemispheres), and 500nL of virus after 10 weeks of expression (n = 3 rats/6 hemispheres). Dots show values for individual hemispheres. Bottom: Representative image after 3 weeks of expression at two different magnifications. C. Fiber optic cannula placement for photometry rats. The dot signifies the end of the cannula (females, pink; males, blue). Placement was determined after immunohistochemistry for GFP to confirm virus expression at the end of the cannula. Sections adapted from Paxinos & Watson 7th edition. D. Cocaine self-administration and cue-induced seeking data. Left: Rats expressing either GRAB_DA2m (n = 17) or GRAB_DAmut (n = 6) learned to nose poke into the active port for an infusion of cocaine and discriminated between the drug-associated (active) port and the inactive port (*p<0.05; Table S2). Middle: Cocaine infusions for sensor and mutant expressing rats during 10 days of self-administration training. Mean (±SEM) for each 6-h session is shown. Right: Cue-induced seeking tests on FAD1-2 and FAD40-50 for sensor and mutant expressing rats. Bars show mean (±SEM) for each 30-min seeking test while dots indicate individual rats (open circles, males; closed circles, females). * indicates significant main effect of test day but not virus for active pokes on FAD40-50 versus FAD1-2 (Table S2). AP, anterior posterior; FAD, forced abstinence day.
Figure 2.
Figure 2.
Fiber photometry recordings during cue-induced seeking tests. A. Timeline for photometry experiment (green denotes stages shown in this figure). B. DA traces time-locked to behavioral events (n = 17 rats). Left: z-scored mean DA response normalized to a baseline period (−2 to 0 s) for active pokes that triggered the cue on FAD1-2 and FAD40-50. SEM is shown in shaded area around the mean. The matching-colored lines above the traces show periods in the 6-sec window during which bootstrapping indicates 95% confidence that the mean is not equal to zero. Middle: z-scored DA response for active pokes during cue light on/time-out period on FAD1-2 and FAD40-50. Right: z-scored DA response for inactive pokes on FAD1-2 and FAD40-50. C. Area under the curve for traces shown in (B). Traces are split into time epochs of baseline (−2 to 0 s), initial peak (0 to 1 s) and secondary peak (1 to 4 s). Bars show mean (±SEM) for each time period around the behavioral event while dots indicate individual rats. D. Heat maps showing the average DA trace for each rat that contributed to (B). Left: DA responses to active pokes that trigger the cue for individual rats on FAD1-2. Right: Individual responses on FAD40-50. Darker colors represent higher z-score. E. Analysis of DA events not time-locked to a behavioral event. Data obtained using the mutant sensor GRAB_DA2mut were used to define a threshold for DA transient identification such that 0 peaks were detected in the mutant trace; this threshold was applied to the entire 30 min recording for each seeking test for all rats (n = 17). Left: Frequency (average number of events per minute) on FAD1-2 and FAD40-50. Right: Average amplitude of all events above threshold in the 30 min recording for FAD1-2 and FAD40-50. Bars show mean (±SEM) for each 30-min seeking test while dots indicate individual rats (open circles, males; closed circles, females). *p<0.05 FAD1-2 versus FAD40-50 (Table S4). AUC, area under the curve; FAD, forced abstinence day.
Figure 3.
Figure 3.
Analysis of behavior and DA responses during specific periods of cue-induced seeking tests. A. Timeline for photometry experiment (green denotes stages shown in this figure). B. Mean (±SEM) active port responses for seeking test data separated into 10-min bins (n = 17 rats in this and all subsequent panels). C. Mean DA trace (±SEM) time-locked to active pokes that triggered the cue, split into 10-min bins, on FAD1-2 (Left) and FAD40-50 (Right). Separate bins are shown as different colored lines. D. Mean DA trace (±SEM) time-locked to the first poke that triggered a cue in each 10-min bin shown in (C). Separate bins are shown as different colored lines. E. Mean DA trace (±SEM) time-locked to the first poke that triggered a cue in each 30-min session for FAD1-2 and FAD40-50. FAD, forced abstinence day.
Figure 4.
Figure 4.
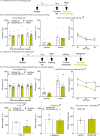
Intra-NAcc infusion of the D1R antagonist SCH39166 reduces cue-induced seeking on FAD40-50 but not FAD1. A. Timeline for FAD1 D1R antagonist experiment (yellow denotes stages that are the focus panel B). B. Behavioral data for FAD1 D1R antagonist experiment. Left: Groups destined for vehicle or SCH39166 infusion on FAD1 were balanced based on mean (±SEM) cocaine infusions for the last three 6-h sessions of self-administration training. Middle: Bars show mean (±SEM) active and inactive pokes during the 1-h FAD1 cue-induced seeking test for rats receiving intra-NAcc vehicle (n = 7) or SCH39166 (n = 7). Dots indicate individual rats (open circles, males; closed circles, females). Right: Mean (±SEM) active pokes for FAD1 seeking test data split into three 20-min bins. C. Timeline for FAD40-50 D1R antagonist experiment (yellow denotes stages that are the focus of panel D). D. Behavioral data for FAD40-50 D1R antagonist experiment. Left: Groups destined for vehicle or SCH39166 infusion on FAD40-50 were balanced based on mean (±SEM) cocaine infusions for the last three 6-h sessions of self-administration training (shown here) as well as FAD1 seeking data (Fig. S4A). Middle: Mean (±SEM) pokes during the 1-h FAD40-50 cue-induced seeking test for rats receiving intra-NAcc vehicle (n = 15) or SCH39166 (n = 13) (*p<0.05 vs vehicle; Table S7). Right: Mean (±SEM) active pokes for FAD40-50 seeking test data split into three 20-min bins. Incubated cue-induced seeking was suppressed in the SCH39166 group (***p<0.001 main effect of treatment, SCH39166 vs vehicle; Table S7). E. Operant box photobeam breaks during seeking tests and a separate open field experiment conducted in drug-naïve rats. Left: Mean (±SEM) beam breaks during the FAD1 seeking test shown in (B) (n = 7 rats/group). Middle: Mean (±SEM) beam breaks during the FAD40-50 seeking test shown in (D) (n = 14 for vehicle, n = 12 for SCH39166; two operant boxes lacked functional photobeams). Right: Mean (±SEM) total distance traveled in meters (m) during a 1-h open field test conducted after intra-NAcc injection of vehicle or SCH39166 in drug-naïve rats (n = 6 total; 3 rats received both vehicle and SCH39166 in a counter-balanced design with one day between tests, 2 rats received only vehicle, and 1 rat received only SCH39166). SCH39166 significantly reduced beam breaks given prior to the FAD1 test (*p<0.05 vs vehicle), but not when given before the FAD40-50 test and had no effect on open field locomotion (Table S7). Dots show data for individual rats. FAD, forced abstinence day.
Figure 5.
Figure 5.
Intra-NAcc infusion of the D2R antagonist L-741,626 reduces cue-induced seeking on FAD40-50 but not FAD1. A. Timeline for FAD1 D2R antagonist experiment (teal denotes stages that are the focus of panel B). B. Behavioral data for FAD1 D2R antagonist experiment. Left: Groups destined for vehicle or L-741,626 infusion on FAD1 were balanced based on mean (±SEM) cocaine infusions for the last three 6-h sessions of self-administration training. Middle: Mean (±SEM) pokes for the 1-h FAD1 cue-induced seeking test for rats receiving intra-NAcc vehicle (n = 7) or L-741,626 (n = 6). Dots indicate individual rats (open circles, males; closed circles, females). Right: Mean (±SEM) active pokes for FAD1 seeking test data split into three 20-min bins. C. Timeline for FAD40-50 D2R antagonist experiment (teal denotes stages that are the focus of panel D). D. Behavioral data for FAD40-50 D2R antagonist experiment. Left: Groups destined for vehicle or L-741,626 infusion on FAD40-50 were balanced based on mean (±SEM) cocaine infusions for the last three 6-h sessions of self-administration training (shown here) as well as FAD1 seeking data (Fig. S6A). Middle: Mean (±SEM) pokes for the 1-h FAD40-50 cue-induced seeking test for rats receiving intra-NAcc vehicle (n = 11) or L-741,626 (n = 12) (*p<0.05 vs vehicle; Table S9). Right: Mean (±SEM) active pokes for FAD40-50 seeking test data split into three 20-min bins (*p<0.05 main effect of treatment, L-741,626 versus vehicle; Table S9). E. Operant box photobeam breaks during seeking tests and a separate open field experiment conducted in drug- naïve rats. Left: Mean (±SEM) beam breaks during the FAD1 seeking test shown in (B) (n = 7 for vehicle, n = 6 for L-741,626). Middle: Mean (±SEM) beam breaks during the FAD40-50 seeking test shown in (D) (n = 10 vehicle, n = 12 L-741,626; two operant boxes lacked functional photobeams). Right: Mean (±SEM) total distance traveled in meters (m) during a 1-h open field test conducted after intra-NAcc injection of vehicle or L-741,626 in drug-naïve rats (n = 5 total, all rats received both vehicle and L-741,626 in a counter-balanced design with one day between tests). FAD, forced abstinence day.

References

    1. Neisewander JL, Baker DA, Fuchs RA, Tran-Nguyen LT, Palmer A, Marshall JF. Fos protein expression and cocaine-seeking behavior in rats after exposure to a cocaine self-administration environment. J Neurosci. 2000;20(2):798–805. - PMC - PubMed
    1. Grimm JW, Hope BT, Wise RA, Shaham Y. Incubation of cocaine craving after withdrawal. Nature. 2001;412(6843):141–42. - PMC - PubMed
    1. Lu L, Grimm JW, Hope BT, Shaham Y. Incubation of cocaine craving after withdrawal: a review of preclinical data. Neuropharmacology. 2004;47:214–26. - PubMed
    1. Altshuler RD, Lin H, Li X. Neural mechanisms underlying incubation of methamphetamine craving: A mini-review. Pharmacol Biochem Behav. 2020;199:173058. - PMC - PubMed
    1. Reiner DJ, Fredriksson I, Lofaro OM, Bossert JM, Shaham Y. Relapse to opioid seeking in rat models: behavior, pharmacology and circuits. Neuropsychopharmacology. 2019;44(3):465–77. - PMC - PubMed

Publication types

LinkOut - more resources