[Preprint]. 2024 Jul 3:2024.06.20.599846.
doi: 10.1101/2024.06.20.599846.

MICOS Complex Loss Governs Age-Associated Murine Mitochondrial Architecture and Metabolism in the Liver, While Sam50 Dictates Diet Changes

Affiliations

MICOS Complex Loss Governs Age-Associated Murine Mitochondrial Architecture and Metabolism in the Liver, While Sam50 Dictates Diet Changes

Zer Vue et al. bioRxiv. .

Abstract

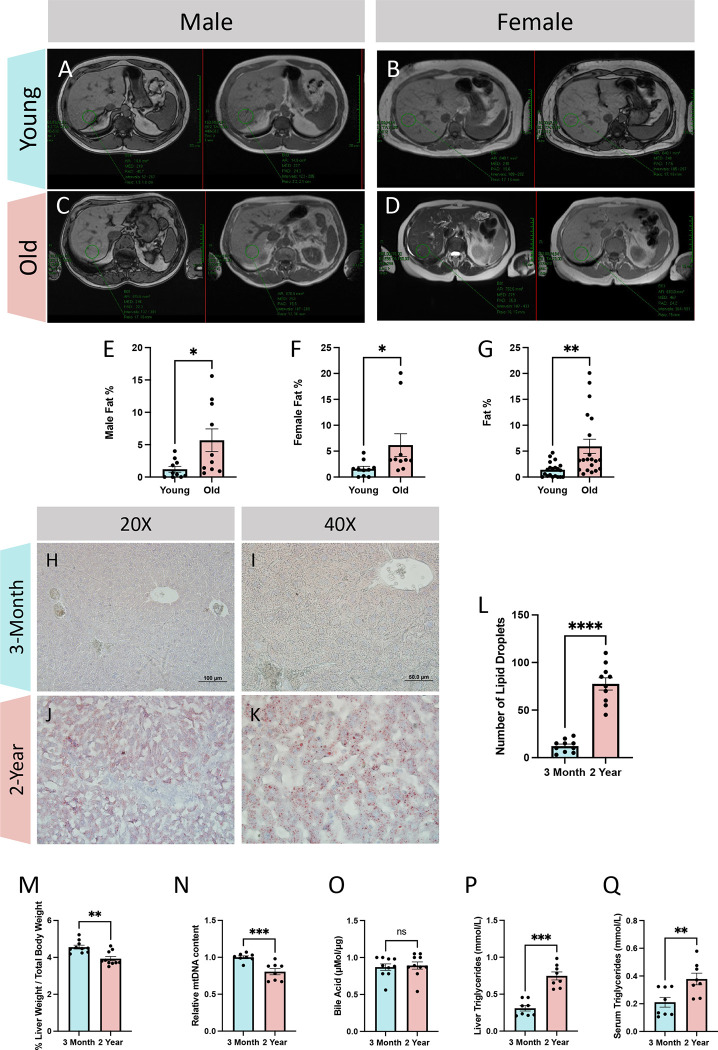
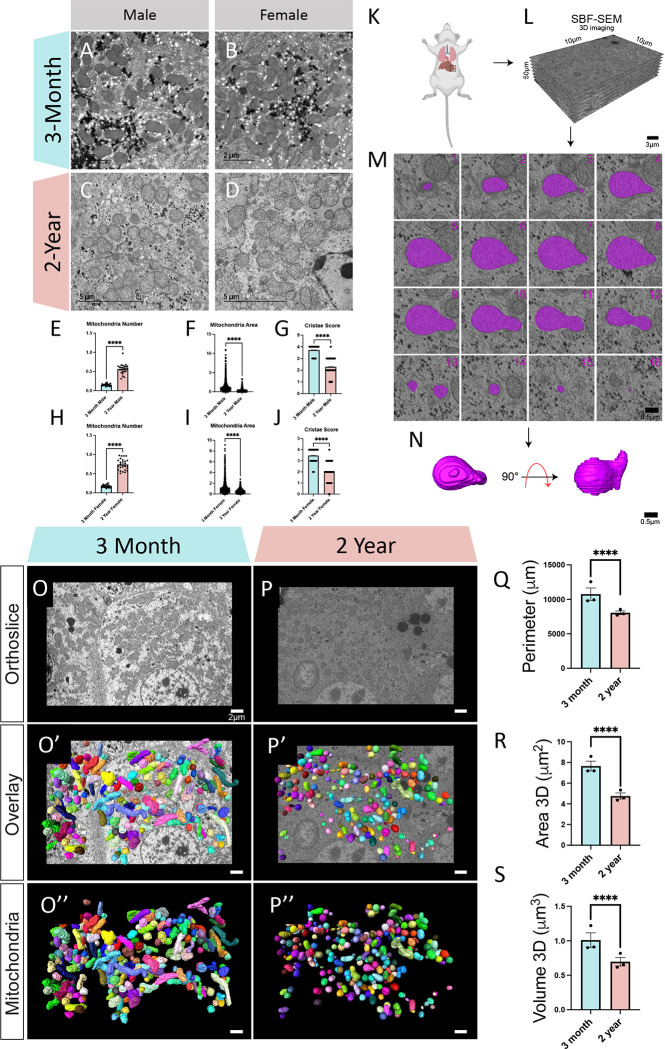
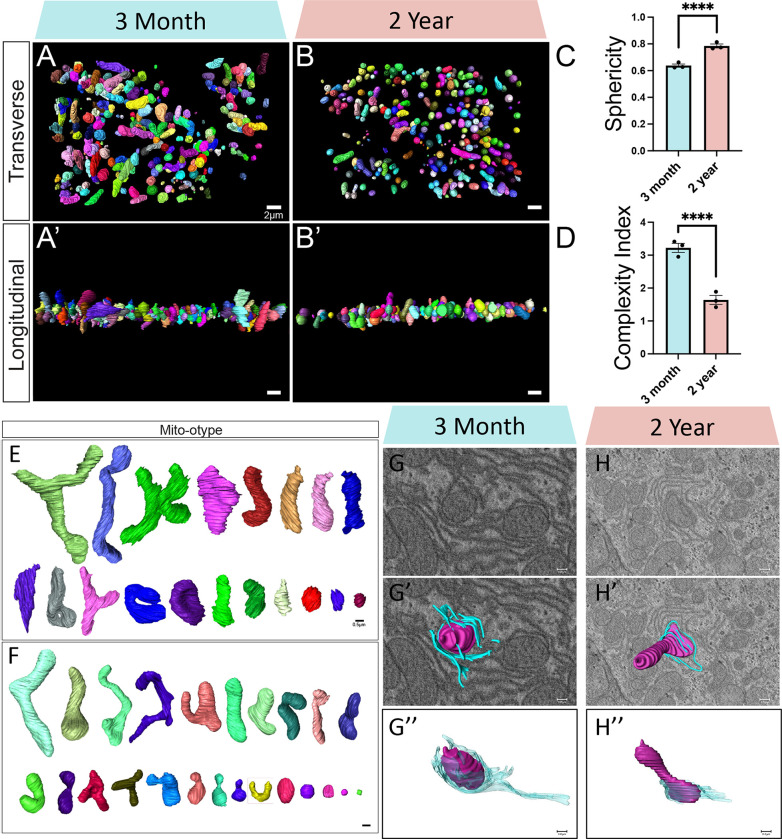
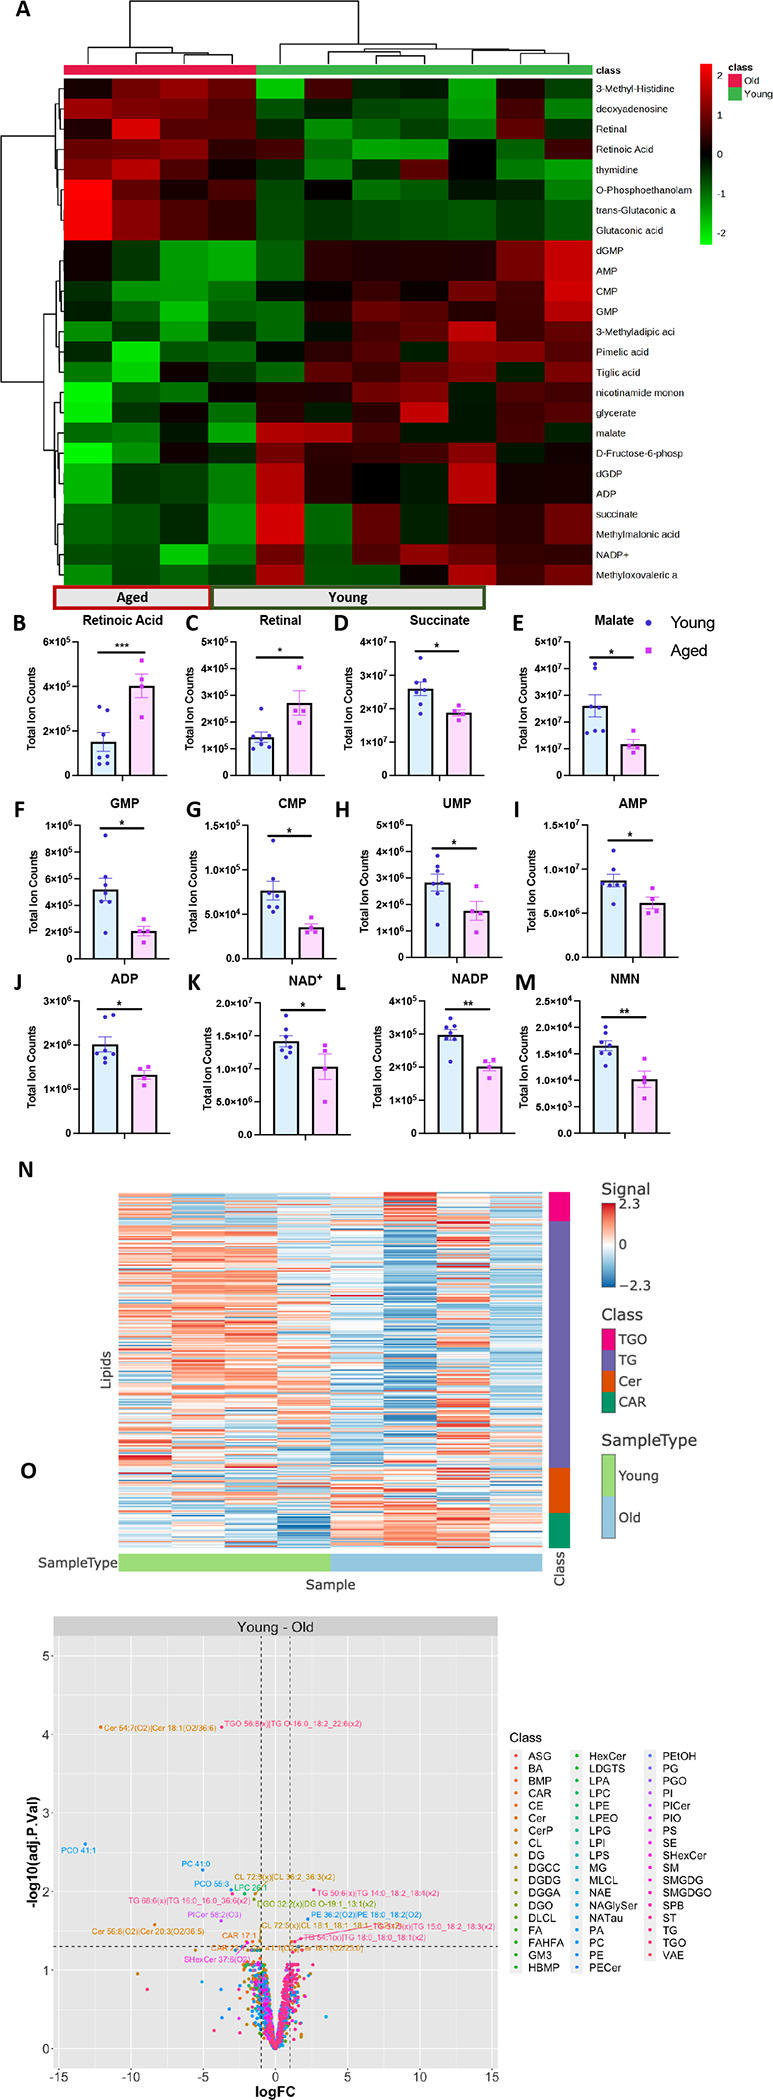
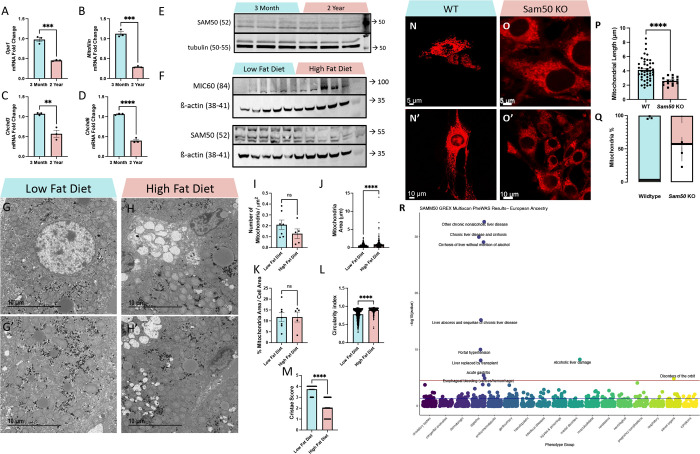
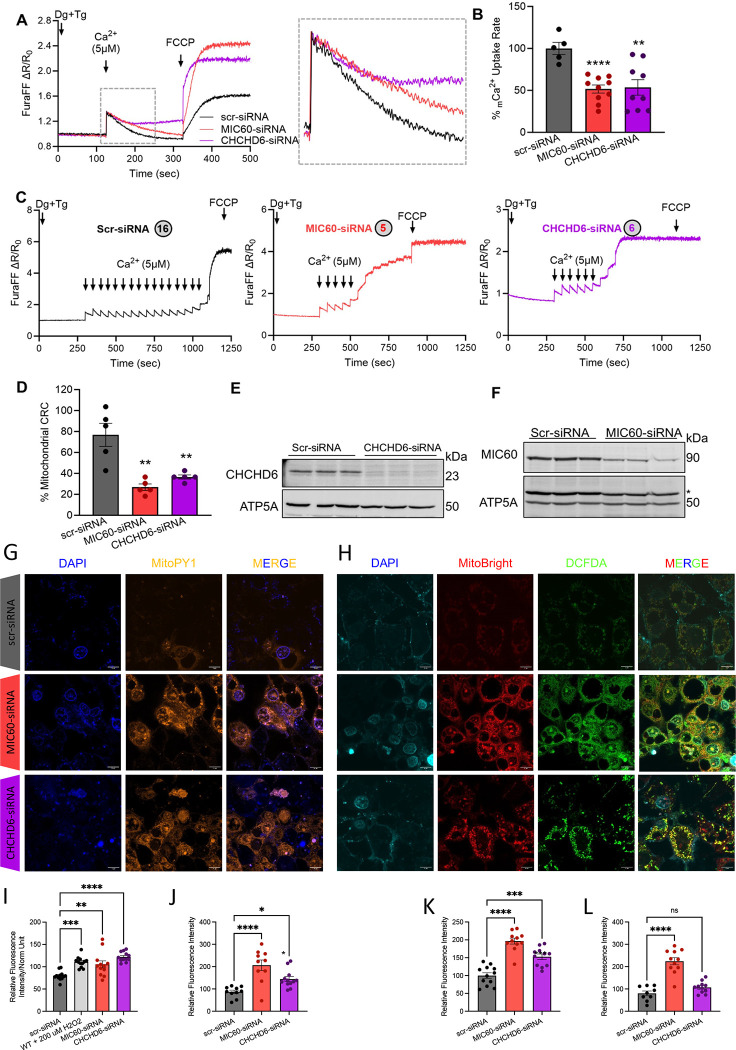
The liver, the largest internal organ and a metabolic hub, undergoes significant declines due to aging, affecting mitochondrial function and increasing the risk of systemic liver diseases. How the mitochondrial three-dimensional (3D) structure changes in the liver across aging, and the biological mechanisms regulating such changes confers remain unclear. In this study, we employed Serial Block Face-Scanning Electron Microscopy (SBF-SEM) to achieve high-resolution 3D reconstructions of murine liver mitochondria to observe diverse phenotypes and structural alterations that occur with age, marked by a reduction in size and complexity. We also show concomitant metabolomic and lipidomic changes in aged samples. Aged human samples reflected altered disease risk. To find potential regulators of this change, we examined the Mitochondrial Contact Site and Cristae Organizing System (MICOS) complex, which plays a crucial role in maintaining mitochondrial architecture. We observe that the MICOS complex is lost during aging, but not Sam50. Sam50 is a component of the sorting and assembly machinery (SAM) complex that acts in tandem with the MICOS complex to modulate cristae morphology. In murine models subjected to a high-fat diet, there is a marked depletion of the mitochondrial protein SAM50. This reduction in Sam50 expression may heighten the susceptibility to liver disease, as our human biobank studies corroborate that Sam50 plays a genetically regulated role in the predisposition to multiple liver diseases. We further show that changes in mitochondrial calcium dysregulation and oxidative stress accompany the disruption of the MICOS complex. Together, we establish that a decrease in mitochondrial complexity and dysregulated metabolism occur with murine liver aging. While these changes are partially be regulated by age-related loss of the MICOS complex, the confluence of a murine high-fat diet can also cause loss of Sam50, which contributes to liver diseases. In summary, our study reveals potential regulators that affect age-related changes in mitochondrial structure and metabolism, which can be targeted in future therapeutic techniques.

Keywords: 3D Structure; Aging; Liver Disease; MICOS Complex; Metabolism; Mitochondria.


Conflict of interest statement

CONFLICT OF INTEREST The authors declare that they have no conflict of interest. All authors have no competing interests.

Figures

Figure 1:
Figure 1:. Comparative analyses of liver lipid content and morphology in young and old patients.
Cross-sectional imaging of in-phase (left) and out-of-phase (right) liver anatomy data from (A) males under 55 years old (aged 14–53 years old; n = 10), (B) females under 55 years old (aged 17–41 years old; n = 10), (C) males over 60 years old (aged 60–85 years old; n = 10), and (D) females over 60 years old (aged 64–96 years old; n = 10). (E) Computed fat percentage in males, (F) females, and (G) combined young and old cohorts. (H) Oil Red O staining at 20X and (I) 40X magnification in young and (J-K) old samples. (L) Quantification of Oil Red O staining per area in 3-month and 2-year murine liver samples (n=10). (M) Quantifications of liver weight relative to total body weight as a percent (n=10), (N) relative reverse transcription-quantitative polymerase chain reaction mtDNA content (n=8), (O) bile acids concentrations (n=10), (P) liver triglycerides concentration (n=8), (Q) and serum triglycerides concentration (n=8). For all panels, error bars indicate SEM, Mann–Whitney tests were used for statistical analysis, and significance value indicate *P ≤ 0.05, **P ≤ 0.01, ***P ≤ 0.001, ****P ≤ 0.0001, and ns indicates non-significant.
Figure 2:
Figure 2:. Transmission Electron Microscopy and Serial Block Face-Scanning Electron Microscopy Shows Changes in Mitochondria Murine Liver Across Aging.
(A) Representative transmission electron micrographs in males and (B) females from 3-month and (C-D) 2-year murine liver tissue. (E) Mitochondrial quantifications of male mitochondria number (n=21, 3-months; n=24, 2-years) (F) mitochondrial area (n=1309, 3-months; n=333, 2-years) (G) and cristae score (n=555, 3-months; n=555, 2-years). (H) Mitochondrial quantifications of female mitochondria number (n=21, 3-months; n=25, 2-years) (I) mitochondrial area (n=1253, 3-months; n=1018, 2-years) (J) and cristae score (n=684, 3-months; n=684, 2-years). (K) Schematic depicting removal of the liver. (L) Following embedded fixation, Serial Block Face-Scanning Electron Microscopy (SBF-SEM) allows for ortho-slice alignment. (M) Manual segmentation of ortho slices was performed to yield (N) 3-dimensional (3-D) reconstructions of individually colored mitochondria. (O) Representative ortho slice images from 3-month murine liver tissue and (P) 2-year murine liver tissue. (O’) Representative ortho slice images with 3D reconstructions of mitochondria overlaid from 3-month murine liver tissue and (P’) 2-year murine liver tissue. (O”) Isolated 3D reconstructions of mitochondria from 3-month murine liver tissue and (P”) 2-year murine liver tissue (Q) Mitochondrial quantifications mitochondrial perimeter, (R) area, (S) and volume. For SBF-SEM, in total, 3-month samples both included 750 (n=250, per mouse) for a total of 1500 mitochondria, which were used for statistical analysis. For all panels, error bars indicate SEM, Mann–Whitney tests were used for statistical analysis, and significance values indicate **P ≤ 0.01, ***P ≤ 0.001, and ns, not significant.
Figure 3:
Figure 3:. Serial Block Face-Scanning Electron Microscopy Shows Changes in Mitochondrial Morphology in Liver Across Aging.
(A) 3D reconstructions of mitochondria displayed from the transverse viewpoint in 3-month and (B) 2-year murine liver tissue. (A’) Representative images of 3D reconstructions of mitochondria displayed from the longitudinal viewpoint in 3-month and (B’) 2-year murine liver tissue. (C) Based on these measurements, the mitochondrial sphericity and (D) complexity index was determined. (E) Mito-otyping displays diversity in mitochondrial morphology across each relative volume of mitochondria in 3-month and (F) 2-year murine liver tissue. (G-H”) Qualitative identification of wrappER. (G) Orthogonal (ortho) slice from 3-month and (H) 2-year samples, with (G’-H’) 3D reconstruction of mitochondria and endoplasmic reticulum overlaid. (G”-H”) Isolated 3D reconstruction of mitochondria, in purple, and endoplasmic reticulum, in blue. For SBF-SEM, in total, 3-month samples both included 750 (n=250, per mouse) for a total of 1500 mitochondria, which were used for statistical analysis. For all panels, error bars indicate SEM, Mann–Whitney tests were used for statistical analysis, and significance value indicate ****P ≤ 0.0001.
Figure 4:
Figure 4:. Global metabolomic and lipidomic profiling revealed metabolic dysregulation and disruptions in lipid classes with age in liver tissues.
(A) Metabolomics heatmap showing the relative abundance of metabolites. (B-M) Metabolite pools illustrating the metabolic pathways that are altered with age in the liver– Vitamin A Metabolism, TCA Cycle, Nucleotide Metabolism, and NAD+ metabolism. (N) Heatmap showing enriched lipid classes based on comparison between young and old liver tissues. (O) Volcano plot labeling significant hits, which have adjusted p-value <0.05 and fold change (+ or −) greater than 1. For each tissue and metabolite in the heatmaps, the aged samples were normalized to the median of the young samples and then log2 transformed. Significantly different lipid classes represented in the figures are those with adjusted p-values < 0.05 (note: p-values were adjusted to correct for multiple comparisons using an FDR procedure) and log fold changes greater than 1 or less than −1. Young, n= 4; aged, n= 4. For all panels, error bars indicate SEM, ** indicates p< 0.01; and *p< 0.05, calculated with Student’s t-test.
Figure 5.
Figure 5.. Aging Causes MICOS Loss, Diet Changes Affect SAM50 Expression, and SAM50 has Genetic Associations with Liver Diseases.
(A-D) Quantitative PCR shows changes in mRNA transcripts in (A) Opa1, (B) Mitofilin/Mic60, (C) Chchd3/Mic19, and (D) Chchd6/Mic25 between 3-month and 2-year murine liver samples. (E) Western blotting showing SAM50 protein levels, relative to tubulin, in 3-month and 2-year murine liver samples. (F) Western blotting showing MIC60 and SAM50 protein levels, relative to ß-actin, in low-fat diet and high-fat diet murine liver samples. (G-G’) Representative transmission electron micrographs from low-fat diet and (H-H’) high-fat diet murine liver tissue. Quantifications of (I) mitochondria number, as normalized to cell area (n=7, low fat diet; n=5, high fat diet), (J) individual mitochondrial area (n=592, low fat diet; n=266, high fat diet), (K) the sum of all mitochondrial area normalized to total cell area (n=7, low fat diet; n=5, high fat diet), (L) mitochondrial circularity index, (n=598, low fat diet; n=271, high fat diet), and (M) cristae score (n=425, low fat diet; n=425, high fat diet). (N-N’) Representative confocal fluorescence (using mCherry-Mito-7) from wildtype and (O-O’) Sam50-knockout fibroblasts. (P) Quantifications of mitochondrial length. (Q) Relative proportion of mitochondria that are either fragmented or tubular in wildtype and Sam50 KO fibroblasts, with the white area representing percentage of fragmentation and colored areas representing percentage of typical tubular. (R) Phenome-wide association study (PheWAS) results for SAMM50 GReX in individuals of European ancestry (n=70,440). The GReX for SAMM50 was tested for association across 1,704 clinical phenotypes extracted from the EHR. Association tests were run using logistic regression models, accounting for genetic ancestry (principle components/PC 1–10), sex, age, median age of medical record, and genotyping batch. Associations that met the Bonferroni-corrected threshold (red line, p < 2.934272 × 10⁻⁵) are labeled with phenotype name [see SFile 1 for all PheWAS results]. The blue line represents nominal significance (p = 0.05) For all panels, error bars indicate SEM, Mann–Whitney tests were used for statistical analysis, and significance value indicate ****P ≤ 0.0001, ns indicates non-significant.
Figure 6:
Figure 6:. Loss of MIC60 and CHCHD6 in HepG2 cells results in reduced mCa2+ uptake and calcium retention capacity and oxidative stress.
(A) Raw traces showing mitochondrial calcium uptake in permeabilized MIC60 and CHCHD6 knockdown HepG2 cells along with scr-siRNA transected controls. (B) Percentage change in mCa2+ uptake rate quantified from raw traces. (C) Recordings of mitochondrial calcium retention capacity in scr-siRNA, MIC60 siRNA, and CHCHD6 siRNA HepG2 cells. The circles indicate the number of calcium boluses taken up by specific cells. (D) Percentage change in mitochondrial calcium retention capacity quantified from recordings of mitochondrial calcium retention capacity. (E) Immunoblot confirming siRNA-mediated knockdown of CHCHD6 in HepG2 cells. (F) Immunoblot confirming siRNA-mediated knockdown of MIC60 in HepG2 cells. (G) 4′,6-diamidino-2-phenylindole (DAPI) staining, MitoPY1 (5 μM, 45 min at 370 c magnification of 60x), and merge channels in scramble-siRNA (control), MIC60-siRNA, and CHCHD6-siRNA transfected permeabilized HepG2 cells. (H) 4′,6-diamidino-2-phenylindole (DAPI) staining, MitoBright Deep Red (10 μM, 30 min at 37° c), DCFDA (10 μM, 30 min at 37° c, magnification of 60x), and merge channels in scramble-siRNA (control), MIC60-siRNA, and CHCHD6-siRNA transfected permeabilized HEK293 cells. (I) Plate reader-based reactive oxygen species (ROS) quantification. (J) Microscopy-based ROS quantification of MitoPY1 orange, (K) MitoSox Deep Red, and (L) DCFDA. For all statistical tests, one-way ANOVA statistical test was performed with Dunnett’s multiple comparisons test. N=5–10 for all calcium experiments, each indicated by dots, as run in triplicates. N=9–13 for all oxidative stress experiments, each indicated by dots, as run in triplicates. Significance values indicate **P ≤ 0.01 and ****P ≤ 0.0001.

References

    1. McBride HM, Neuspiel M, Wasiak S. Mitochondria: more than just a powerhouse. Curr Biol CB. 2006;16(14):R551–560. - PubMed
    1. Glancy B, et al. The Functional Impact of Mitochondrial Structure Across Subcellular Scales. Front Physiol. 2020;11. 10.3389/fphys.2020.541040. Accessed December 16, 2022. - DOI - PMC - PubMed
    1. Picard M, et al. Mitochondria: isolation, structure and function. J Physiol. 2011;589(18):4413–4421. - PMC - PubMed
    1. Chan DC. Fusion and fission: interlinked processes critical for mitochondrial health. Annu Rev Genet. 2012;46:265–287. - PubMed
    1. Li M, et al. Mitochondrial Fusion Via OPA1 and MFN1 Supports Liver Tumor Cell Metabolism and Growth. Cells. 2020;9(1):121. - PMC - PubMed

Publication types

LinkOut - more resources