[Preprint]. 2024 Jun 25:2024.06.21.600035.
doi: 10.1101/2024.06.21.600035.

Systemic low-dose anti-fibrotic treatment attenuates ovarian aging in the mouse

Affiliations

Systemic low-dose anti-fibrotic treatment attenuates ovarian aging in the mouse

Farners Amargant et al. bioRxiv. .

Update in

Abstract

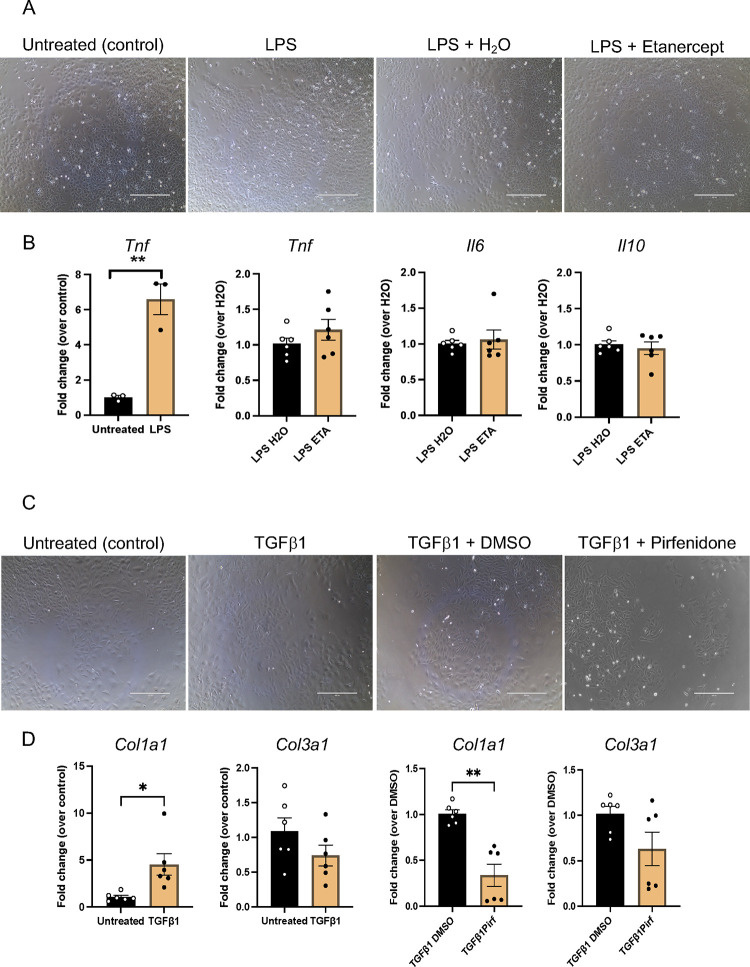
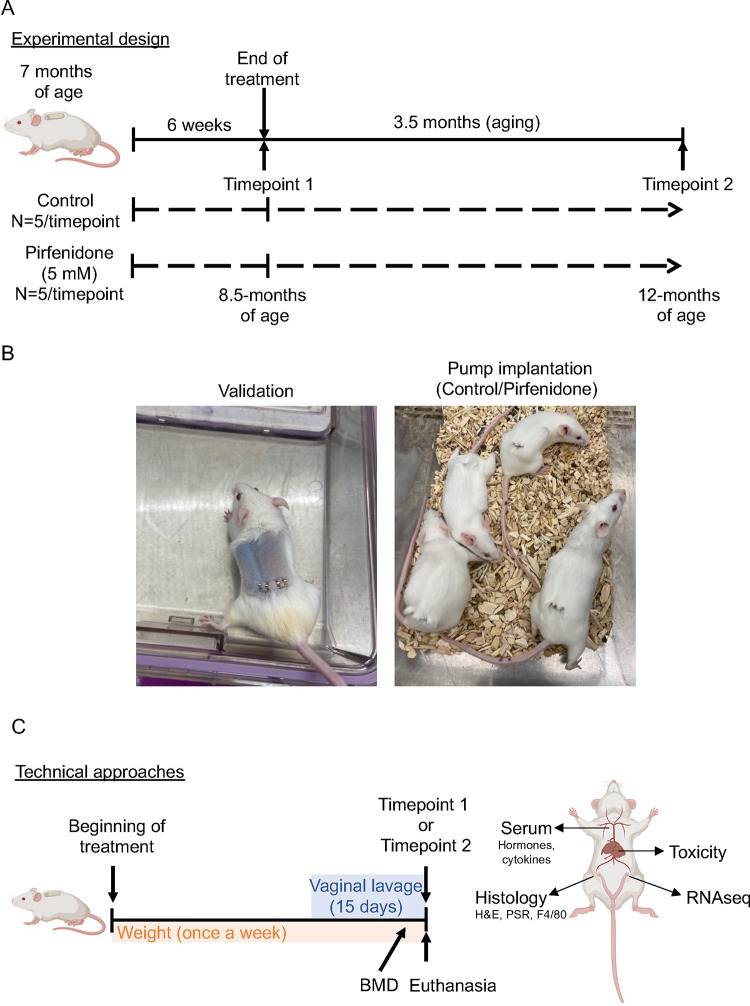
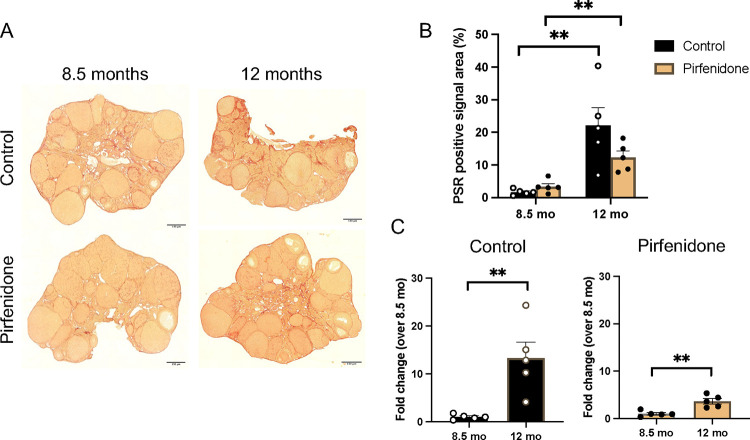
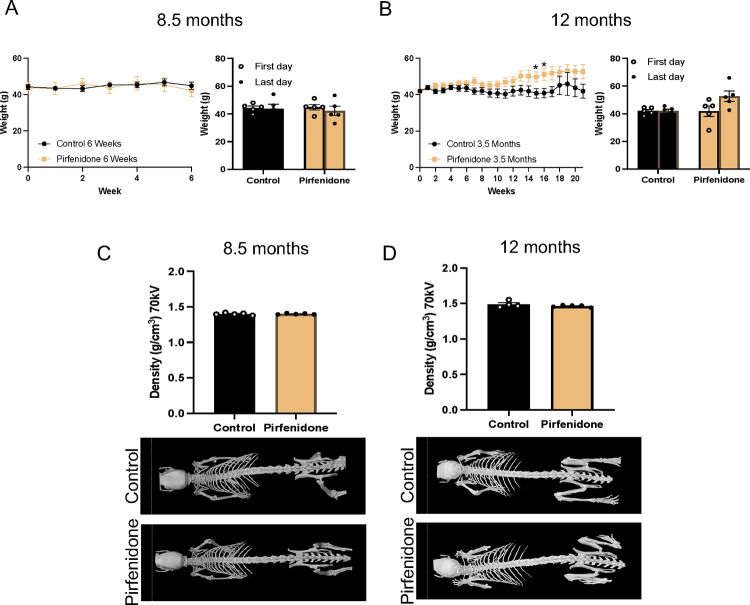
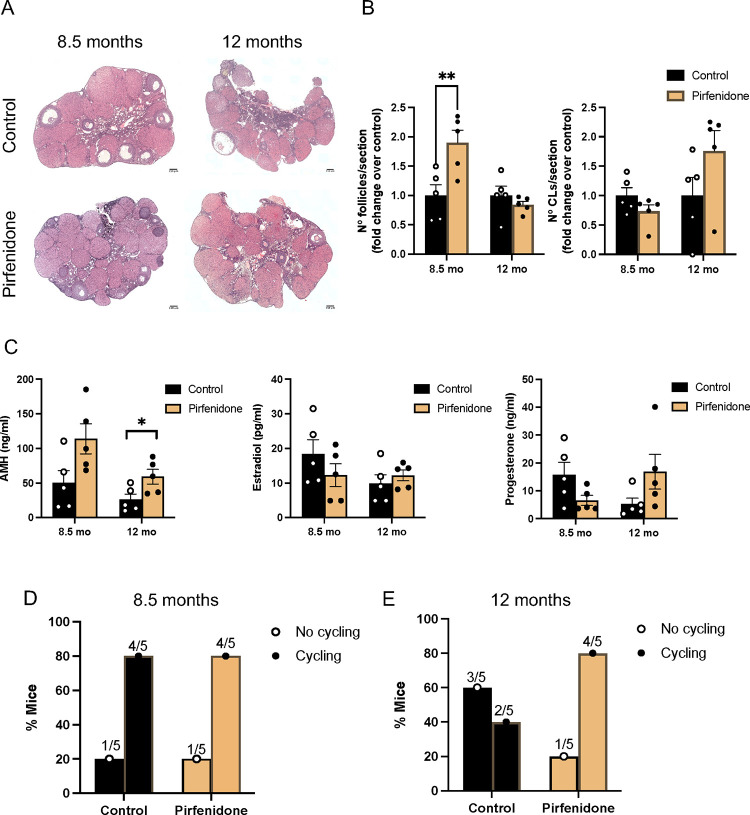
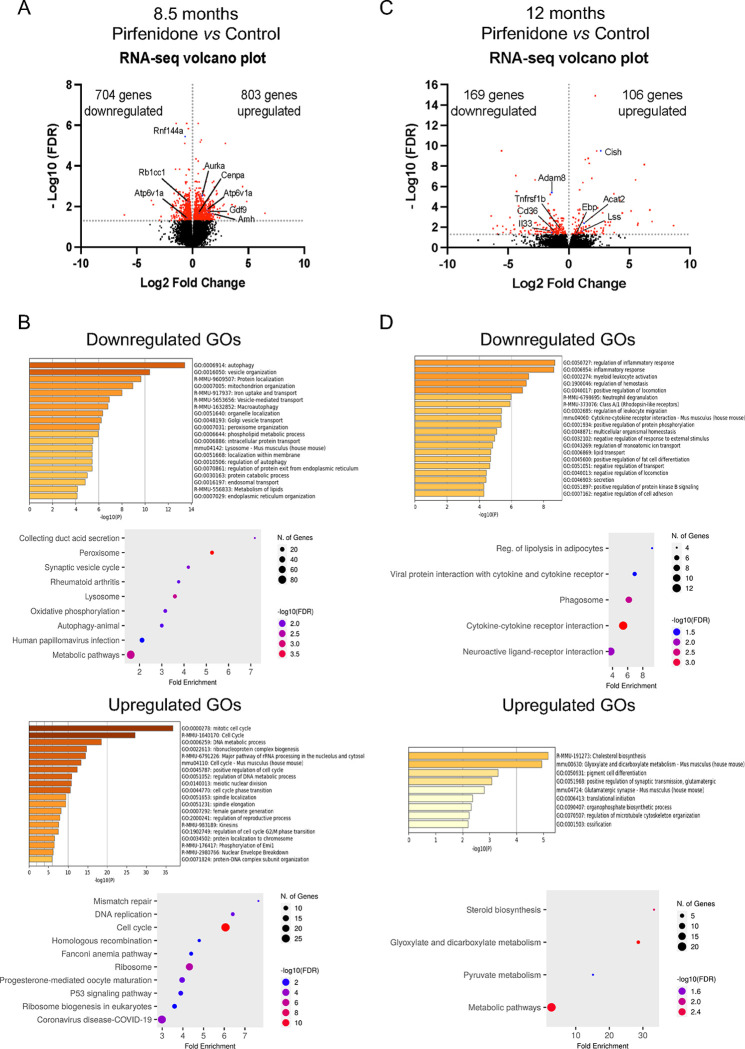
The female reproductive system is one of the first to age in humans, resulting in infertility and endocrine disruptions. The aging ovary assumes a fibro-inflammatory milieu which negatively impacts gamete quantity and quality as well as ovulation. Here we tested whether the systemic delivery of anti-inflammatory (Etanercept) or anti-fibrotic (Pirfenidone) drugs attenuates ovarian aging in mice. We first evaluated the ability of these drugs to decrease the expression of fibro-inflammatory genes in primary ovarian stromal cells. Whereas Etanercept did not block Tnf expression in ovarian stromal cells, Pirfenidone significantly reduced Col1a1 expression. We then tested Pirfenidone in vivo where the drug was delivered systemically via mini-osmotic pumps for 6-weeks. Pirfenidone mitigated the age-dependent increase in ovarian fibrosis without impacting overall health parameters. Ovarian function was improved in Pirfenidone-treated mice as evidenced by increased follicle and corpora lutea number, AMH levels, and improved estrous cyclicity. Transcriptomic analysis revealed that Pirfenidone treatment resulted in an upregulation of reproductive function-related genes at 8.5 months and a downregulation of inflammatory genes at 12 months of age. These findings demonstrate that reducing the fibroinflammatory ovarian microenvironment improves ovarian function, thereby supporting modulating the ovarian environment as a therapeutic avenue to extend reproductive longevity.

Keywords: fibrosis; healthspan; inflammation; ovarian function; reproductive aging.


Conflict of interest statement

Conflicts of Interest: The authors have no conflicts of interest to declare.

Figures

Figure 1:
Figure 1:. Etanercept does not impact the expression of inflammatory markers, whereas Pirfenidone reduces Col1a1 expression in primary ovarian stromal cells.
(A) Representative transmitted light images of primary ovarian stromal cells that were either untreated or treated with LPS, LPS and H2O, or LPS and Etanercept (ETA) for 48 h. (B) Quantification of the relative expression of Tnf, Il6, and Il10 transcripts in untreated cells or those treated with LPS, LPS and H2O, or LPS and Etanercept. (C) Representative transmitted light images of primary ovarian stromal cells that were either untreated or treated with TGFβ1, TGFβ1 and DMSO, or TGFβ1 and Pirfenidone for 48 h. (D) Quantification of the relative expression of Col1a1 and Col3a1 transcripts in untreated cells or those treated with TGFβ1, TGFβ1 and DMSO, or TGFβ1 and Pirfendione. N=3 independent stromal cell cultures per condition. Significant differences are noted (* indicates p<0.05 and ** indicates p<0.01). The scale bar is 400 μm.
Figure 2:
Figure 2:. Paradigm of in vivo drug delivery and experimental reproductive and general health endpoints.
(A) Mini-osmotic pumps filled with diluent (30% PEG, 3% DMSO and H2O) or 10 mg/ml Pirfenidone were implanted in CD1 female mice at 7 months of age, and systemic delivery was performed for 6 weeks. At the end of the treatment (Timepoint 1), one cohort of mice was analyzed (8.5 months), whereas another cohort was aged for an additional 3.5 months following removal of the mini-osmotic pump. This cohort of mice was then analyzed at 12 months (Timepoint 2). (B) The left image shows a 7-month old CD1 female mouse bearing a mini-osmotic pump containing non-toxic Evans blue dye. The distribution throughout the body demonstrates effective systemic delivery. The right image shows 7-month old CD1 mice implanted with mini-osmotic pumps that release either control solution (vehicle) or Pirfenidone (10 mg/ml). (C) In each experimental condition, mice were weighed weekly. Fifteen days prior to Timepoint 1 or Timepoint 2, estrous cyclicity was monitored by daily vaginal lavage. The week before Timepoint 1 or Timepoint 2, microCT scans were performed to assess bone mass density (BMD). At euthanasia (Timepoint 1 and Timepoint 2), blood was extracted to isolate serum for hormone and cytokine analyses, the left ovary was isolated for RNA extraction and RNAseq analysis, the right ovary was isolated and fixed for histological and immunohistochemical analyses, and the liver was isolated and fixed for toxicity analysis.
Figure 3:
Figure 3:. Pirfenidone-treated mice exhibit an attenuation in the age-associated increase in ovarian collagen relative to controls.
(A) Representative histological sections of ovarian tissue stained with PSR from control mice or those treated with Pirfenidone at 8.5 months and 12 months. The scale bar is 150 μm. (B) The quantification of the percentage of PSR-positive area per section is shown in control and Pirfenidone-treated mice at 8.5 and 12 months. (C) Graphs represent the fold change of collagen content at 12 months over 8.5 months in control (left) and Pirfenidone-treated mice (right). Significant differences are noted (** indicates p<0.01).
Figure 4:
Figure 4:. Pirfenidone-treated mice do not show evidence of in vivo toxicity based on weight and bone mass density.
(A) The graph on the left shows weekly animal weight over 6 weeks of treatment (control or Pirfenidone, 8.5 months). The graph on the right shows the comparison of the average weight of the control and Pirfenidone-treated mice on the first and last days that the measurements were taken. (B) The graph on the left shows weekly animal weight over the time course of 5 months (control or Pirfenidone, 12 months). The graph on the right shows the comparison of the average weight of the control and Pirfenidone-treated mice on the first and last days that the measurements were taken. (C-D) Representative images of bone mass density scans and graphs showing the density quantification in control and Pirfenidone-treated mice (C) immediately after the 6 week treatment (8.5 months) or (D) 3.5 months after the treatment (12 months). Significant differences are noted (** indicates p<0.01).
Figure 5:
Figure 5:. Multiple parameters of ovarian function are significantly improved in Pirfenidone-treated mice.
(A) Representative H&E-stained histological sections of ovaries from control and Pirfenidone-treated mice at 8.5 months and 12 months of age. (B) Graphs represent the fold change of the number of follicles and corpora lutea (CL) per ovarian section over control mice at 8.5 months and 12 months of age. (C) Quantification of serum levels of AMH, estradiol, and progesterone in control and Pirfenidone-treated mice at 8.5 months and 12 months. (D-E) Graphs of the percentage of mice that completed a whole estrous cycle during a 15 day period (cycling) compared to those that did not (no cycling) at 8.5 months (D) and 12 months (E). Significant differences are noted (* indicates p<0.05 and ** indicates p<0.01). The scale bar is 150 μm.
Figure 6:
Figure 6:. Genes involved in age-associated reduction in ovarian function are downregulated in Pirfenidone-treated mice.
(A) A volcano plot of the DEGs between control and Pirfenidone-treated mice at 8.5 months. Of the total 1507 genes that were differently expressed between treatments, 704 were downregulated and 803 upregulated in the Pirfenidone group compared to control. (B, C) Gene Ontology enrichment (bar plot) and KEGG pathway analysis (dot plot) of downregulated (B) and upregulated (C) genes in ovaries from Pirfenidone-treated mice compared to controls at 8.5 months. (D) A volcano plot of the DEGs between control and Pirfenidone-treated mice at 12 months. Of the total 275 genes that were differently expressed between treatments, 169 genes were downregulated and 106 genes were upregulated. (E, F) Gene Ontology (GO) enrichment (bar plot) and KEGG pathway (dot plot) analysis of downregulated (E) and upregulated (F) genes in ovaries from Pirfenidone-treated mice compared to controls at 12 months.

Similar articles

References

    1. Hainaut M. and Clarke H.J., Germ cells of the mammalian female: A limited or renewable resource?dagger Biol Reprod, 2021. 105(4): p. 774–788. - PMC - PubMed
    1. Hsueh A.J., et al. , Intraovarian control of early folliculogenesis Endocr Rev, 2015. 36(1): p. 1–24. - PMC - PubMed
    1. Doherty C.A., et al. , Bidirectional communication in oogenesis: a dynamic conversation in mice and Drosophila Trends Cell Biol, 2022. 32(4): p. 311–323. - PMC - PubMed
    1. Broekmans F.J., Soules M.R., and Fauser B.C., Ovarian aging: mechanisms and clinical consequences Endocr Rev, 2009. 30(5): p. 465–93. - PubMed
    1. Wu J., et al. , Aging conundrum: A perspective for ovarian aging Front Endocrinol (Lausanne), 2022. 13: p. 952471. - PMC - PubMed

Publication types

LinkOut - more resources