[Preprint]. 2024 Jun 25:2024.06.20.599943.
doi: 10.1101/2024.06.20.599943.

RNAi-mediated silencing of SOD1 profoundly extends survival and functional outcomes in ALS mice

Affiliations

RNAi-mediated silencing of SOD1 profoundly extends survival and functional outcomes in ALS mice

Alexandra Weiss et al. bioRxiv. .

Update in

  • RNAi-mediated silencing of SOD1 profoundly extends survival and functional outcomes in ALS mice.
    Weiss A, Gilbert JW, Rivera Flores IV, Belgrad J, Ferguson C, Dogan EO, Wightman N, Mocarski K, Echeverria D, Harkins AL, Summers A, Bramato B, McHugh N, Furgal R, Yamada N, Cooper D, Monopoli K, Godinho BMDC, Hassler MR, Yamada K, Greer P, Henninger N, Brown RH Jr, Khvorova A. Weiss A, et al. Mol Ther. 2025 Aug 6;33(8):3917-3938. doi: 10.1016/j.ymthe.2025.05.010. Epub 2025 May 9. Mol Ther. 2025. PMID: 40349108

Abstract

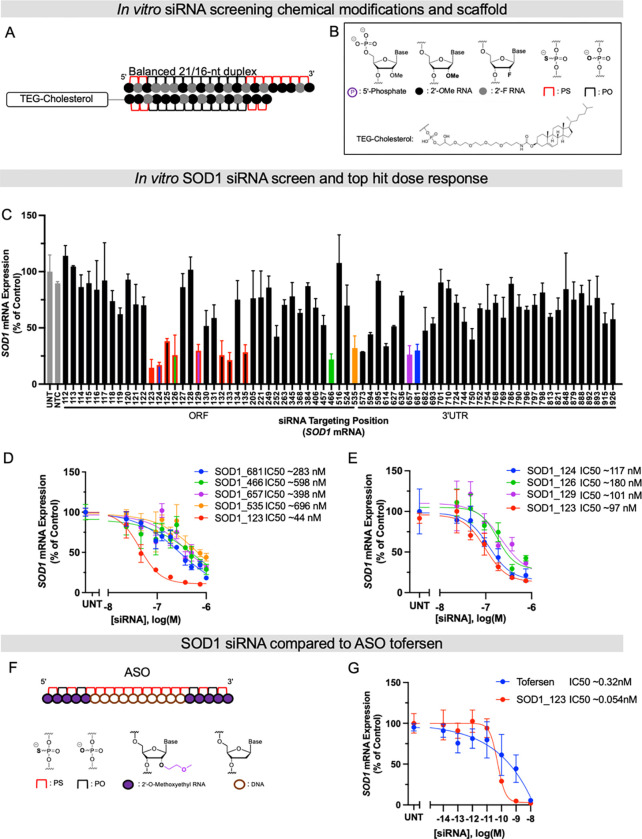
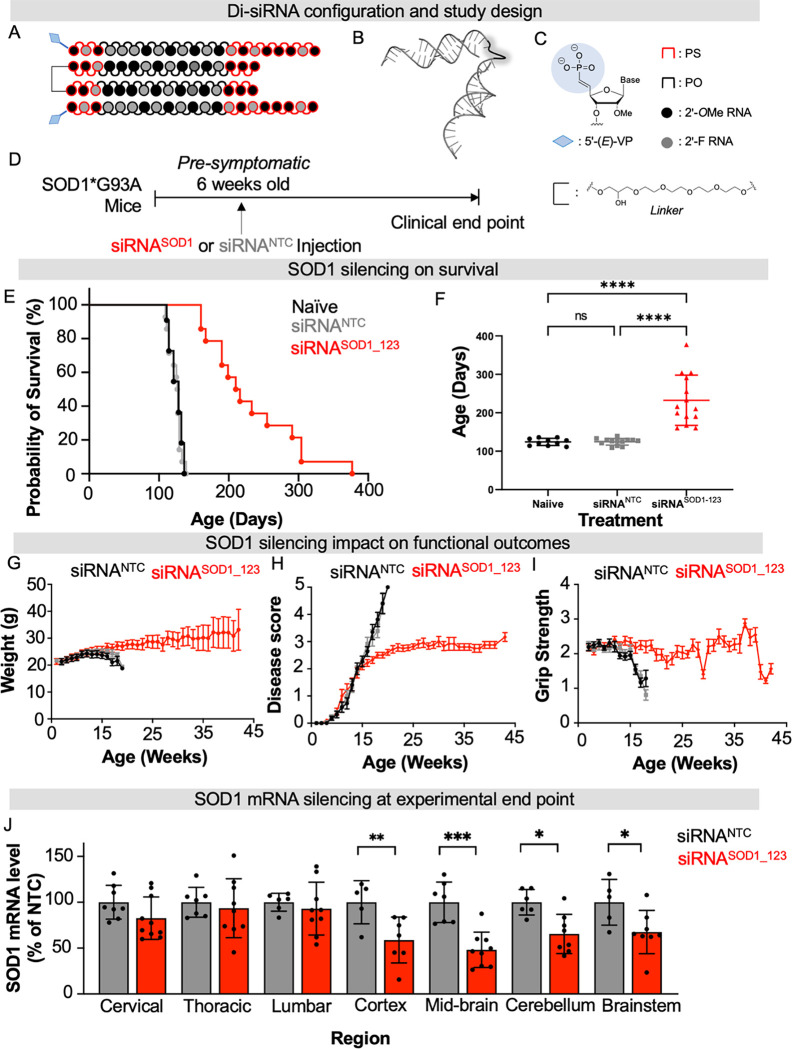
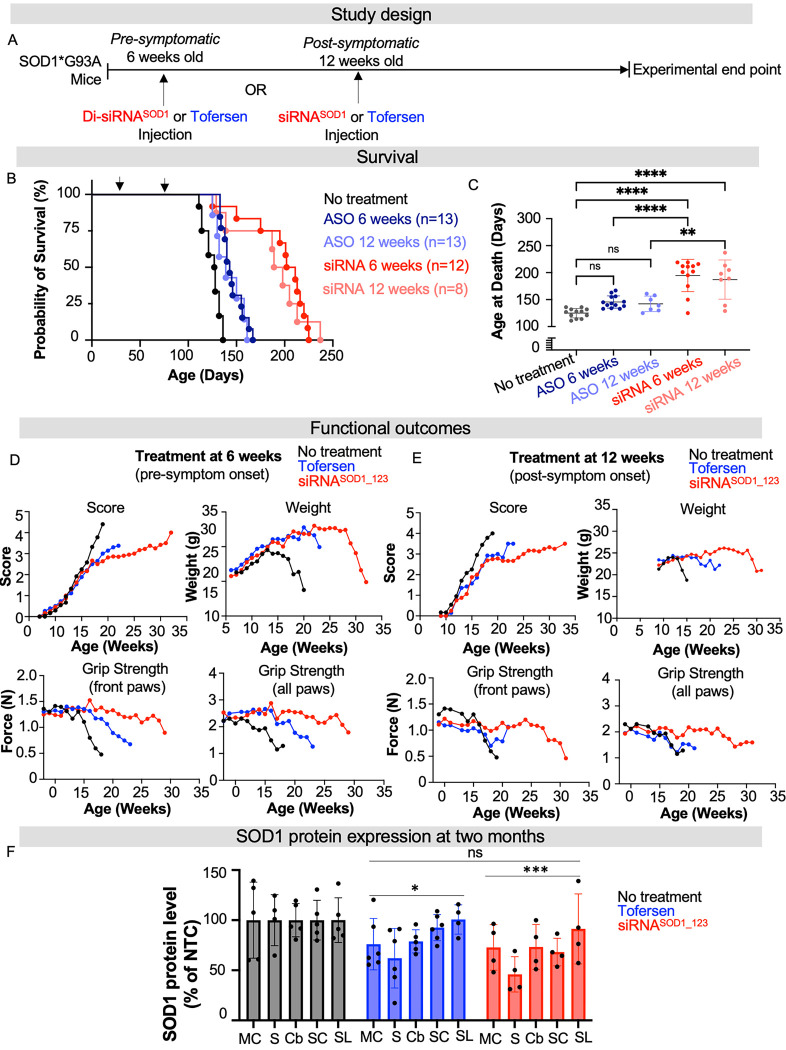
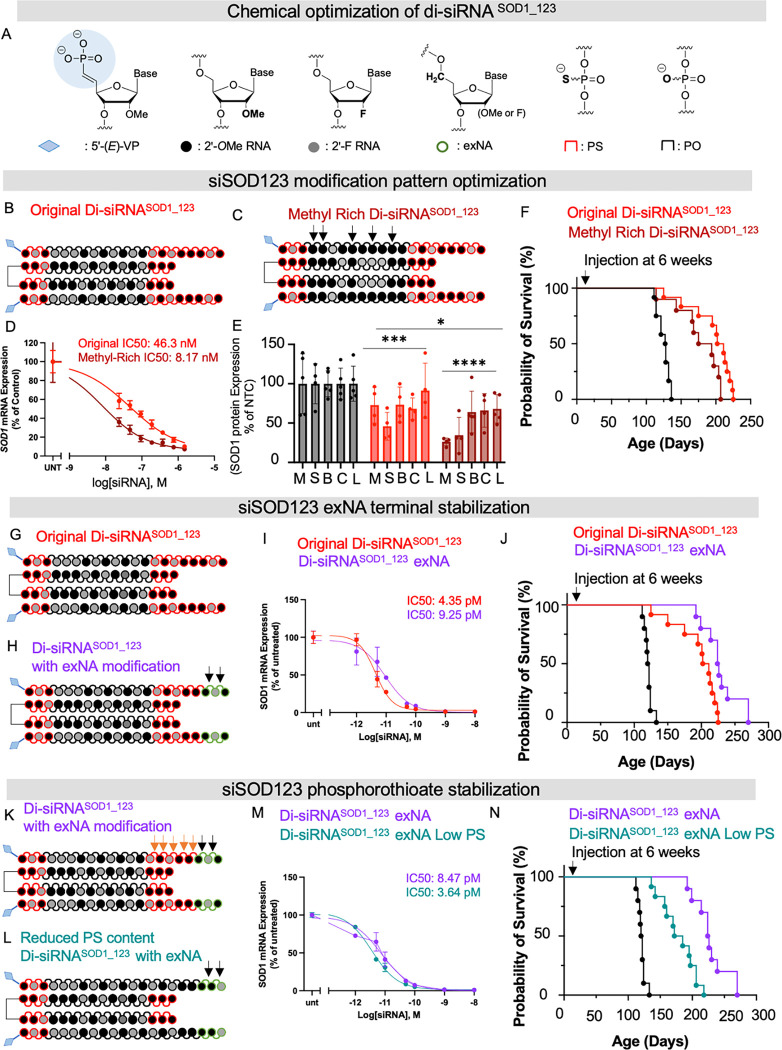
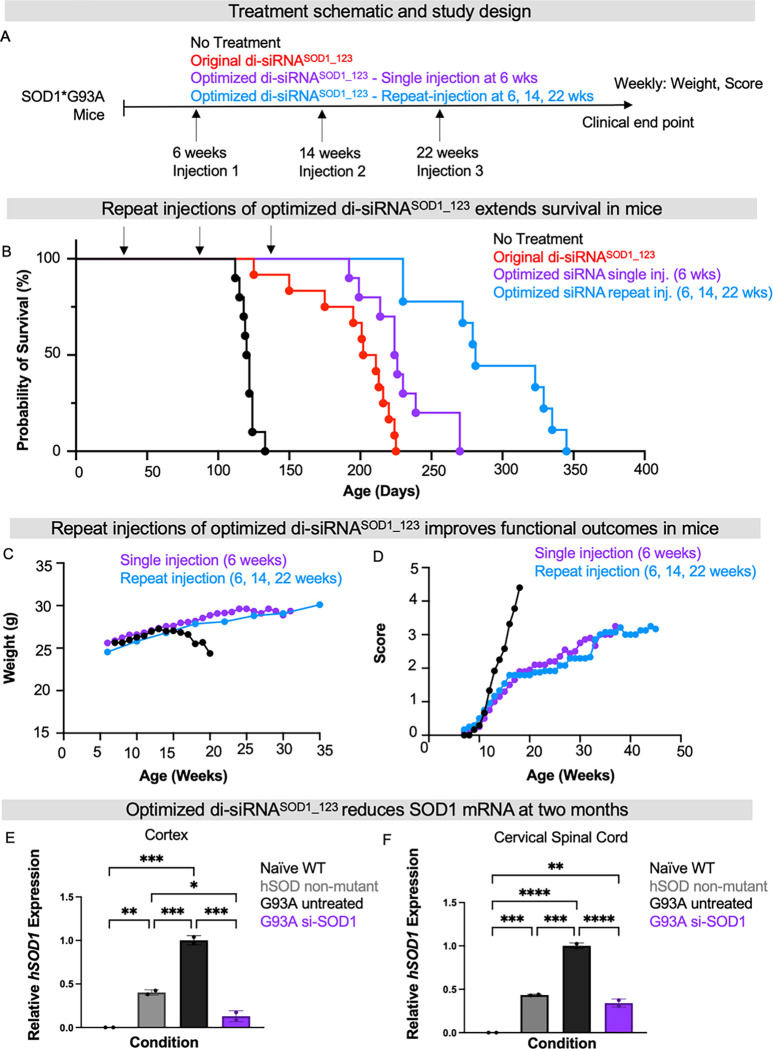
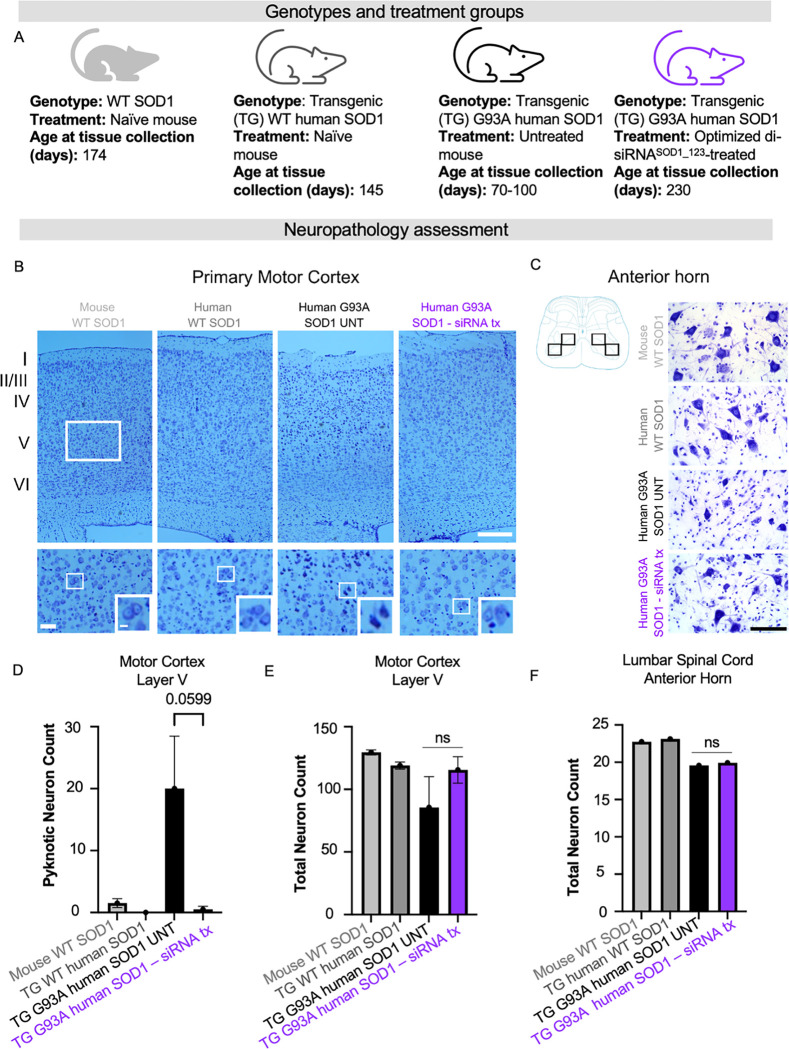
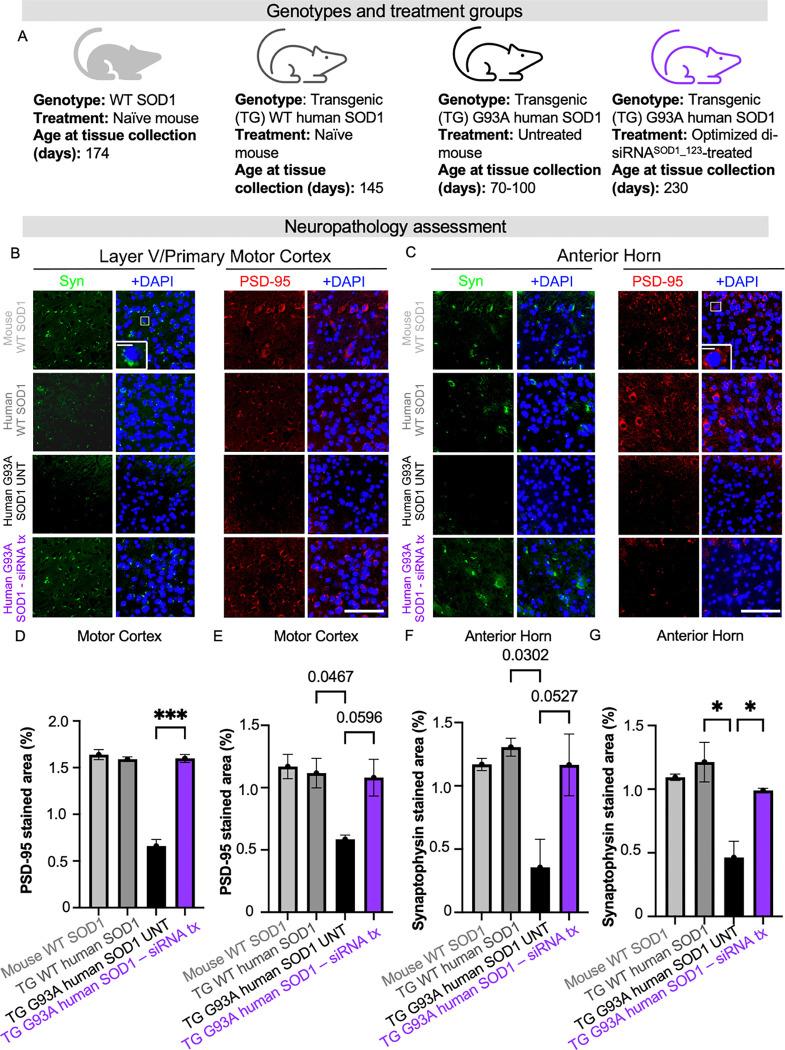
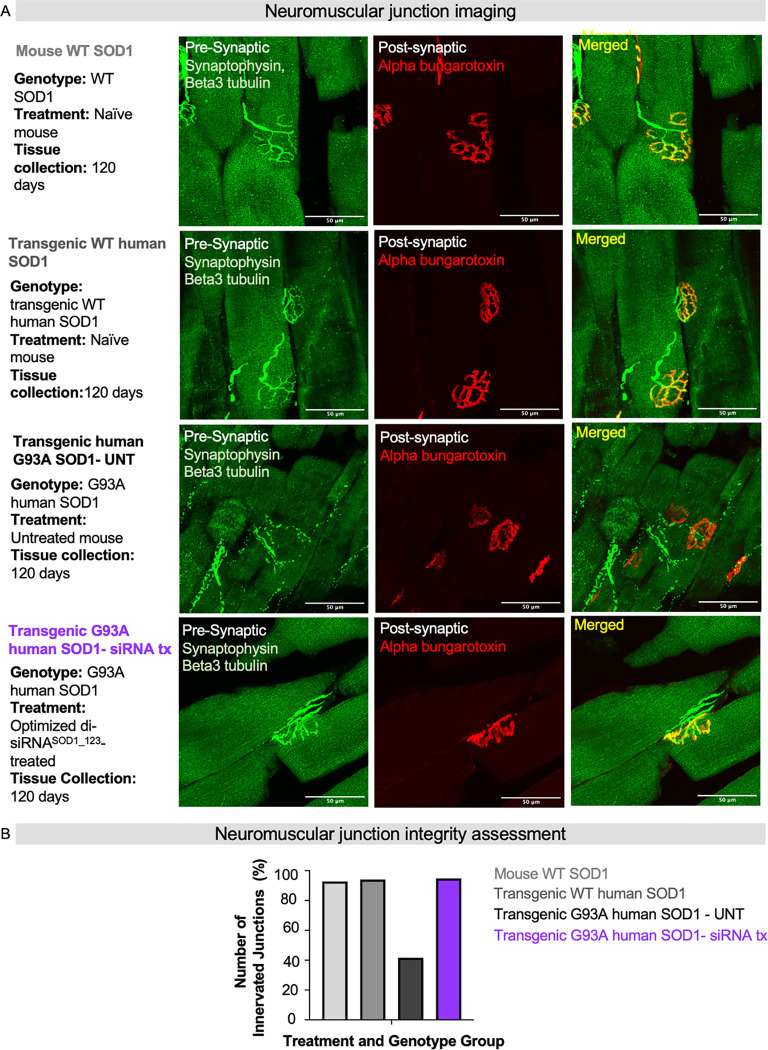
Amyotrophic lateral sclerosis (ALS) is a fatal neurodegenerative condition, with 20% of familial and 2-3% of sporadic cases linked to mutations in the cytosolic superoxide dismutase (SOD1) gene. Mutant SOD1 protein is toxic to motor neurons, making SOD1 gene lowering a promising approach, supported by preclinical data and the 2023 FDA approval of the GapmeR ASO targeting SOD1, tofersen. Despite the approval of an ASO and the optimism it brings to the field, the pharmacodynamics and pharmacokinetics of therapeutic SOD1 modulation can be improved. Here, we developed a chemically stabilized divalent siRNA scaffold (di-siRNA) that effectively suppresses SOD1 expression in vitro and in vivo. With optimized chemical modification, it achieves remarkable CNS tissue permeation and SOD1 silencing in vivo. Administered intraventricularly, di-siRNASOD1 extended survival in SOD1-G93A ALS mice, surpassing survival previously seen in these mice by ASO modalities, slowed disease progression, and prevented ALS neuropathology. These properties offer an improved therapeutic strategy for SOD1-mediated ALS and may extend to other dominantly inherited neurological disorders.


Conflict of interest statement

Competing interests: AK is a co-founder, on the scientific advisory board, and holds equities of Atalanta Therapeutics; AK is a founder of Comanche Pharmaceuticals, and on the scientific advisory board of Aldena Therapeutics, AlltRNA, Prime Medicine, and EVOX Therapeutics; Select authors hold patents or on patent applications relating to the divalent siRNA, SOD1-targeting oligonucleotides, and the methods described in this report. NH received compensation for other services from Myrobalan Inc. and General Dynamics during the conduct of this study, unrelated to the present work.

Figures

Fig. 1.
Fig. 1.. Systematic screening of chemically modified siRNAs targeting SOD1 mRNA identifies a highly functional compound.
(A and B) Schematics of chemical modifications and siRNA scaffolds tested in screen. (C) In vitro screen of SOD1 siRNAs in HeLa cells. HeLa cells were treated (by passive uptake) with a panel of siRNAs (1.5 μM) for 72 hours. (D) 7-point dose-response curves of lead siRNA compounds identified in primary screen in C for 72 hours. (E) 7-point dose-response curves of lead compounds from siRNA “walk” screen marked in red in the bar graph in C. (F) Schematic of ASO Tofersen and its modifications. (G) 7-point dose-response curves of Tofersen and SOD1_123 with lipid-mediated uptake. All mRNA levels were measured using QuantiGene (n=3, bar is average n=3 ± SD) IC50 values were calculated using the nonlinear least squares method (GraphPad Prism). NTC (nontargeting control siRNA), UNT (untreated).
Fig 2.
Fig 2.. Di-siRNASOD_123 extends lifespan of SOD1 G93A ALS mice.
(A-C) Di-siRNASOD_123 scaffold (A), PyMOL structure (B) and chemical modifications used (C). (D) Study design. (E) Kaplan-Meier survival curve of naïve (black), non-targeting control (NTC, gray) treated, or di-siRNASOD1_123 treated (red) G93A mice. (F) Plotted age at death for naive (black), NTC (gray) or di-siRNASOD1_123 (red) treated mice. (G-I) Naïve (black), non-targeting control (NTC, gray) treated, or di-siRNASOD1_123 treated (red) G93A mice weight (G), disease score (H), or grip strength (I) monitored weekly until clinical endpoint. (J) SOD1 mRNA in NTC (gray) or di-siRNASOD1_123 (red) treated mice. Tissue collection occurred at experimental endpoint. * p < 0.05, ** p< 0.01, *** p < 0.001, **** p < 0.0001, Two-way ANOVA with multiple comparisons.
Fig. 3.
Fig. 3.. Di-siRNASOD_123 showed enhanced survival compared to tofersen-treated G93A mice
(A) Study design. Treatment with tofersen (ASO, blue) or di-siRNASOD1_123 (siRNA, red) was initiated pre- (6-weeks) or post- (12-weeks) symptom onset. (B) Kaplan-Meier survival curve of naïve (black), non-targeting control (NTC, gray), ASO-6 weeks (dark blue), ASO-12 weeks (light blue), siRNA-6 weeks (red) or siRNA-12 weeks (light red) G93A mice. (C) Plotted age at death (in days) for all groups. (D) Impact of NTC (black), ASO (blue) or siRNA (red) treatment at 6 weeks on ALS score, weight, and grip strength when delivered. (E) Impact of NTC (black), ASO (blue) or siRNA (red) treatment at 12 weeks on ALS score, weight, and grip strength. (F) SOD1 protein at two months post-injection across CNS regions in NTC (gray), tofersen (blue) treated, or di-siRNASOD1_123 (red) treated mice. MC-medial cortex, S-striatum, T-thalamus, H-hippocampus, C-cortex, BS-brainstem, Cv-cervical spinal cord, Tc-thoracic spinal cord, L-lumbar spinal cord. * p < 0.05, ** p< 0.01, *** p < 0.001, **** p < 0.0001, Two-way ANOVA with multiple comparisons.
Fig 4.
Fig 4.. Chemical optimization of di-siRNASOD_123 enhances the impact on survival
(A) chemical modifications used to optimize di-siRNASOD_123. (B) chemical modifications and structure of original di-siRNASOD_123 (C) chemical modifications and structure of methyl-rich di-siRNASOD_123 (D) In vitro dose response of original (red) or methyl-rich (maroon) di-siRNASOD_123 (E) in vivo protein silencing of original or methyl-rich siRNA at two months post-injection. (F) Kaplan-Meier survival curve comparing G93A mice treated with the original or methyl-rich di-siRNASOD_123 or NTC control. (G) Chemical modifications and structure of original di-siRNASOD_123. (H) Chemical modifications and structure of di-siRNASOD_123 exNA (exNA noted with black arrows). (I) 7-point dose-response curves of original (red) or exNA (purple) di-siRNASOD_123 (J) Kaplan-Meier survival curve comparing G93A mice treated with the original or exNA di-siRNASOD_123 or NTC control. (K) Chemical modifications and structure of exNA di-siRNASOD_123 (PS noted with orange arrows, exNA with black arrows) (L) Chemical modifications and structure of exNA di-siRNASOD_123 with reduced phosphorothioate content (exNA noted with black arrows). (M) 7-point dose-response curves of exNA di-siRNASOD_123 high PS (purple) or exNA di-siRNASOD_123 low PS (teal). (N) Kaplan-Meier survival curve comparing G93A mice treated with exNA di-siRNASOD_123 high PS (purple), exNA di-siRNASOD_123 low PS, or standard NTC control. Survival studies used single injection at 6 weeks.
Fig. 5.
Fig. 5.. Repeat injections of di-siRNASOD_123 further enhance survival
(A) Study design: no treatment (black), original di-siRNASOD_123 (red), single injection of exNA di-siRNASOD_123 (siRNA, purple) or repeat injections (6, 14, 22 weeks) of exNA di-siRNASOD_123 (light blue) arms. Treatment was initiated at 6-weeks of age (pre-symptom onset). (B) Kaplan-Meier survival curve comparing G93A mice with no treatment, single injection of the original di-siRNASOD_123 treatment or exNA di-siRNASOD_123 treatment, or repeat injection of exNA di-siRNASOD_123. (C) Weight and (D) clinical scores for each study arm tracked until clinical endpoint. (E) SOD1 cortical mRNA levels (hSOD1, human SOD1) in naïve WT, humanized non-mutant SOD1 mice, G93A untreated mice, or the exNA di-siRNASOD_123 (single injection) arm at clinical endpoint. (F) SOD1 cervical mRNA levels (hSOD1, human SOD1) in naïve WT, humanized non-mutant SOD1 mice, G93A untreated mice, or the exNA di-siRNASOD_123 (single injection) arm at clinical endpoint. Tissue collection was performed and evaluated for SOD1 mRNA levels at the following time points: 174, 145, 70–100, or 230 days, respectively.
Figure 6.
Figure 6.. SOD1 knockdown with di-siRNA decreases number of apoptotic dark neurons in layer V of primary motor cortex in G93A mice.
(A) Genotypes and treatment groups used to assess neuropathology (B) Representative images of primary motor cortex, rectangles indicate the approximate region of interest (ROI) in layer V used for quantitative analyses. Scale bar = 250 μm (low power magnification), Scale bar=50 μm (high power magnification). (C) Cartoon and representative images showing ROIs used for quantification of pyramidal neurons. Scale bar=100 μm. (D) total number of Nissl-stained cortical neurons showed no statistical difference between groups. (E) dark neurons were significantly higher in number in the hSOD1G93A mice without treatment compared with other groups. (F) Number of pyramidal neurons counted within four ROIs in the anterior horn (cartoon) (average from two sections per animal). Data in the bar graphs are shown as mean ±SEM n=2 per group.
Figure 7:
Figure 7:. SOD1 silencing with di-siRNA rescued loss of synaptic markers in G93A mice.
(A) Genotypes and treatment groups used to assess neuropathology. (B) Representative images and insets showing presynaptic marker synaptophysin and postsynaptic marker PSD-95 staining signal from layer V of primary motor cortex. (C) Representative images and insets showing synaptophysin and PSD-95 staining signal from anterior horn of the lumbar spinal cord. (D) Quantification of PSD-95 in layer V of primary motor cortex. (E) Quantification of PSD-95 in anterior horn. (F) Quantification of synaptophysin in layer V of primary motor cortex (G) Quantification of synaptophysin in the anterior horn. Scale bar=100 μm, Scale bar=10 μm (inset). Data in the bar graphs are shown as mean ±SEM n=2 per group.
Fig. 8.
Fig. 8.. exNA di-siRNASOD_123 prevents neuromuscular junction destruction.
(A) Representative images from gastrocnemius slices co-stained with synaptophysin and beta-tubulin (green, pre-synapse) or alpha-bungarotoxin (red, post-synapse) to mark the neuromuscular junction (NMJ) (Merged, yellow). Scale bar = 50 μm. (B) Quantified NMJ innervation (percentage, %) for each treatment and genotype group. naïve WT, n=1; humanized non-mutant SOD1 mice, n=1; G93A untreated mice, n=1; the SOD1 siRNA-treated G93A, n=1.

References

    1. Talbott E. O., Malek A. M., Lacomis D., The epidemiology of amyotrophic lateral sclerosis. Handb Clin Neurol 138, 225–238 (2016). - PubMed
    1. Masrori P., Van Damme P., Amyotrophic lateral sclerosis: a clinical review. Eur J Neurol 27, 1918–1929 (2020). - PMC - PubMed
    1. Zhang S., Cooper-Knock J., Weimer A. K., Shi M., Moll T., Marshall J. N. G., Harvey C., Nezhad H. G., Franklin J., Souza C. D. S., Ning K., Wang C., Li J., Dilliott A. A., Farhan S., Elhaik E., Pasniceanu I., Livesey M. R., Eitan C., Hornstein E., Kenna K. P., Veldink J. H., Ferraiuolo L., Shaw P. J., Snyder M. P., Genome-wide identification of the genetic basis of amyotrophic lateral sclerosis. Neuron 110, 992–1008.e1011 (2022). - PMC - PubMed
    1. van Rheenen W., van der Spek R. A. A., Bakker M. K., van Vugt J. J. F. A., Hop P. J., Zwamborn R. A. J., de Klein N., Westra H.-J., Bakker O. B., Deelen P., Shireby G., Hannon E., Moisse M., Baird D., Restuadi R., Dolzhenko E., Dekker A. M., Gawor K., Westeneng H.-J., Tazelaar G. H. P., van Eijk K. R., Kooyman M., Byrne R. P., Doherty M., Heverin M., Al Khleifat A., Iacoangeli A., Shatunov A., Ticozzi N., Cooper-Knock J., Smith B. N., Gromicho M., Chandran S., Pal S., Morrison K. E., Shaw P. J., Hardy J., Orrell R. W., Sendtner M., Meyer T., Başak N., van der Kooi A. J., Ratti A., Fogh I., Gellera C., Lauria G., Corti S., Cereda C., Sproviero D., D’Alfonso S., Sorarù G., Siciliano G., Filosto M., Padovani A., Chiò A., Calvo A., Moglia C., Brunetti M., Canosa A., Grassano M., Beghi E., Pupillo E., Logroscino G., Nefussy B., Osmanovic A., Nordin A., Lerner Y., Zabari M., Gotkine M., Baloh R. H., Bell S., Vourc’h P., Corcia P., Couratier P., Millecamps S., Meininger V., Salachas F., Mora Pardina J. S., Assialioui A., Rojas-García R., Dion P. A., Ross J. P., Ludolph A. C., Weishaupt J. H., Brenner D., Freischmidt A., Bensimon G., Brice A., Durr A., Payan C. A. M., Saker-Delye S., Wood N. W., Topp S., Rademakers R., Tittmann L., Lieb W., Franke A., Ripke S., Braun A., Kraft J., Whiteman D. C., Olsen C. M., Uitterlinden A. G., Hofman A., Rietschel M., Cichon S., Nöthen M. M., Amouyel P., Comi G., Riva N., Lunetta C., Gerardi F., Cotelli M. S., Rinaldi F., Chiveri L., Guaita M. C., Perrone P., Ceroni M., Diamanti L., Ferrarese C., Tremolizzo L., Delodovici M. L., Bono G., Canosa A., Manera U., Vasta R., Bombaci A., Casale F., Fuda G., Salamone P., Iazzolino B., Peotta L., Cugnasco P., De Marco G., Torrieri M. C., Palumbo F., Gallone S., Barberis M., Sbaiz L., Gentile S., Mauro A., Mazzini L., De Marchi F., Corrado L., D’Alfonso S., Bertolotto A., Gionco M., Leotta D., Odddenino E., Imperiale D., Cavallo R., Pignatta P., De Mattei M., Geda C., Papurello D. M., Gusmaroli G., Comi C., Labate C., Ruiz L., Ferrandi D., Rota E., Aguggia M., Di Vito N., Meineri P., Ghiglione P., Launaro N., Dotta M., Di Sapio A., Giardini G., Tiloca C., Peverelli S., Taroni F., Pensato V., Castellotti B., Comi G. P., Del Bo R., Ceroni M., Gagliardi S., Corrado L., Mazzini L., Raggi F., Simoncini C., Lo Gerfo A., Inghilleri M., Ferlini A., Simone I. L., Passarella B., Guerra V., Zoccolella S., Nozzoli C., Mundi C., Leone M., Zarrelli M., Tamma F., Valluzzi F., Calabrese G., Boero G., Rini A., Traynor B. J., Singleton A. B., Mitne Neto M., Cauchi R. J., Ophoff R. A., Wiedau-Pazos M., Lomen-Hoerth C., van Deerlin V. M., Grosskreutz J., Roediger A., Gaur N., Jörk A., Barthel T., Theele E., Ilse B., Stubendorff B., Witte O. W., Steinbach R., Hübner C. A., Graff C., Brylev L., Fominykh V., Demeshonok V., Ataulina A., Rogelj B., Koritnik B., Zidar J., Ravnik-Glavač M., Glavač D., Stević Z., Drory V., Povedano M., Blair I. P., Kiernan M. C., Benyamin B., Henderson R. D., Furlong S., Mathers S., McCombe P. A., Needham M., Ngo S. T., Nicholson G. A., Pamphlett R., Rowe D. B., Steyn F. J., Williams K. L., Mather K. A., Sachdev P. S., Henders A. K., Wallace L., de Carvalho M., Pinto S., Petri S., Weber M., Rouleau G. A., Silani V., Curtis C. J., Breen G., Glass J. D., Brown R. H., Landers J. E., Shaw C. E., Andersen P. M., Groen E. J. N., van Es M. A., Pasterkamp R. J., Fan D., Garton F. C., McRae A. F., Davey Smith G., Gaunt T. R., Eberle M. A., Mill J., McLaughlin R. L., Hardiman O., Kenna K. P., Wray N. R., Tsai E., Runz H., Franke L., Al-Chalabi A., Van Damme P., van den Berg L. H., Veldink J. H., Consortium S., Consortium P., Consortium S., Consortium S., Common and rare variant association analyses in amyotrophic lateral sclerosis identify 15 risk loci with distinct genetic architectures and neuron-specific biology. Nature Genetics 53, 1636–1648 (2021). - PMC - PubMed
    1. DeJesus-Hernandez M., Mackenzie I. R., Boeve B. F., Boxer A. L., Baker M., Rutherford N. J., Nicholson A. M., Finch N. A., Flynn H., Adamson J., Kouri N., Wojtas A., Sengdy P., Hsiung G. Y., Karydas A., Seeley W. W., Josephs K. A., Coppola G., Geschwind D. H., Wszolek Z. K., Feldman H., Knopman D. S., Petersen R. C., Miller B. L., Dickson D. W., Boylan K. B., Graff-Radford N. R., Rademakers R., Expanded GGGGCC hexanucleotide repeat in noncoding region of C9ORF72 causes chromosome 9p-linked FTD and ALS. Neuron 72, 245–256 (2011). - PMC - PubMed

Publication types

LinkOut - more resources