[Preprint]. 2024 Jun 24:2024.06.19.599752.
doi: 10.1101/2024.06.19.599752.

Suppression of astrocyte BMP signaling improves fragile X syndrome molecular signatures and functional deficits

Affiliations

Suppression of astrocyte BMP signaling improves fragile X syndrome molecular signatures and functional deficits

James Deng et al. bioRxiv. .

Abstract

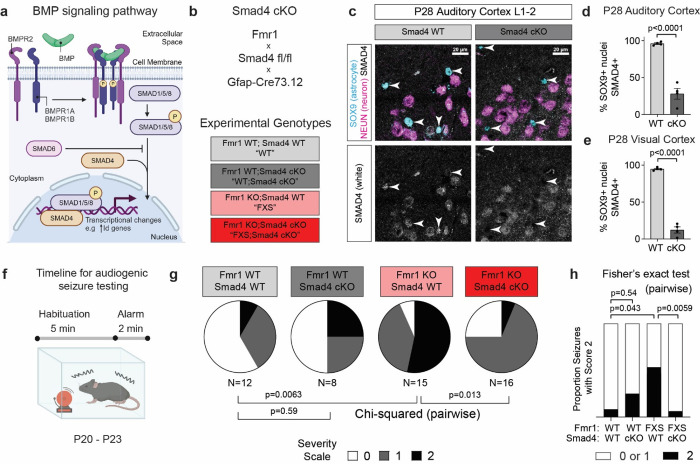
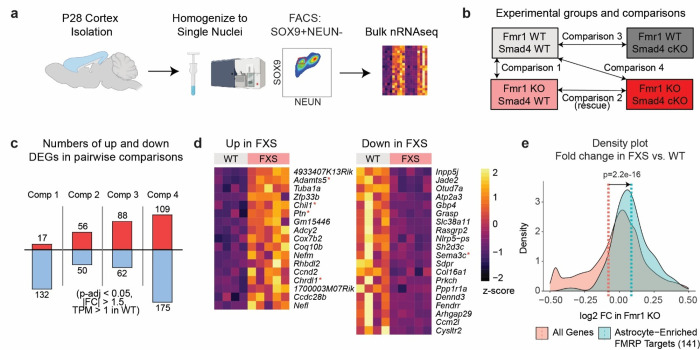
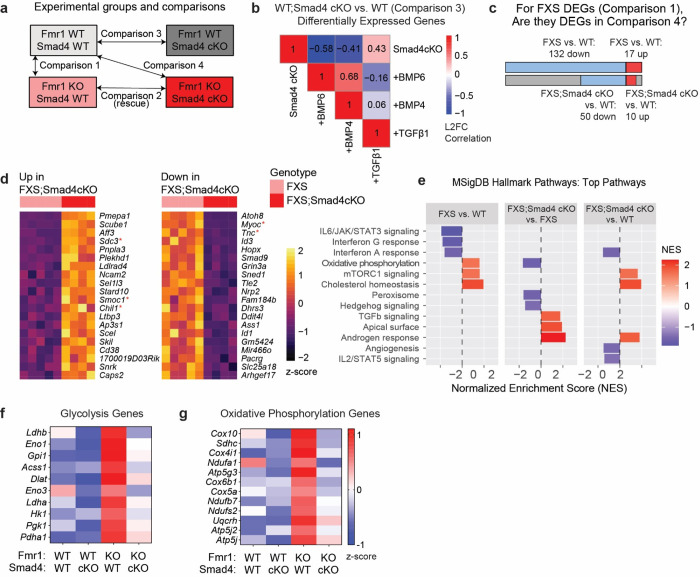
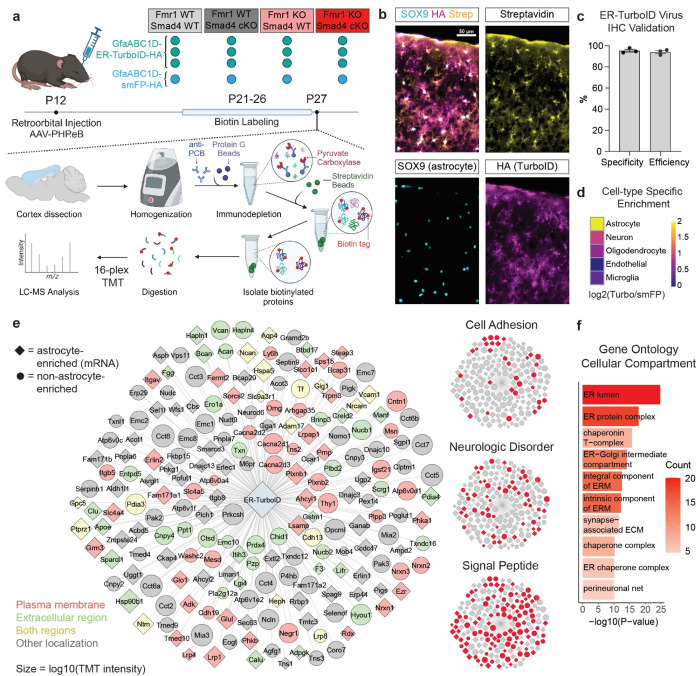
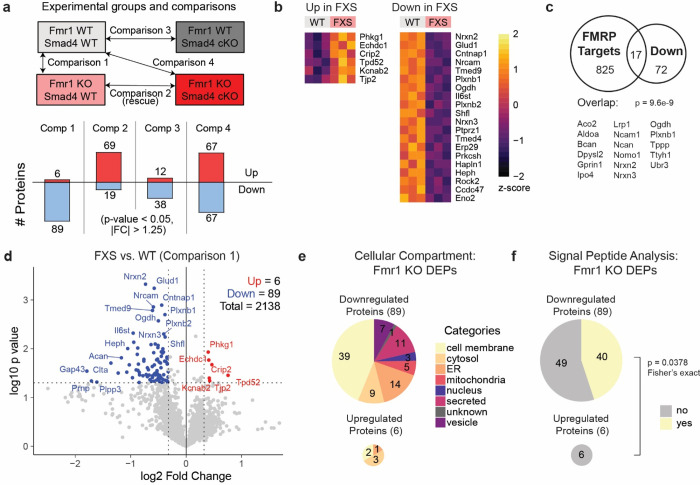
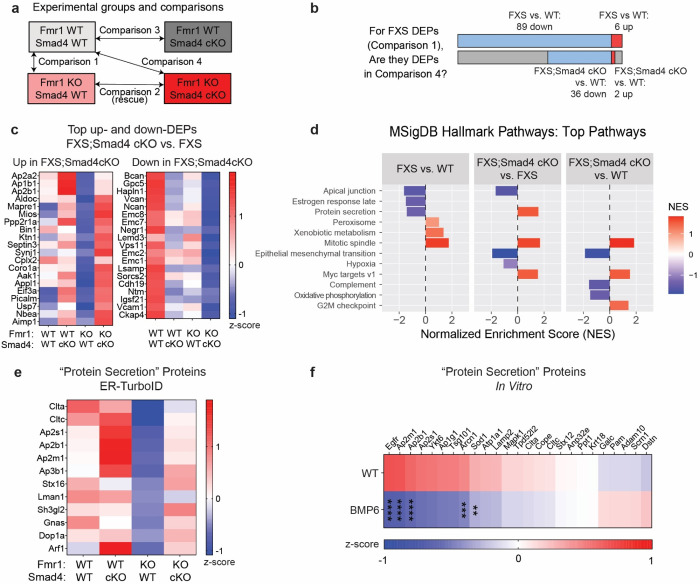
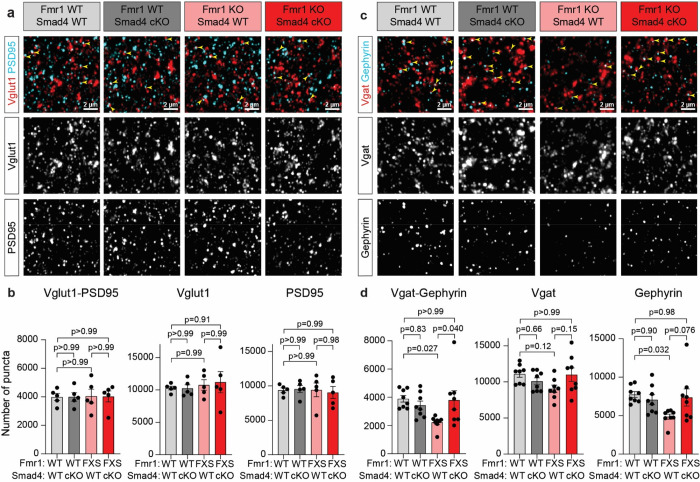
Fragile X syndrome (FXS) is a monogenic neurodevelopmental disorder with manifestations spanning molecular, neuroanatomical, and behavioral changes. Astrocytes contribute to FXS pathogenesis and show hundreds of dysregulated genes and proteins; targeting upstream pathways mediating astrocyte changes in FXS could therefore be a point of intervention. To address this, we focused on the bone morphogenetic protein (BMP) pathway, which is upregulated in FXS astrocytes. We generated a conditional KO (cKO) of Smad4 in astrocytes to suppress BMP signaling, and found this lessens audiogenic seizure severity in FXS mice. To ask how this occurs on a molecular level, we performed in vivo transcriptomic and proteomic profiling of cortical astrocytes, finding upregulation of metabolic pathways, and downregulation of secretory machinery and secreted proteins in FXS astrocytes, with these alterations no longer present when BMP signaling is suppressed. Functionally, astrocyte Smad4 cKO restores deficits in inhibitory synapses present in FXS auditory cortex. Thus, astrocytes contribute to FXS molecular and functional phenotypes, and targeting astrocytes can mitigate FXS symptoms.


Conflict of interest statement

Competing Interests The authors have no competing interests to declare.

Figures

Figure 1 |
Figure 1 |. Smad4 cKO suppresses astrocyte BMP signaling and reduces Fmr1 KO audiogenic seizure severity.
a. Schematic of the canonical BMP pathway. BMPs bind to BMPR, leading to phosphorylation of SMAD1/5/8; pSMAD forms a complex with SMAD4, which translocates to the nucleus and regulates transcription. b. Above, outline of mouse genetics strategy to achieve Smad4 conditional knock-out in astrocytes; below, experimental genotype groups. c. Smad4 cKO deletes Smad4 from astrocytes. Example images of L1 to L2 auditory cortex, immunohistochemistry for SMAD4, SOX9 (astrocyte nuclei), and NEUN (neuronal nuclei) at P28. White arrowheads indicate locations of SOX9+ astrocyte nuclei. d. Quantification across P28 auditory cortex, percentage of SOX9+ nuclei expressing SMAD4 higher than the parenchymal background. N = 4 mice/condition. Statistics by t-test. e. P28 visual cortex data, analyzed as in d. N = 4 mice/condition. Statistics by t-test. f. Timeline for audiogenic seizure testing at P20–23. g. Quantification of audiogenic seizure severity as follows: 0 = no observed seizure activity, 1 = progression to convulsions, 2 = progression to respiratory failure. N = 12 WT, 8 WT;Smad4 cKO, 15 FXS, 16 FXS;Smad4 cKO mice. Statistics by Chi-squared pairwise between groups, using counts in each of the three categories. Chi-squared for 4 groups: p = 0.0045. h. Smad4 cKO reduces respiratory failure from audiogenic seizures, same data as g. replotted. N = 12 WT, 8 WT;Smad4 cKO, 15 FXS, 16 FXS;Smad4 cKO mice. Pairwise statistics by Fisher’s exact test, using counts. Chi-squared for 4 groups: p = 0.0279.
Figure 2 |
Figure 2 |. Nuclear transcriptomics identifies Fmr1 KO and Smad4 cKO astrocyte in vivo transcriptomic dysregulation
a. Protocol for glyoxal-fixed astrocyte nuclei transcriptomics via FACS sorting for SOX9+NEUN− nuclei followed by bulk nRNAseq. b. Experimental groups and pairwise comparisons. c. Numbers of up- and down-DEGs for the transcriptomic experiment. N = 4 WT, 6 WT;Smad4 cKO, 5 FXS, 4 FXS;Smad4 cKO mice. Cutoffs p-adj < 0.05, |FC| > 1.5, TPM in WT > 1 calculated with DESeq2 with Benjamini-Hochberg (BH) correction. See also Supplementary Data Tables 1,2. d. Top significantly up- and downregulated genes in Fmr1 KO (Comparison 1). Genes filtered by |FC| > 1.5 and TPM in WT > 1, sorted by p-adj. Red asterisks indicate genes encoding known astrocyte-secreted proteins. e. Density plot of log2 fold change in Fmr1 KO (Comparison 1) for two gene sets: (1) all genes detected in nRNAseq, (2) FMRP targets (842 genes, Darnell et al. 2011), filtered to those enriched at an mRNA level in astrocytes (141 genes, Zhang et al. 2014). The average log2 fold changes for these gene sets are denoted with dashed lines. The two distributions are significantly different, statistics by z-test.
Figure 3 |
Figure 3 |. Smad4 cKO moderates Fmr1 KO astrocyte transcriptomic activation of metabolic pathways.
a. Pairwise comparisons and groups for the RNAseq experiment. b. Correlation matrix for L2FCs of the 150 in vivo RNAseq Smad4 cKO DEGs, between in vivo RNAseq of Smad4 cKO, WT astrocytes incubated with BMP6, and cultured astrocytes incubated with BMP4 or TGFβ1. c. For the 149 FXS DEGs (Comparison 1), the majority are no longer significantly changed in Comparison 4 (FXS;Smad4 cKO vs. WT). See Supplementary Data Table 2 for gene list. d. Top significantly up- and downregulated genes in FXS;Smad4 cKO compared to FXS (Comparison 2). Genes filtered by |FC| > 1.5 and TPM in WT > 1, sorted by p-adj. Red asterisks indicate genes encoding known astrocyte-secreted proteins. e. Top 3 significantly up- and down-regulated pathways by normalized enrichment score (NES), for each of the comparisons 1, 2, and 4; via gene set enrichment analysis on the MSigDB Hallmark Gene Sets with all genes TPM > 1 ranked by −log10(p-value) * sign(L2FC). See also Supplementary Data Table 3. f-g. Z-scores of genes in f. “glycolysis/gluconeogenesis” (KEGG M11521) and g. “oxidative phosphorylation” (MSigDB MM3893) gene sets, averaged within each genotype; displaying genes up in Fmr1 KO and lowered by Smad4 cKO. See Supplementary Fig. 5d,e for full gene sets.
Figure 4 |
Figure 4 |. Development of ER-targeted TurboID for in vivo astrocyte secreted and membrane proteomics.
a. Protocol for ER-TurboID proteomics. b. ER-TurboID biotinylates proteins in SOX9+ astrocytes. Immunohistochemistry imaged in visual cortex, for a mouse subjected to the protocol in a. with fixation instead of dissection for proteomics. HA tag on ER-TurboID construct colocalizes with streptavidin (biotinylation) in cells with SOX9+ nuclei. c. Quantification of b. Specificity quantified as (# SOX9+HA+ cells)/(# HA+ cells), efficiency quantified as (# SOX9+HA+ cells)/(# SOX9+ cells) for N = 3 mice. d. ER-TurboID enriches for known astrocyte proteins. Plotting log2 of average TurboID to average control TMT signal, averaged across known cell type-specific proteins (see Supplementary Fig. 8e for all proteins). e. Most highly enriched proteins in the ER-TurboID proteome (log2[Turbo/Control] > 2.38, 200 proteins). Node tile size represents log10 of average TMT signal for the protein across all experimental samples. Tile shape represents cell type: diamond = astrocyte (mRNA level higher in astrocytes compared to the average expression in other cell types), circle = other cell type or unknown. Tile color represents cellular compartment gene ontology annotation: green = extracellular region, red = plasma membrane, yellow = both extracellular region and plasma membrane, grey = other. Right, highlighting proteins in the functional category of cell adhesion (GO: 7155), with causative mutation linked to neurologic disorder, and with predicted signal peptide. f. Gene ontology overrepresentation analysis based on the 200 proteins in e., listing the top 10 cellular compartment categories by p-value.
Figure 5 |
Figure 5 |. ER-TurboID identifies dysregulated Fmr1 KO astrocyte secreted and membrane proteins.
a. Above, groups and comparisons for the proteomic experiment. N = 3 WT, 3 WT;Smad4 cKO, 3 FXS, 3 FXS;Smad4 cKO mice. Proteomics processed with 16-plex TMT, including one mouse per genotype injected with virus with plasmid expressing control protein. Below, number of up- and downregulated proteins for each of the 4 comparisons, cutoffs p < 0.05, |FC| > 1.25. See also Supplementary Data Tables 6,7. b. Top up- and downregulated proteins in Fmr1 KO (Comparison 1). Proteins sorted by p-value. c. Overlap of known FMRP targets with downregulated proteins in Fmr1 KO (Comparison 1). Statistics by Fisher’s exact test with genome size 24,252 protein-coding M. Musculus genes. d. Volcano plot for the Fmr1 KO vs WT comparison showing significantly up- and downregulated proteins. Dashed black lines at p = 0.05 and |FC| = 1.25. e. Cellular compartment and f. signal peptide analysis of DEPs from d., based on UniProt annotations.
Figure 6 |
Figure 6 |. Smad4 cKO restores Fmr1 KO astrocyte deficit in secretory machinery.
a. Groups and comparisons for the proteomic experiment. b. For the 95 FXS DEPs (Comparison 1), the majority are no longer significantly changed in Comparison 4 (FXS;Smad4 cKO vs. WT). See Supplementary Data Table 7 for protein list. c. Average z-scores by genotype of the top significantly up- and downregulated proteins in FXS;Smad4 cKO compared to FXS (Comparison 2). Proteins sorted by p-value. d. Top 3 up- and down-regulated pathways by normalized enrichment score (NES), for each of the comparisons 1, 2, and 4; via gene set enrichment analysis on the MSigDB Hallmark Gene Sets with all proteins Turbo/Control > 1.75 ranked by −log10(p-value) * sign(L2FC). See also Supplementary Data Table 8. e. Z-scores of proteins in the “protein secretion” gene set (MSigDB MM3876), averaged within each genotype; displaying proteins down in Fmr1 KO and increased by Smad4 cKO. See Supplementary Fig. 12 for full set. f. Protein secretion machinery is downregulated in the secretome of P7 WT astrocytes cultured with BMP6, data re-analyzed from Caldwell et al., 2022. Z-scores of all detected proteins in the “protein secretion” gene set (MSigDB MM3876), averaged within each genotype. Statistics as in Caldwell et al., 2022. ** denotes p < 0.01, *** denotes p < 0.001, **** denotes p < 0.0001.
Figure 7 |
Figure 7 |. Smad4 cKO rescues Fmr1 KO auditory cortex inhibitory synapse density deficit.
a. Example excitatory synaptic immunohistochemistry images from L2/3 auditory cortex at P28. Example colocalized Vglut1-PSD95 puncta indicated by yellow arrowheads. b. Quantification of a., N = 5 mice per genotype. Statistics by 2-way ANOVA with Tukey’s test for multiple comparisons. c. Example inhibitory synaptic immunohistochemistry images from L2/3 auditory cortex at P28. Example colocalized Vgat-Gephyrin puncta indicated by yellow arrowheads. d. Quantification of c., N = 8 mice per genotype. Statistics by 2-way ANOVA with Tukey’s test for multiple comparisons.

Similar articles

References

    1. Hagerman R. J. et al. Fragile X syndrome. Nat. Rev. Dis. Primer 3, (2017). - PubMed
    1. Genovese A. & Butler M. G. The Autism Spectrum: Behavioral, Psychiatric and Genetic Associations. Genes 14, 677 (2023). - PMC - PubMed
    1. He C. X. & Portera-Cailliau C. The trouble with spines in fragile X syndrome: density, maturity and plasticity. Neuroscience 251, 120–128 (2013). - PMC - PubMed
    1. Lachiewicz A. M. et al. Sensory Symptoms and Signs of Hyperarousal in Individuals with Fragile X Syndrome: Findings from the FORWARD Registry and Database Multisite Study. J. Autism Dev. Disord. (2023) doi:10.1007/s10803-023-06135-y. - DOI - PMC - PubMed
    1. Kazdoba T. M., Leach P. T., Silverman J. L. & Crawley J. N. Modeling fragile X syndrome in the Fmr1 knockout mouse. Intractable Rare Dis. Res. 3, 118–133 (2014). - PMC - PubMed

Publication types