[Preprint]. 2024 Jun 29:2024.06.28.601272.
doi: 10.1101/2024.06.28.601272.

PKA Activity-Driven Modulation of Bidirectional Long-Distance transport of Lysosomal vesicles During Synapse Maintenance

Affiliations

PKA Activity-Driven Modulation of Bidirectional Long-Distance transport of Lysosomal vesicles During Synapse Maintenance

Kerriann K Badal et al. bioRxiv. .

Abstract

The bidirectional long-distance transport of organelles is crucial for cell body-synapse communication. However, the mechanisms by which this transport is modulated for synapse formation, maintenance, and plasticity are not fully understood. Here, we demonstrate through quantitative analyses that maintaining sensory neuron-motor neuron synapses in the Aplysia gill-siphon withdrawal reflex is linked to a sustained reduction in the retrograde transport of lysosomal vesicles in sensory neurons. Interestingly, while mitochondrial transport in the anterograde direction increases within 12 hours of synapse formation, the reduction in lysosomal vesicle retrograde transport appears three days after synapse formation. Moreover, we find that formation of new synapses during learning induced by neuromodulatory neurotransmitter serotonin further reduces lysosomal vesicle transport within 24 hours, whereas mitochondrial transport increases in the anterograde direction within one hour of exposure. Pharmacological inhibition of several signaling pathways pinpoints PKA as a key regulator of retrograde transport of lysosomal vesicles during synapse maintenance. These results demonstrate that synapse formation leads to organelle-specific and direction specific enduring changes in long-distance transport, offering insights into the mechanisms underlying synapse maintenance and plasticity.

Keywords: Protein kinase A; Synapse formation; gene expression; long-distance transport; lysosome related organelles; mitochondria; plasticity; synapse maintenance.


Conflict of interest statement

CONFLICT OF INTEREST STATEMENT The authors declare no conflicts of interests.

Figures

Figure 1.
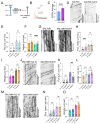
Figure 1.. Synapse maintenance produces a decrease in the long-distance bidirectional flux of transport of lysosomal vesicles
A. Experimental strategy for live imaging of organelle transport from SN and SNL7MN cultures after SNL7MN electrophysiology during synapse maintenance. B. Cartoon schematic live transport imaging in SN, sensory neuron; L11MN, L11 motor neuron; SNL11MN, SN co-cultured with L11MN; L7MN, L7 motor neuron; SN-L7MN, SN co-cultured with L7MN during synapse maintenance. C. Confocal DIC and grayscale of fluorescent LROs particles within SN axons are shown. The fluorescence images in boxes show examples of regions where transport was analyzed. Representative kymographs of time-lapse axonal LV transport. Scale bar, 10um. D. Bar graphs show the flux and velocity of anterograde and retrograde LV transport in SNs and SNL7MNs analyzed by kymograph. The number of neurons analyzed in the experiment is indicated in the bar graphs. Error bars show SEMs. NS, nonsignificant; *p < 0.05. Student’s unpaired two-tailed t-test. E. Bars graph shows the flux and velocity of anterograde (Ant) and retrograde (Ret) LV transport in SNs and SNL11MN measured by kymograph analysis. The numbers of neurons analyzed in the experiment are indicated in the bar graphs. Error bars show SEMs. NS, nonsignificant. Student’s unpaired two-tailed t-test. Also see supplementary table S1.
Figure 2.
Figure 2.. Dynamic changes in retrograde lysosomal vesicle transport during synapse formation and maturation
A. Cartoon schematic for imaging live LV transport in SN and SNL7MN during synapse formation and maturation. B. Timeline for SNL7MN in vitro cell-to-cell communication development. C, E, G, I. Representative kymographs of time-lapse axonal LROs transport at 6 (C), 12 (E), 24 (G), and 72 (I) hours, respectively. Scale bar, 10um. D, F, H, J. Bar graphs show the flux and velocity of anterograde and retrograde LV transport in SN and SNL7MN at 6 (D), 12 (F), 24 (H), and 72 (J) hours after plating analyzed by kymograph, respectively. The number of neurons analyzed in the experiment is indicated in the bar graphs. Error bars show SEMs. NS, nonsignificant; *p < 0.05. Student’s unpaired two-tailed t-test. Also see supplementary table S2.
Figure 3.
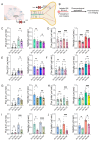
Figure 3.. LTF Temporally and differentially regulates lysosomal vesicle and mitochondrial Transport
A. Experimental design for electrophysiological recordings before and 24 hours after 5x5HT. B. Representative trace of SNL7MN (DIV 4-6) excitatory postsynaptic potentials (EPSPs) before (green) and after (red) 5x5HT in millivolts (mV); scale display 5mV along the y-axis and 0.5 seconds (s) in the x-axis. C. Bar graph shows average excitatory postsynaptic potentials (EPSPs) in millivolts (mV) of SNL7MN before (pre) and 24 hours after 5x5HT application. The number of neurons analyzed in the experiment is indicated in the bar graphs. Error bars show SEMs. ****p < 0.0001. Student’s paired t-test. D, G. Representative kymographs of time-lapse axonal (D) LV and (G) mitochondrial transport. E, F; H, I. Bar graphs show anterograde and retrograde LV flux (E) and velocity (F), and mitochondrial anterograde and retrograde flux (H) and velocity (I) before and 60 minutes after long-term facilitation induction (5X5HT) analyzed by kymograph. The number of neurons analyzed in the experiment is indicated in the bar graphs. Error bars show SEMs. NS, nonsignificant; ***p < 0.001. Student’s paired two-tailed t-test (flux). Student’s unpaired two-tailed t-test (velocity). J, M. Representative kymographs of time-lapse axonal LV (J) and mitochondrial (M) transport 24 hours after 5xL15 (control) or 5x5HT. K, L, N, O. Bar graphs show flux (K) and velocity (L) of anterograde and retrograde LV and flux (N) and velocity (O) of anterograde and retrograde mitochondrial transport 24 hours after 5xL15 (control) or 5x5HT application analyzed by kymograph. The number of neurons analyzed in the experiment is indicated in the bar graphs. Student’s unpaired two-tailed t-test. Error bars show SEMs. NS, nonsignificant; *p < 0.05, **p < 0.01.
Figure 4.
Figure 4.. Role of the postsynaptic neuron in modulating presynaptic transport of lysosomal vesicles during synapse maintenance
A. Cartoon of experimental design and predicted mechanism that reduced retrograde LRO transport. Mechanism 1 predicts that L7 postsynaptic cell body-generated signals regulate presynaptic retrograde (ret) LV. Mechanism 2 predicts that AMPA and NMDA receptor signaling regulates presynaptic retrograde (ret) LV transport B. Experimental design for postsynaptic soma removal experiments. C. Bar graphs show the flux and velocity of anterograde and retrograde LV transport with intact MN (CB) or with MN cell body removed (CBR) analyzed by kymograph. The numbers of neurons analyzed in the experiment are indicated in the bar graphs. Error bars show SEMs. NS, nonsignificant. Student’s unpaired two-tailed t-test. D. Experiment design for inhibiting glutamatergic receptor signaling. E, F. Bar graphs show the flux and velocity of anterograde and retrograde LROs transport before and after CNQX (E) or APV (F) treatment analyzed from kymographs. The number of neurons analyzed in the experiment is indicated in the bar graphs. Error bars show SEMs. NS, nonsignificant; **p < 0.01. Student’s paired t-test (CNQX Flux, APV Flux); Student’s unpaired two-tailed t-test (CNQX Velocity and APV Velocity). G. Cartoon of experimental design and predicted mechanism that Ca2+ signaling regulates retrograde LV transport. H, I. Bar graphs show flux and velocity of anterograde and retrograde LV (H) and mitochondrial (I) transport before and after BAPTA application analyzed from kymographs. The number of neurons analyzed in the experiment is indicated in the bar graphs. Student’s paired t-test. Error bars show SEMs. NS, nonsignificant; **p < 0.01, ***p < 0.001.
Figure 5.
Figure 5.. Effect of inhibition of protein degradation, mTOR signaling and autophagy on the bidirectional long distance transport in the absence of a synapse.
A. Pharmacological interventions to assess signaling pathways modulating retrograde transport of lysosomal vesicles. B. Experiment design. C-J. Bar graphs show flux and velocity of anterograde and retrograde lysosomal vesicle (C, E, G, I) and mitochondrial (D, F, H, J) transport in SNs before and after Lactacystin (Lac) (C, JD), Rapamycin (Rap) (E, F), Chloroquine (CQ) (G, H) and Bafilomycin (Baf) (I, J) treatments analyzed by kymograph. The number of neurons analyzed in the experiment is indicated in the bar graphs. Error bars show SEMs. NS, nonsignificant; *p < 0.05, **p < 0.01, ***p < 0.001. Student’s unpaired two-tailed t-test.
Figure 6.
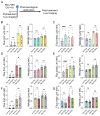
Figure 6.. Transport of lysosomal vesicles is regulated by autophagy
A. Experiment design of electrophysiological recordings before and 30 minutes (mins) after pharmacological application. B. Representative trace of SNL7MN (DIV 4-6) excitatory postsynaptic potentials (EPSPs) in SNL7MN before (brown) and after (purple) chloroquine (+CQ), in millivolts (mV); scale display mV along the y-axis and 0.1 seconds (s) in the x-axis. C. Bar graph shows average EPSPs in mV of SNL7MN before (pre) and 30 mins +CQ. The number of neurons analyzed in the experiment is indicated in the bar graphs. Error bars show SEMs. **p < 0.01. ***p < 0.001. Student’s paired t-test. D. Cartoon of possible mechanism modulate retrograde LV transport. E. Experiment design. F-I. Bar graphs show the flux and velocity of anterograde and retrograde LV (F, H) and mitochondrial (G, I) transport in SNL7MNs before and after Chloroquine (CQ) (F, G) and bafilomycin (H, I) treatment analyzed by kymograph. The number of neurons analyzed in the experiment is indicated in the bar graphs. Error bars show SEMs. NS, nonsignificant; *p < 0.05, **p < 0.01, ***p < 0.001, ****p < 0.0001. Student’s unpaired two-tailed t-test.
Figure 7.
Figure 7.. Assessing the role of ER-golgi transport and effect of DHA on long-distance bidirectional transport of mitochondria and lysosomal vesicles.
A. Cartoon of experimental design. B-C. Bar graphs show the flux and velocity of anterograde and retrograde LV (B) and mitochondrial (C) transport in SNs before and after Brefeldin A (BFA) treatment analyzed by kymograph. The number of neurons analyzed in the experiment is indicated in the bar graphs. Error bars show SEMs. NS, nonsignificant; **p < 0.01, ***p < 0.001. Student’s unpaired two-tailed t-test. D-E. Bar graphs show flux and velocity of anterograde and retrograde LV (D) and mitochondrial (E) transport in SNs before and after 3-hour Docosahexaenoic acid (DHA) treatment analyzed by kymograph. The number of neurons analyzed in the experiment is indicated in the bar graphs. Error bars show SEMs. NS, nonsignificant; **p < 0.01, ***p < 0.001. Student’s unpaired two-tailed t-test. F-G. Bar graphs show the flux and velocity of anterograde and retrograde LV (F) and mitochondrial (G) transport in SNs treated with DHA or DMSO (control) for 24 hours analyzed by kymograph. The number of neurons analyzed in the experiment is indicated in the bar graphs. Error bars show SEMs. NS, nonsignificant. Student’s unpaired two-tailed t-test.
Figure 8.
Figure 8.. PKA signaling modulates transport of lysosomal vesicles during synapse maintenance
A. Experiment design of electrophysiological recordings before and 30 minutes (mins) after pharmacological application. B. Representative trace of SNL7MN (DIV 4-6) excitatory postsynaptic potentials (EPSPs) before (pink) and after (purple) 14-22 amide (+PKAi) in millivolts (mV); scale display 1mV along the y-axis and 0.1 seconds (s) in the x-axis. C. Bar graph shows average EPSPs in mV of SNL7MN before (pre) and 30 mins after +PKAi application. The number of neurons analyzed in the experiment is indicated in the bar graphs. Error bars show SEMs. ***p < 0.001. Student’s paired t-test. D. Experiment design. E-F. Bar graphs show the flux and velocity of retrograde lysosomal vesicle (E) and bidirectional mitochondrial (F) transport before and after PKA inhibition with 14-22 amide (PKAi) analyzed from kymographs, respectively. The number of neurons analyzed in the experiment is indicated in the bar graphs. Student’s paired t-test (lysosomal vesicle flux, mitochondrial flux); Student’s unpaired two-tailed t-test (lysosomal vesicle velocity, mitochondrial velocity). G. Experimental schematics for the preparation and analysis of golgi enriched fractions following long-term sensitization training. H. Representative western blots for phospho PKA (Thr197) and total PKA and quantitation in total cell homogenates and golgi fractions are shown. N= 24 animals for each condition, Student’s unpaired two-tailed t-test, Error bars show SEMs. NS, nonsignificant; *p < 0.05, **p < 0.01, ***p < 0.001, ****p < 0.0001.
Figure 9:
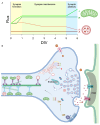
Figure 9:. Working model for modulation transport of lysosomal vesicles during synapse maintenance
A. Modulation of flux of the bidirectional long-distance transport of mitochondrial and lysosomal vesicles during synapse formation, maintenance, and plasticity. Line drawings indicate changes in transport flux and are based on the measurements described in this manuscript. A: Anterograde, R: Retrograde. Cartoon for organelles are shown. B. Proposed model for the reduction in the retrograde transport of lysosomal vesicles during synapse maintenance. Compartmentalization of PKA activity might underlie modulation of mitochondrial and LV transport. Enhancements in PKA activity in the cytoplasm is required for mitochondrial transport. Based on our biochemical experiments, reduction in the activity of PKA in the golgi compartment leads to reduction in LVs. “?” indicates that additional experiments are required to confirm the biochemical findings at a single neuron level.

Similar articles

References

    1. Azpurua J., Eaton B. A., Neuronal epigenetics and the aging synapse. Frontiers in cellular neuroscience 9, 208 (2015). - PMC - PubMed
    1. Badal K., Zhao Y., Miller K. E., Puthanveettil S. V., Live Imaging and Quantitative Analysis of Organelle Transport in Sensory Neurons of Aplysia Californica. Methods Mol Biol 2431, 23–48 (2022). - PubMed
    1. Badal K. K. et al. Synapse formation activates a transcriptional program for persistent enhancement in the bi-directional transport of mitochondria. Cell reports 26, 507–517. e503 (2019). - PMC - PubMed
    1. Bailey C. H., Kandel E. R., Harris K. M., Structural Components of Synaptic Plasticity and Memory Consolidation. Cold Spring Harb Perspect Biol 7, a021758 (2015). - PMC - PubMed
    1. Bapat O. et al. VAP spatially stabilizes dendritic mitochondria to locally support synaptic plasticity. Nat Commun 15, 205 (2024). - PMC - PubMed

Publication types

LinkOut - more resources