. 2024 Aug 14;15(8):e0174624.
doi: 10.1128/mbio.01746-24. Epub 2024 Jul 9.

Immunological correlates of protection mediated by a whole organism, Cryptococcus neoformans, vaccine deficient in chitosan

Affiliations

Immunological correlates of protection mediated by a whole organism, Cryptococcus neoformans, vaccine deficient in chitosan

Charles A Specht et al. mBio. .

Abstract

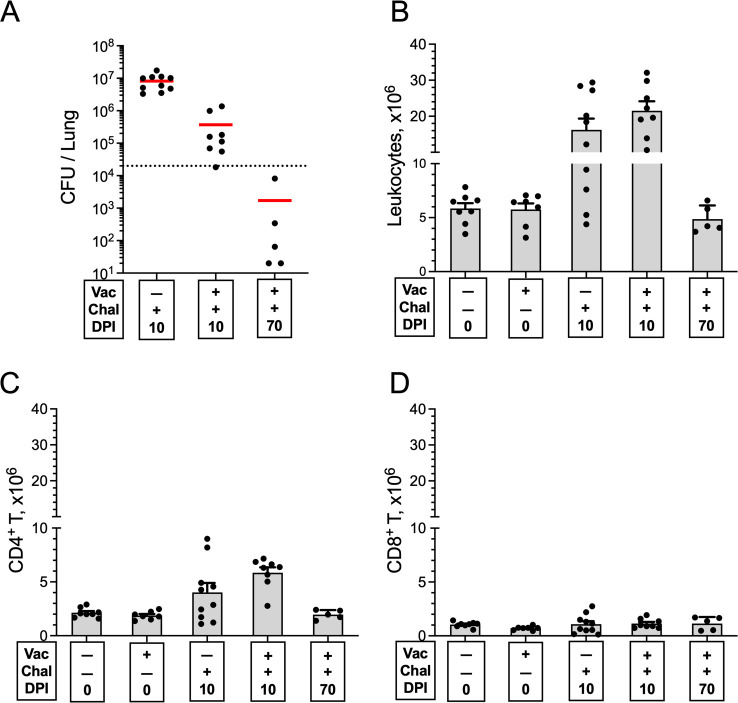
The global burden of infections due to the pathogenic fungus Cryptococcus is substantial in persons with low CD4+ T-cell counts. Previously, we deleted three chitin deacetylase genes from Cryptococcus neoformans to create a chitosan-deficient, avirulent strain, designated as cda1∆2∆3∆, which, when used as a vaccine, protected mice from challenge with virulent C. neoformans strain KN99. Here, we explored the immunological basis for protection. Vaccine-mediated protection was maintained in mice lacking B cells or CD8+ T cells. In contrast, protection was lost in mice lacking α/β T cells or CD4+ T cells. Moreover, CD4+ T cells from vaccinated mice conferred protection upon adoptive transfer to naive mice. Importantly, while monoclonal antibody-mediated depletion of CD4+ T cells just prior to vaccination resulted in complete loss of protection, significant protection was retained in mice depleted of CD4+ T cells after vaccination but prior to challenge. Vaccine-mediated protection was lost in mice genetically deficient in interferon-γ (IFNγ), tumor necrosis factor alpha (TNFα), or interleukin (IL)-23p19. A robust influx of leukocytes and IFNγ- and TNFα-expressing CD4+ T cells was seen in the lungs of vaccinated and challenged mice. Finally, a higher level of IFNγ production by lung cells stimulated ex vivo correlated with lower fungal burden in the lungs. Thus, while B cells and CD8+ T cells are dispensable, IFNγ and CD4+ T cells have overlapping roles in generating protective immunity prior to cda1∆2∆3∆ vaccination. However, once vaccinated, protection becomes less dependent on CD4+ T cells, suggesting a strategy for vaccinating HIV+ persons prior to loss of CD4+ T cells.

Importance: The fungus Cryptococcus neoformans is responsible for >100,000 deaths annually, mostly in persons with impaired CD4+ T-cell function such as AIDS. There are no approved human vaccines. We previously created a genetically engineered avirulent strain of C. neoformans, designated as cda1∆2∆3∆. When used as a vaccine, cda1∆2∆3∆ protects mice against a subsequent challenge with a virulent C. neoformans strain. Here, we defined components of the immune system responsible for vaccine-mediated protection. We found that while B cells and CD8+ T cells were dispensible, protection was lost in mice genetically deficient in CD4+ T cells and the cytokines IFNγ, TNFα, or IL-23. A robust influx of cytokine-producing CD4+ T cells was seen in the lungs of vaccinated mice following infection. Importantly, protection was retained in mice depleted of CD4+ T cells following vaccination, suggesting a strategy to protect persons who are at risk of future CD4+ T-cell dysfunction.

Keywords: AIDS; Cryptococcus neoformans; T cells; live vector vaccines; mycology.


Conflict of interest statement

The authors declare no conflict of interest.

Figures

Fig 1
Fig 1
The kinetics of pulmonary clearance of cda1∆2∆3∆ in multiple mouse strains. CBA/J (A), BALB/c (B), C57BL/6 (C), and NSG (D) mice were infected orotracheally with 1 × 10⁷ CFU of live cda1∆2∆3∆ strain. At designated days post infection, CFUs in the lungs were determined. Infected mice had n = 4–6 mice per time point. Each circle represents CFUs in an individual mouse. Red horizontal bars denote mean values. Dotted lines at 20 CFU indicate the detection limit for CFU quantification. The inoculum is represented by the open circle at day 0.
Fig 2
Fig 2
Contribution of B cells and antibody to protection following cda1∆2∆3∆ vaccination. (A) Protocol for experiments with wild-type (WT) BALB/c and JHD mice. Mice were given orotracheal (OT) vaccination with 1 × 10⁷ CFU live cda1∆2∆3∆ and challenge with 2 × 10⁴ CFU KN99. (B) Survival rates of vaccinated (Vac) and unvaccinated (UnVac) WT BALB/c and B cell-deficient JHD mice were compared. (C) CFUs in the lungs of mice which survived to 70 DPI were determined. (D) Protocol for experiments with WT C57BL/6 and muMT mice as in panel A, except the mice were also given two subcutaneous boosts of 2 × 10⁶ CFU live cda1∆2∆3∆. (E) Survival rates of Vac and UnVac wild-type C57BL/6 and muMT mice were compared. (F) CFUs in the lungs of mice which survived to 70 DPI were determined. Kaplan-Meier survival curves were compared using the Mantel-Cox log-rank test. For each strain of mice, P < 0.001 comparing vaccinated with unvaccinated mice. Data are from ≥2 independent experiments. The number (n) of mice per group is indicated in the figure inset. For CFU, each circle represents the CFU of an individual mouse. Red horizontal bars denote geometric mean values. Dotted lines indicate the KN99 challenge dose.
Fig 3
Fig 3
Contribution of CD8+ T cells to protection mediated by vaccination with cda1∆2∆3∆. (A) Wild-type (WT) C57BL/6 mice and α/β T cell-deficient [T-cell receptor beta (TCRβ)] mutant mice on the C57BL/6 background were given an OT vaccination (1 × 10⁷ CFU) and two biweekly subcutaneous (SQ) boosts (2 × 10⁶ CFU each) with cda1∆2∆3∆. Two weeks after the second SQ boost, mice were challenged with 1 × 10⁴ CFU KN99 and followed for 70 days for survival. (B) As in panel A except CD8+ T cell-deficient (β2m) mice were compared to WT mice. (C) Protocol for vaccinations with cda1∆2∆3∆ and intraperitoneal injections of CD8+ T cell-depleting mAb 2.43 to C57BL/6 mice during the vaccination (Vac) phase. Mice were challenged (Chal) with 1 × 10⁴ CFU KN99 and followed for 70 days for survival. (D) Survival curves of C57BL/6 mice treated according to the protocol in panel C. (E) As in panel C except the CD8+ T cell-depleting mAb YTS 169.4 was administered biweekly to CBA/J mice during both the Vac and Chal phases, and the inoculum was 5 × 10⁴ CFU KN99. (F) Survival curves of CBA/J mice treated according to the protocol in panel E. Statistics by Mantel-Cox log rank test. Data are from ≥2 independent experiments. The number (n) of mice per group is indicated in the figure inset. UnVac, unvaccinated. Depl, depleted.
Fig 4
Fig 4
Contribution of CD4+ T cells to protection afforded by cda1∆2∆3∆ vaccination. (A) Vaccinated wild-type C57BL/6 (WT) and CD4+ T cell-deficient (MHCII) mice were given three biweekly vaccinations (OT followed by two SQ boosts) with cda1∆2∆3∆. Two weeks after the last boost, mice were challenged with 1 × 10⁴ CFU KN99. (B–D) Survival of vaccinated C57BL/6 (B), CBA/J (C), and BALB/c (D) mice following three biweekly injections of CD4+ T cell-depleting mAb GK1.5 during the vaccinated (Depl, Vac) phase or challenged (Depl, Chal) phase. (E) Intravenous transfer of total T cells or CD4+ T cells purified from spleens of BALB/c mice vaccinated with cda1∆2∆3∆ to naïve BALB/c mice followed by challenge with KN99. At 70 DPI, surviving mice were euthanized, and lung CFUs of each mouse were determined. For CFU, each circle represents the CFU of an individual mouse. Red horizontal bars denote geometric mean values. The dotted line at 2 × 10⁴ indicates the KN99 challenge dose. Statistics by Mantel-Cox log rank test. Data are from ≥2 independent experiments. The number (n) of mice per group is indicated in the figure inset. UnVac, unvaccinated.
Fig 5
Fig 5
Contribution of selected cytokines to cda1∆2∆3∆ vaccine-mediated protection. Survival rates of vaccinated (Vac) and unvaccinated (UnVac) wild-type (WT) C57BL/6 mice were compared with that of mice deficient in (A) IFNγ, (B) IFNγR, (C) TNFα, and (D) IL-23p19 following an OT challenge with KN99. Statistics by Mantel-Cox log rank test. Data are from ≥2 independent experiments. The number (n) of mice per group is indicated in the figure inset.
Fig 6
Fig 6
Quantitation of lung CFUs, leukocytes, and CD4+ and CD8+ T cells following vaccination and/or infection. BALB/c mice were vaccinated orotracheally with live cda1∆2∆3∆. Six weeks later, the mice were given a pulmonary challenge with KN99. Mice were euthanized at 0 (uninfected), 10, or 70 DPI. Controls included unvaccinated mice euthanized at 0 or 10 DPI. Lungs were harvested and single-cell suspensions were prepared. (A) CFUs per lung were determined. The horizontal bar represents the median CFUs. The dotted line depicts the challenge inoculum. (B) Leukocytes were purified on a Percoll gradient and counted. (C and D) The numbers of CD4+ and CD8+ T cells were calculated by multiplying the percentage of each population, as determined by FACS, times the total leukocyte count. Data are from two independent experiments, each with four to six mice/group (except for the 70-DPI group, which had two to three mice/group). The data are presented as mean ± SEM. Statistical comparisons between groups are shown in Table S1. Chal, challenged with C. neoformans KN99; DPI, days post infection; Vac, vaccinated.
Fig 7
Fig 7
Ex vivo antigen-stimulated CD4+ T-cell activation and intracellular cytokine production following vaccination and/or infection. Lung leukocytes from the experiment shown in Fig. 6 were left unstimulated (Unstim) or stimulated with Staphylococcus enterotoxin B (SEB), HK KN99, or HK cda1∆2∆3∆ for 18 h in complete media supplemented with 0.5-µg/mL amphotericin B. Brefeldin A was added during the last 4 h of culture. The cells were then stained and analyzed by polychromatic FACS. The numbers of CD4+ T cells expressing the activation marker CD154 (A) or producing the intracellular cytokines IFNγ (B), TNFα (C) and IL17A (D) following ex vivo stimulation are shown. Data are from two independent experiments, each with four to six mice/group. Data are presented as mean ± SEM. Statistical comparisons between groups are shown in Table S2. Chal, challenged with C. neoformans KN99; DPI, days post infection; Vac, vaccinated.
Fig 8
Fig 8
IFNγ production by ex vivo stimulated lung leukocytes following vaccination and/or infection. (A) Lung leukocytes were purified from vaccinated and/or infected mice and stimulated ex vivo for 18 h using the same mice and protocol as in Fig. 7. Supernatants were collected and analyzed for IFNγ by enzyme-linked immunosorbent assay. Data are means ± SEM. Statistical comparisons between groups are shown in Table S3. (B) Correlation between lung CFUs (see Fig. 6A) and lung leukocytes’ IFNγ levels following HK KN99 stimulation in individual mice at 10 DPI. Data were analyzed with simple linear regression and are presented with best-fit line and confidence bands. Pearson correlation was used for statistical analysis. Data are from two independent experiments, each with four to six mice/group. Chal, challenged with C. neoformans KN99; DPI, days post infection; UnVac, unvaccinated; Vac, vaccinated.

Update of

References

    1. Denning DW. 2024. Global incidence and mortality of severe fungal disease. Lancet Infect Dis 24:e428–e438. doi:10.1016/S1473-3099(23)00692-8 - DOI - PubMed
    1. Rajasingham R, Govender NP, Jordan A, Loyse A, Shroufi A, Denning DW, Meya DB, Chiller TM, Boulware DR. 2022. The global burden of HIV-associated cryptococcal infection in adults in 2020: a modelling analysis. Lancet Infect Dis 22:1748–1755. doi:10.1016/S1473-3099(22)00499-6 - DOI - PMC - PubMed
    1. Singh N, Dromer F, Perfect JR, Lortholary O. 2008. Cryptococcosis in solid organ transplant recipients: current state of the science. Clin Infect Dis 47:1321–1327. doi:10.1086/592690 - DOI - PMC - PubMed
    1. Byrnes EJ, Li W, Lewit Y, Ma H, Voelz K, Ren P, Carter DA, Chaturvedi V, Bildfell RJ, May RC, Heitman J. 2010. Emergence and pathogenicity of highly virulent Cryptococcus gattii genotypes in the northwest United States. PLoS Pathog 6:e1000850. doi:10.1371/journal.ppat.1000850 - DOI - PMC - PubMed
    1. Brown GD, Denning DW, Gow NAR, Levitz SM, Netea MG, White TC. 2012. Hidden killers: human fungal infections. Sci Transl Med 4:165rv13. doi:10.1126/scitranslmed.3004404 - DOI - PubMed

MeSH terms

LinkOut - more resources