. 2024 Sep 6;23(9):3791-3805.
doi: 10.1021/acs.jproteome.4c00099. Epub 2024 Jul 9.

The Spatial Extracellular Proteomic Tumor Microenvironment Distinguishes Molecular Subtypes of Hepatocellular Carcinoma

Affiliations

The Spatial Extracellular Proteomic Tumor Microenvironment Distinguishes Molecular Subtypes of Hepatocellular Carcinoma

Jade K Macdonald et al. J Proteome Res. .

Abstract

Hepatocellular carcinoma (HCC) mortality rates continue to increase faster than those of other cancer types due to high heterogeneity, which limits diagnosis and treatment. Pathological and molecular subtyping have identified that HCC tumors with poor outcomes are characterized by intratumoral collagenous accumulation. However, the translational and post-translational regulation of tumor collagen, which is critical to the outcome, remains largely unknown. Here, we investigate the spatial extracellular proteome to understand the differences associated with HCC tumors defined by Hoshida transcriptomic subtypes of poor outcome (Subtype 1; S1; n = 12) and better outcome (Subtype 3; S3; n = 24) that show differential stroma-regulated pathways. Collagen-targeted mass spectrometry imaging (MSI) with the same-tissue reference libraries, built from untargeted and targeted LC-MS/MS was used to spatially define the extracellular microenvironment from clinically-characterized, formalin-fixed, paraffin-embedded tissue sections. Collagen α-1(I) chain domains for discoidin-domain receptor and integrin binding showed distinctive spatial distribution within the tumor microenvironment. Hydroxylated proline (HYP)-containing peptides from the triple helical regions of fibrillar collagens distinguished S1 from S3 tumors. Exploratory machine learning on multiple peptides extracted from the tumor regions could distinguish S1 and S3 tumors (with an area under the receiver operating curve of ≥0.98; 95% confidence intervals between 0.976 and 1.00; and accuracies above 94%). An overall finding was that the extracellular microenvironment has a high potential to predict clinically relevant outcomes in HCC.

Keywords: cancer; collagen; extracellular matrix; hepatocellular carcinoma; mass spectrometry imaging; microenvironment; post-translational modification; proline hydroxylation; proteomics.


Conflict of interest statement

The authors declare the following competing financial interest(s): PMA serves as Advisory for GlycoPath and is shareholder for GlycoPath and N-zyme Scientifics. RRD serves as Advisory for GlycoPath and is shareholder for GlycoPath and N-zyme Scientifics. ASM serves as Advisory for GlycoPath, GlycoTest and is shareholder for GlycoPath, GlycoTest and N-zyme Scientifics. YH serves as Advisory for Helio Genomics, Alentis Therapeutics, Espervita Therapeutics, Roche Diagnostics, Elevar Therapeutics and is shareholder in Alentis Therapeutics, Espervita Therapeutics.

Figures

Figure 1
Figure 1
Spatial analysis of the proteomic extracellular microenvironment in hepatocellular carcinoma by subtype. (A) Hematoxylin and eosin stain summary from patient tissue section cohort with pathological annotations showing features of normal (black), fibrosis (blue), cirrhosis (purple), tumor (red), and necrosis (green). (B) Workflow summary used to analyze the tissues. Following spatial imaging to produce peptides from extracellular matrix proteins, a representative subset was analyzed by sequencing proteomics. (C) Examples of imaging segmentation results. Heuristic segmentation clustered pixels by individual spectra using the bisecting k-means method and Manhattan metric. Different colors represent different proteome regions. Segmentation clusters show the relationship between regions with the number of spectra that define each region. (D)–(F) Examples of single peptide sequences from fibrillar collagens showing spatial localization corresponding to tissue pathologies. Red on the intensity scale indicates regions of highest intensity, and blue indicates regions of lower intensity. AA – amino acid position.
Figure 2
Figure 2
Collagen domains for discoidin domain receptor and integrin binding are spatially localized. (A) Hematoxylin and eosin staining of tumor sections. Tumors are outlined in red. (B) DDR-binding domain spatial distribution. The expression is diffuse through the whole tissue and appears within the tumor and within bridging fibrosis. (C) Integrin-αβ-binding domain expression is diffuse in S3 and localized largely to the region around the tumor in S3. (D) Combined ion images for DDR- and integrin-αβ-binding domains show complementary spatial patterns. DDR-binding domain intensity is green, and the integrin-binding domain intensity is pink. (E) DDR-binding expression across the whole tissue (left) or extracted from tumor regions (right). (F) Integrin-αβ-binding domain expression levels across the entire tissue or within the tumor. There was no significant difference in S1 versus S3 when comparing across the entire cohort. The Mann–Whitney Up-value is shown. Outlier tests reported no outliers.
Figure 3
Figure 3
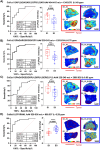
Fibrinogen peptides are spatially distributed throughout S1 tumors but not in S3 tumors. (A) Comparison of LC-MS/MS sampling of extracellular matrix composition. Counts of peptides mapped to fibrillar collagens (blue), fibrinogen (red), other collagens (dark gray), or other extracellular proteins (light gray) are presented in each pie chart from S1 (red, top) or S3 (blue, bottom) tissues. Additional pie charts depict the distribution of peptide counts for fibrillar collagens (top, blue) and fibrinogen proteins (bottom, red). (B) Box plots of peak intensity extracted from tumor regions and receiver operating characteristic (ROC) curves of fibrinogen beta peptide (m/z = 1767.924) and (C) fibrinogen alpha peptide (m/z = 1942.899). Mann–Whitney Up-values are shown. (D) Examples of hematoxylin and eosin staining with tumor annotations shown in red. (E) Spatial distribution of fibrinogen beta peptide (m/z = 1767.924) shown throughout S1 tumors while appearing around the borders of S3 tumors. (F) Spatial distribution of fibrinogen alpha peptide (m/z = 1942.899) within S1 tumors and around the borders and bridging fibrosis in S3 tumors. Red indicates high peptide intensity, while blue indicates low peptide intensity. (G) Combined ion image overlay of FGB peptide (P1767, pink) and FGA peptide (P1942, green).
Figure 4
Figure 4
Evaluation of tumor fibrillar collagen domains contributing to outcomes. (A) Image data analysis workflow. Peptides represented are those with highly confident identifications based on mass accuracy by sequencing analysis of the same tissue. (B) Heatmap of all unmodified peptides by mass-to-charge. (C) Heatmap of collagen hydroxyproline (HYP)-modified peptides by mass-to-charge. (D) Principal component analysis of unmodified peptides only demonstrates little separation by HCC subtype. (E) Principal component analysis of HYP peptides shows clear separation by HCC subtype. (F) Summary of unmodified and HYP-modified peptide intensity from all matched Col1a1 peptides extracted from tumors. Col1a1 demonstrates significant differences in unmodified versus modified S3 tumors. G) Summary of unmodified and HYP-modified peptides from all matched Col1a2 peptides extracted from tumors. Col1a2 demonstrates significant differences in unmodified versus modified for S3 tumors. (H) Lower levels of unmodified Col3a1 peptides were detected from S1 and S3 tumors compared to HYP-modified peptide levels. S1 tumors showed higher levels of HYP-modified Col3a1 peptides when compared to S3 tumors. (I) Hematoxylin and eosin staining of example tumors. Data were extracted for quantification from tumor regions outlined in red. (J) Example HYP-modified Col1a1 peptide (m/z = 1122.554). Intensity is elevated in S1 tumors when compared to S3 tumors. Expression expands throughout the tissue, appearing within S3 bridging fibrosis with a high intensity. (K) Example HYP-modified Col1a2 peptide (m/z = 1398.722) with low S3 tumor expression and appearing within intratumor fibrosis of S3 tumors. (L) Example Col3a1 peptide with overall decreased expression in S3 tissues and higher levels within S1 tumors. Exact p-values are from the Mann–Whitney U test.
Figure 5
Figure 5
Example peptides distinguishing S1 and S3 tumors include collagen-type differences and post-translational modifications of hydroxylated proline. ( A) Example Col1a1 peptide with 3/3 of prolines hydroxylated. This peptide is from the triple helical domain region of amino acids 404–415. (B) Example Col1a2 with 2/2 unmodified prolines and differentiating between S1 and S3. Expression is mapped to intratumor fibrosis (S1) and bridging fibrosis (S3). (C) Example Col3a1 peptide with 3/4 prolines hydroxylated. Spatial expression is detected in S1 tumors and decreased in S3 tumors. (D) Peptide domain from Col6a3 with no modifications and no prolines. Expression is overall absent within the S1 tumor microenvironment and detected within the S3 tumor microenvironment and bridging fibrosis. The p-values for AUC of representative peptides were produced using the Wilson/Brown method. Mann–Whitney Up-values are reported. AA – amino acid; ppm – parts per million.
Figure 6
Figure 6
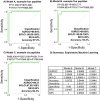
Exploratory machine learning analysis. (A)–(C) Random forest machine learning algorithms were used to explore combinations of 4, 5, or 6 peptides from imaging data for potential predictive value of subtypes. (D) Summary of figure of merit for each peptide combination. AUROC = area under the receiver operating curve; SE = standard error; 95% CI– 95% confidence interval, PPV – positive predictive value, NPV – negative predictive value. Peptides are listed by the m/z value.

References

    1. Yang J. D.; Hainaut P.; Gores G. J.; Amadou A.; Plymoth A.; Roberts L. R. A global view of hepatocellular carcinoma: trends, risk, prevention and management. Nat. Rev. Gastroenterol. Hepatol. 2019, 16 (10), 589–604. 10.1038/s41575-019-0186-y. - DOI - PMC - PubMed
    1. El-Serag H. B.; Rudolph K. L. Hepatocellular carcinoma: epidemiology and molecular carcinogenesis. Gastroenterology 2007, 132 (7), 2557–2576. 10.1053/j.gastro.2007.04.061. - DOI - PubMed
    1. Siegel R. L.; Giaquinto A. N.; Jemal A. Cancer statistics, 2024. Ca-Cancer J. Clin 2024, 74 (1), 12–49. 10.3322/caac.21820. - DOI - PubMed
    1. Altekruse S. F.; McGlynn K. A.; Reichman M. E. Hepatocellular carcinoma incidence, mortality, and survival trends in the United States from 1975 to 2005. J. Clin. Oncol. 2009, 27 (9), 1485–1491. 10.1200/JCO.2008.20.7753. - DOI - PMC - PubMed
    1. Tang A.; Hallouch O.; Chernyak V.; Kamaya A.; Sirlin C. B. Epidemiology of hepatocellular carcinoma: target population for surveillance and diagnosis. Abdom Radiol. 2018, 43 (1), 13–25. 10.1007/s00261-017-1209-1. - DOI - PubMed

Publication types

MeSH terms