. 2024 Jul 9;134(16):e153097.
doi: 10.1172/JCI153097.

De novo monoallelic Reelin missense variants cause dominant neuronal migration disorders via a dominant-negative mechanism

Affiliations

De novo monoallelic Reelin missense variants cause dominant neuronal migration disorders via a dominant-negative mechanism

Martina Riva et al. J Clin Invest. .

Abstract

Reelin (RELN) is a secreted glycoprotein essential for cerebral cortex development. In humans, recessive RELN variants cause cortical and cerebellar malformations, while heterozygous variants were associated with epilepsy, autism, and mild cortical abnormalities. However, the functional effects of RELN variants remain unknown. We identified inherited and de novo RELN missense variants in heterozygous patients with neuronal migration disorders (NMDs) as diverse as pachygyria and polymicrogyria. We investigated in culture and in the developing mouse cerebral cortex how different variants impacted RELN function. Polymicrogyria-associated variants behaved as gain-of-function, showing an enhanced ability to induce neuronal aggregation, while those linked to pachygyria behaved as loss-of-function, leading to defective neuronal aggregation/migration. The pachygyria-associated de novo heterozygous RELN variants acted as dominant-negative by preventing WT RELN secretion in culture, animal models, and patients, thereby causing dominant NMDs. We demonstrated how mutant RELN proteins in vitro and in vivo predict cortical malformation phenotypes, providing valuable insights into the pathogenesis of such disorders.

Keywords: Cell migration/adhesion; Development; Genetic diseases; Neurodevelopment; Neuroscience.


Figures

Figure 1
Figure 1. Cortical malformations in heterozygous patients associated with RELN missense variants.
(A) Brain MRI from patients with heterozygous RELN variants. C1 exhibits bilateral fronto-parietal polymicrogyria with nodular heterotopia, MI1/2 bilateral perisylvian polymicrogyria, DN* frontal-predominant bilateral pachygyria, and DN1 and DN2 frontotemporal-predominant bilateral pachygyria. Representative axial T1 section of the cortical malformations (white arrows). (B) Primary structure of the RELN protein showing 8 Reelin repeats (1–8 ovals). Arrows indicate the position of missense variants; each color corresponds to a patient (C1 blue, MI1/2 pink, DN* green, DN1 orange, and DN2 yellow).
Figure 2
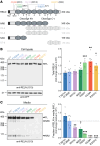
Figure 2. Missense variants alter RELN secretion in vitro.
(A) Schematic of the full-length (FL) RELN protein (450 kDa), its N-t and C-t cleavage sites (dashed arrows), and its 5 cleaved products (NR6, R3-8, R3-6, NR2, R7-8). The binding regions of the 142 and G10 antibodies and the position of RELN variants in the patient color coding are indicated with arrowheads and arrows, respectively. (B and C) Immunoblots (left) and densitometric analysis (right) of HEK293T cell lysates (B) and media (C) transfected with either WT-RELN or RELN variants, probed with anti-RELN G10 or anti-GFP antibodies. RELN signal normalized to GFP in lysates (n = 5–7 independent transfections) and expressed as the media-to-lysate (M/L) ratio in the media (n = 4–6 independent transfections). Data are mean ± SEM; 2-tailed 1-sample t test, *P < 0.05, **P < 0.01, ***P < 0.001. kDa, protein standard sizes.
Figure 3
Figure 3. RELN variants affect the capacity to form aggregates along the rostro-caudal axis in the embryonic mouse cortex.
(A) Schematic representation of in utero electroporation (IUE) at E14.5 and collection at P1. (B) Wide-field immunofluorescence images of GFP+ (green) aggregates (white arrowheads), with DAPI counterstaining (blue), at 2 rostro-caudal levels (bregma 0.86 and –1.58) of P1 mouse brains upon IUE of WT-RELN and patients’ variants, Y1821H, G1280E, R913C, I650S, D556V, C539R, and R3207C. Scale bar: 500 μm. (C) Quantification of aggregate formation at rostral and caudal levels for all electroporated constructs (n = 3–17 electroporated brains per construct).
Figure 4
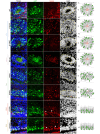
Figure 4. Pachygyria-associated variants fail to generate well-structured rosettes.
Immunofluorescence images of aggregates stained with GFP (green) and RELN (red) antibodies and DAPI (blue) for nuclei. Aggregates with electroporated GFP+ cells projecting their processes toward a central region that is cell body–poor and RELN-rich are considered properly formed rosettes. Aggregates lacking a central cell body–sparse region with the processes of GFP+ cells not projecting radially toward it are simply classified as aggregates. VZ, ventricular zone; IZ, intermediate zone; DL, deeper layers. White arrows indicate GFP+ cells with increased RELN signal. Dashed yellow lines outline the rosette/aggregate margins. Scale bar: 50 μm.
Figure 5
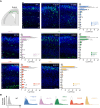
Figure 5. RELN variants affect cell migration at rostral levels.
(A) Immunofluorescence wide-field images of P1 brains at rostral levels after IUE at E14.5. The entire thickness of the electroporated cortex was divided into 10 bins, and the percentage of electroporated GFP+ cells per bin was calculated (n = 5 WT-RELN, n = 3 mutants). Bin 1 corresponded to layer I (LI), bins 2–4 to upper layers (UL), bins 5–7 to deeper layers (DL), bins 8–9 to intermediate zone (IZ), and bin 10 to ventricular zone (VZ). Data are mean ± SEM; each symbol represents one electroporated brain; Kolmogorov-Smirnov test, *P < 0.05. Scale bar: 100 μm. (B) Recapitulative representation of the estimated distribution of electroporated cells from LI to the VZ for all constructs.
Figure 6
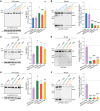
Figure 6. Pachygyria-associated de novo heterozygous RELN variants behave as dominant-negative in vitro.
(A and B) Immunoblots (left) and densitometric analysis (right) of HEK293T cell lysates (A) and media (B) cotransfected with Y1821H and G1280E variants, or cotransfected with WT-RELN and R913C, I650S/D556V, C539R, or R3207C variants, probed with anti-RELN G10 or anti-GFP antibodies. RELN signal normalized to GFP in lysates and expressed as the media-to-lysate (M/L) ratio in the media (n = 4–8 independent transfections). (CF) Immunoblots (left) and densitometric analysis (right) of cell lysates (C and E) and media (D and F) of HEK293T cells cotransfected with a FLAG-WT-RELN and WT-RELN, R913C, I650S/D556V, C539R, or R3207C variants, probed with anti-FLAG, anti-RELN G10, or anti-GFP antibodies. Data are presented as described for A and B (n = 4 independent transfections). All data are mean ± SEM; 2-tailed 1-sample t test, *P < 0.05, **P < 0.01, ***P < 0.001. Asterisk by immunoblot in C indicates unspecific bands. kDa, protein standard sizes.
Figure 7
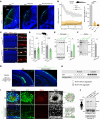
Figure 7. Pachygyria-associated de novo variants dominantly suppress RELN secretion in animal models and patients.
(A) RELN (green) distribution in Reln+/+, Reln+/R3215C, and RelnR3215C/R3215C zebrafish at 5 days post-fertilization (dpf) on cryosectioned tecta, with DAPI (blue). PV, periventricular zone; SINs, superficial interneurons. Scale bar: 30 μm. (B) Densitometric plots (left) depict average RELN intensities (with minimum and maximum values) from the skin surface to the periventricular zone (green area in A) at distances 0, 10, 20, and 30 μm. Right: Fluorescence intensities at the neuropil surface. Data are mean ± SEM (n = 4 animals per genotype); 1-way ANOVA, Dunnett’s test, ***P < 0.001. (C) Immunofluorescence images of P0 Reln+/+ and Reln+/D557V neocortices with CR cells expressing RELN (red) and p73 (white), with DAPI (blue). Scale bars: 75 μm. (D) RELN intensities in CR cell somata (n = 38 Reln+/+; n = 40 Reln+/D557V somata, from 4 brains per genotype) and in LI’s extracellular space (n = 16 regions of interest, from 4 brains per genotype). Data are mean ± SEM; Welch’s t test, **P < 0.01, ***P < 0.001. (E and F) Immunoblots (left) and densitometric analysis (right) of HEK293T lysates (E) and media (F) transfected with WT-RELN or RELN variants from patient DN*. RELN signal normalized to GFP in lysates and expressed as the media-to-lysate ratio in the media (n = 4 independent transfections). Data are mean ± SEM; Mann-Whitney test, *P < 0.05. (G) Immunofluorescence images of GFP+ (green) aggregates, with DAPI (blue), in caudal P1 mouse brains upon IUE at E14.5 of WT-RELN and I650S/D556V (n = 5–6). Scale bar: 250 μm. (H) Analysis of aggregate formation. (I) Immunofluorescence images of aggregates stained for GFP (green), RELN (red), and DAPI (blue). Scale bar: 50 μm. (J) Representative immunoblotting (from 2 experiments) of patient DN* blood serum, healthy mother, and unrelated control, with anti-RELN 142 antibodies. Ponceau S indicates equal protein loading. *Unspecific bands. kDa, protein standard sizes.

References

    1. Rakic P, et al. Decision by division: making cortical maps. Trends Neurosci. 2009;32(5):291–301. doi: 10.1016/j.tins.2009.01.007. - DOI - PMC - PubMed
    1. Rakic P. Specification of cerebral cortical areas. Science. 1988;241(4862):170–176. doi: 10.1126/science.3291116. - DOI - PubMed
    1. Ogawa M, et al. The reeler gene-associated antigen on Cajal-Retzius neurons is a crucial molecule for laminar organization of cortical neurons. Neuron. 1995;14(5):899–912. doi: 10.1016/0896-6273(95)90329-1. - DOI - PubMed
    1. D’Arcangelo G, et al. A protein related to extracellular matrix proteins deleted in the mouse mutant reeler. Nature. 1995;374(6524):719–723. doi: 10.1038/374719a0. - DOI - PubMed
    1. Jossin Y. Neuronal migration and the role of reelin during early development of the cerebral cortex. Mol Neurobiol. 2004;30(3):225–251. doi: 10.1385/MN:30:3:225. - DOI - PubMed

MeSH terms