Clinical Trial
. 2024 Jul 9;134(18):e174598.
doi: 10.1172/JCI174598.

A fibroblast-dependent TGF-β1/sFRP2 noncanonical Wnt signaling axis promotes epithelial metaplasia in idiopathic pulmonary fibrosis

Affiliations
Clinical Trial

A fibroblast-dependent TGF-β1/sFRP2 noncanonical Wnt signaling axis promotes epithelial metaplasia in idiopathic pulmonary fibrosis

Max L Cohen et al. J Clin Invest. .

Abstract

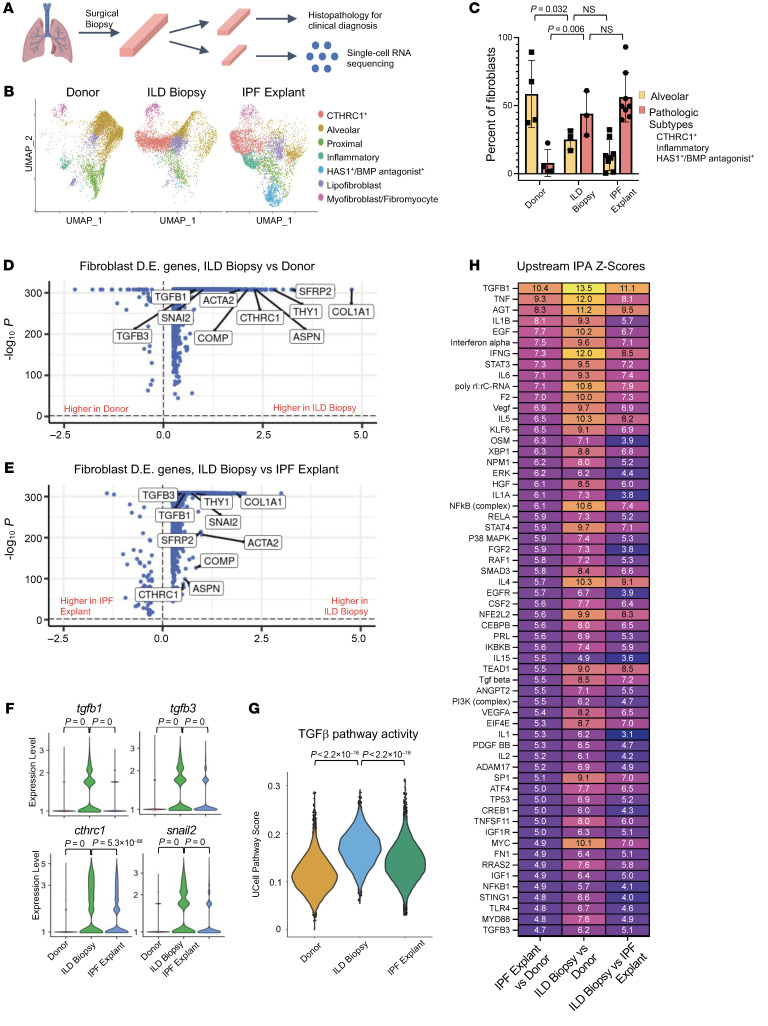
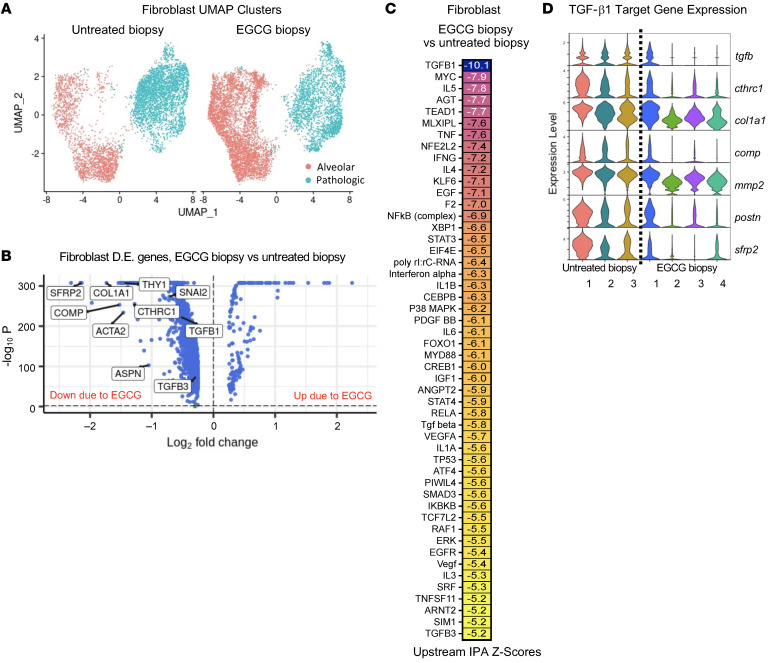
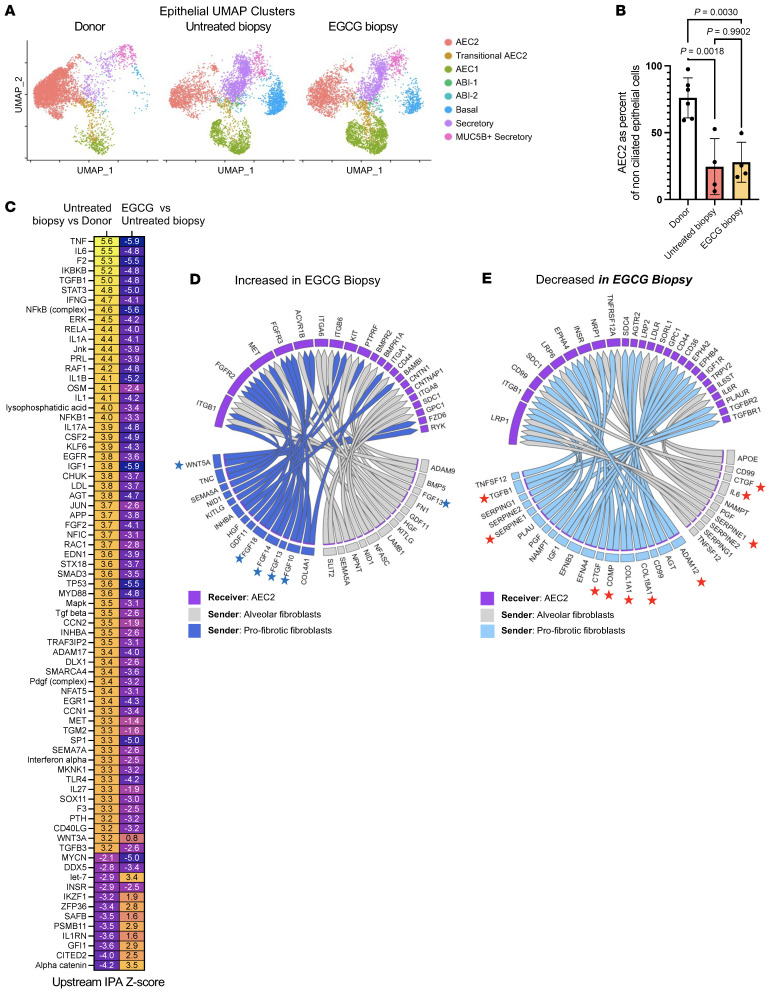
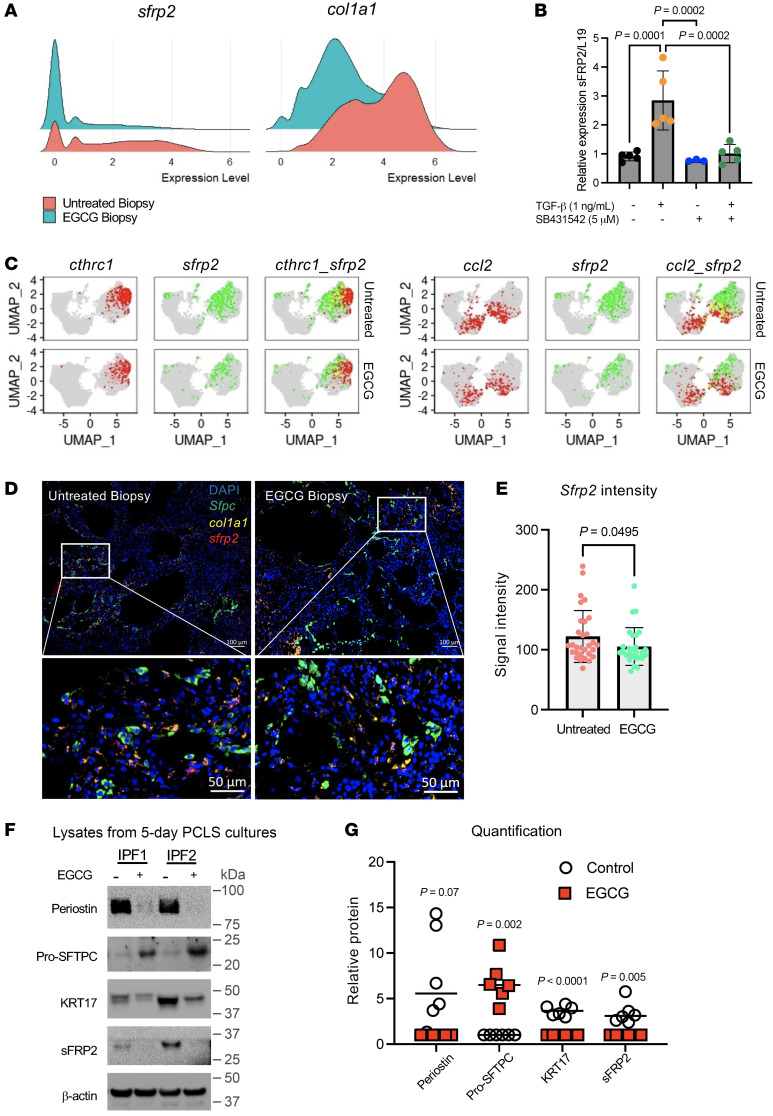
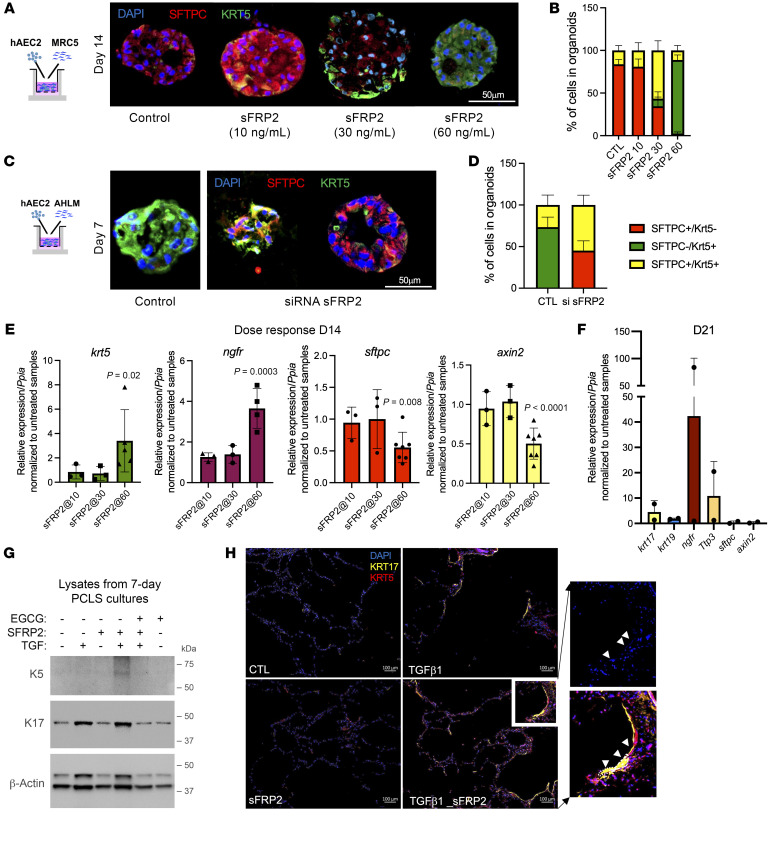
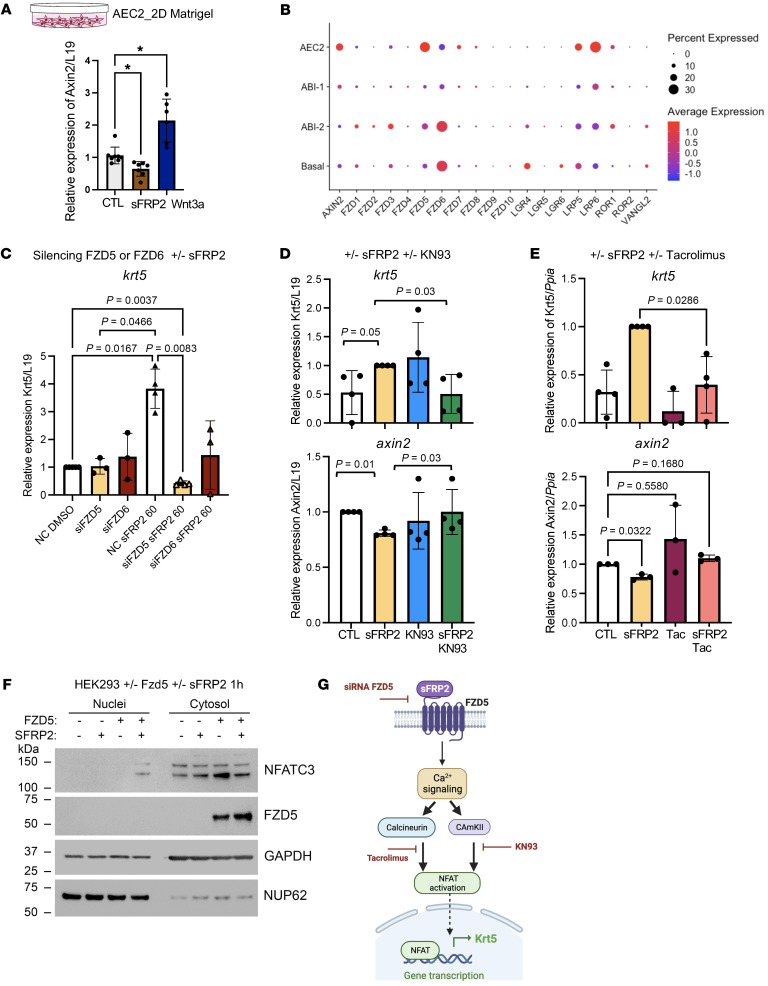
Reciprocal interactions between alveolar fibroblasts and epithelial cells are crucial for lung homeostasis, injury repair, and fibrogenesis, but underlying mechanisms remain unclear. To investigate, we administered the fibroblast-selective TGF-β1 signaling inhibitor epigallocatechin gallate (EGCG) to interstitial lung disease (ILD) patients undergoing diagnostic lung biopsy and conducted single-cell RNA-Seq on spare tissue. Biopsies from untreated patients showed higher fibroblast TGF-β1 signaling compared with nondisease donor or end-stage ILD tissues. In vivo, EGCG downregulated TGF-β1 signaling and several proinflammatory and stress pathways in biopsy samples. Notably, EGCG reduced fibroblast secreted frizzled-related protein 2 (sFRP2), an unrecognized TGF-β1 fibroblast target gene induced near type II alveolar epithelial cells (AEC2s) in situ. Using AEC2-fibroblast coculture organoids and precision-cut lung slices (PCLSs) from nondiseased donors, we found TGF-β1 signaling promotes a spread AEC2 KRT17+ basaloid state, whereupon sFRP2 then activates a mature cytokeratin 5+ (Krt5+) basal cell program. Wnt-receptor Frizzled 5 (Fzd5) expression and downstream calcineurin signaling were required for sFRP2-induced nuclear NFATc3 accumulation and KRT5 expression. These findings highlight stage-specific TGF-β1 signaling in ILD and the therapeutic potential of EGCG in reducing idiopathic pulmonary fibrosis-related (IPF-related) transcriptional changes and identify TGF-β1/noncanonical Wnt pathway crosstalk via sFRP2 as a mechanism for dysfunctional epithelial signaling in IPF/ILD.

Keywords: Cytokines; Fibrosis; Human stem cells; Pulmonology.


Figures

Figure 1
Figure 1. Fibroblasts from ILD biopsies have higher TGF-β signaling than fibroblasts from ILD explants.
(A) Schematic of processing diagnostic lung biopsies of ILD patients. (B) Dimensional reduction plot of fibroblasts from donor (13,856 cells, n = 13), ILD biopsy (7,724 cells, n = 3), and IPF explant (21,192 cells, n = 26) samples. (C) Fibroblast subtype composition by sample type. (D and E) Volcano plots of differentially expressed (D.E.) genes in all fibroblasts from ILD biopsy samples versus donor samples and ILD biopsy samples versus IPF explant samples, with selected TGF-β pathway–related genes labeled. (F) Violin plot of selected TGF-β1–related genes in all fibroblasts. (G) Single-cell activity of hallmark TGF-β pathway in all fibroblasts. (H) Heatmap of z scores from pairwise upstream IPA of differentially expressed genes from all fibroblasts. Statistical significance was determined by 2-tailed t test (C, F, and G) and MAST with adjustment for multiple comparisons (D and E).
Figure 2
Figure 2. EGCG inhibits TGF-β1 pathway activity in fibroblasts from ILD biopsies and identifies sFRP2 as a downstream target gene.
(A) Dimensional reduction plot of subsetted and reclustered alveolar (red) and pathologic (blue) (CTHRC1+, inflammatory, and HAS1+/BMP antagonist+) fibroblast subtypes from untreated biopsy (5,225 cells, n = 3) and EGCG biopsy (6,773 cells, n = 4) samples. (B) Volcano plot of differentially expressed genes in alveolar and pathologic fibroblast subtypes from EGCG biopsy versus untreated biopsy samples, with selected TGF-β pathway genes labeled, including sFRP2. (C) Heatmap of z scores from IPA upstream pathway analysis of differentially expressed genes in alveolar and pathologic fibroblast subtypes from EGCG biopsy versus untreated biopsy samples. (D) Violin plots of selected TGF-β pathway genes split by individual biopsy sample.
Figure 3
Figure 3. EGCG inhibits IPF-associated changes in biopsy AEC2s.
(A) Dimensional reduction plot of nonciliated epithelial subtypes from donors (10,127 cells, n = 14), untreated biopsy (10,336 cells, n = 4), and EGCG biopsy samples (11,585 cells, n = 4). (B) AEC2s as percentages of nonciliated epithelium. (C) Heatmap of selected top up- and downregulated upstream IPA pathways from untreated biopsy versus donor and EGCG biopsy versus untreated biopsy comparisons in AEC2s. (D and E) NicheNet prediction of differential receptor-ligand signaling from fibroblasts to AEC2s as a result of EGCG. Blue stars highlight AEC2 trophic factors increased in EGCG biopsy samples, and red stars highlight profibrotic pathways decreased in EGCG biopsy samples. Statistical significance was determined by Šídák’s multiple-comparisons test (B).
Figure 4
Figure 4. Impact of EGCG on distribution of sFRP2 expression in fibroblast subpopulations, biopsy tissues, and PCLS cultures.
(A) Ridge plot of sfrp2 and col1a1 gene expression in alveolar and pathologic fibroblast subtypes from untreated and EGCG biopsy samples. (B) Relative expression of sfrp2 mRNA in human fibroblasts treated with TGF-β1 (1 ng/ml) and/or TGF-β inhibitor SB4331542 (5 μM) for 48 hours (n = 5). (C) Feature plots of sfrp2 gene expression (green) in various fibroblast subsets characterized by cthrc1 or ccl2 gene expression (red). Cells expressing both sfrp2 and cthrc1 or ccl2 are indicated in yellow. Additional fibroblast markers are shown in Supplemental Figure 4B. (D and E) RNA in situ hybridization was performed for col1a1 (yellow) and sfrp2 (red) genes in untreated and EGCG biopsies (D). The signal intensity of sfrp2 was quantified for each image (E). Representative images of n = 5 samples per group, 4–6 images per sample. Original magnification, ×100 (top images). Bottom images represent a region of interest as indicated by white rectangle. (F and G) PCLSs from IPF lung donors cultured for 7 days with EGCG (1 μM) and analyzed by Western blot. Additional samples are shown in Supplemental Figure 5C. (G) Graphical representation of the level of expression of selected proteins for all samples (see Supplemental Figure 5C). n = 6. Statistical significance was determined by the Kruskal-Wallis test (B) and 2-tailed t test (E and G).
Figure 5
Figure 5. sFRP2 promotes BC differentiation of human AEC2s.
(A) Immunofluorescence for SFTPC and KRT5 of AEC2-derived organoids cocultured with MRC5 cells treated with sFRP2 for 14 days. Representative of n = 5 biological replicates. The experiment was performed in 3 technical triplicates, and data from 3 technical replicates are counted as 1 biological replicate. Original magnification, ×200. (B) Percentages of SFTPC+KRT5, SFTPC+KRT5+, and SFTPCKRT5+ cells in day-14 AEC2s plus MRC5 organoids treated with sFRP2. (C) Immunofluorescence of AEC2-derived organoids cocultured with AHLM after sFRP2 silencing. Original magnification, ×200. (D) Percentages of SFTPC+KRT5, SFTPC+KRT5+, and SFTPCKRT5+ cells in day-7 AEC2s plus AHLMsfrp2neg organoids. Data are presented as means of n = 4 biological replicates. (E) Levels of expression of krt5, ngfr, sftpc, and axin2 mRNA in EPCAM+ cells isolated from day-14 AEC2s plus MRC5 organoids treated with sFRP2. n = 3 biological replicates for sFFRP2 (10 and 30 ng/ml) and n = 4–7 biological replicates for sFRP2 (60 ng/ml). (F) Expression of genes characteristic for BCs in EPCAM+ cells isolated from day-21 AEC2s plus MRC5 organoids treated with sFRP2 (60 ng/ml). n = 2 biological replicates. (G and H) PCLSs from nondiseased donors were cultured and treated with or without TGF-β1 (2 ng/ml), with or without sFRP2 (60 ng/ml), and with or without EGCG (1 μM) for 7 days. (G) Lysates were blotted for KRT5 and KRT17. n = 3 biological replicates. (H) Immunofluorescence of KRT5 and KRT17. Representative of n = 3 independent experiments. Original magnification, ×100. Region of interest is presented as an insert (white rectangle) to show elongation of nuclei (DAPI) and cell morphology, outlined as a dotted line in insert as indicated by white arrowheads. Statistical significance was determined by mixed-effects analysis followed by Tukey’s multiple-comparisons test (B and D), Dunnett’s multiple comparisons test (E), and 2-tailed t test (F). P values are reported in Supplemental Table 4 for B and D.
Figure 6
Figure 6. sFRP2 acts on AEC2s through the Fzd5 receptor to promote noncanonical Wnt signaling.
(A) axin2 gene expression in AEC2s cultured for 48 hours with sFRP2 (60 ng/ml) or Wnt3a (100 ng/ml). n = 4–6 biological replicates. *P < 0.05 (B) Dot plot of Frizzled receptors and related coreceptors from selected epithelial cells from donor, control biopsy, and ILD explant samples. (C) krt5 mRNA levels expressed in AEC2s were measured after silencing the expression of fzd5 or fzd6. The silenced fzd5 and silenced fzd6 AEC2 cells were subsequently treated with 60 ng/ml of sFRP2 for 48 hours. n = 3 independent biological replicates. (D) Levels of expression of krt5 and axin2 mRNA were measured in AEC2 cells treated with CaMKII inhibitor KN93 (1 μg/ml–1) with or without sFRP2 (60 ng/ml) for 48 hours. (E) Levels of expression of krt5 and axin2 mRNA were measured in AEC2 cells treated with tacrolimus (1 μM) with or without sFRP2 (60 ng/ml) for 48 hours. (F) Western blot indicating the presence of NFATC3 in nuclei extract from HEK293 cells transfected with FZD5 plasmid followed by treatment with sFRP2 (30 ng/ml) for 1 hour. n = 3 biological replicates. (G) Schematic of the sFRP2-FZD5 signaling pathway promoting the expression of KRT5 in AECs. Created with BioRender. Statistical significance was determined by Kruskal-Wallis (A), Tukey’s test (C), or Dunnett’s test (axin2 in E) and Mann–Whitney t test (D, krt5 in E).

Update of

References

    1. Wolters PJ, et al. Time for a change: is idiopathic pulmonary fibrosis still idiopathic and only fibrotic? Lancet Respir Med. 2018;6(2):154–160. doi: 10.1016/S2213-2600(18)30007-9. - DOI - PMC - PubMed
    1. Wijsenbeek M, Cottin V. Spectrum of fibrotic lung diseases. N Engl J Med. 2020;383(10):958–968. doi: 10.1056/NEJMra2005230. - DOI - PubMed
    1. Lederer DJ, Martinez FJ. Idiopathic pulmonary fibrosis. N Engl J Med. 2018;378(19):1811–1823. doi: 10.1056/NEJMra1705751. - DOI - PubMed
    1. Katzenstein AL. Pathogenesis of “fibrosis” in interstitial pneumonia: an electron microscopic study. Hum Pathol. 1985;16(10):1015–1024. doi: 10.1016/S0046-8177(85)80279-3. - DOI - PubMed
    1. Myers JL, Katzenstein A-LA. Epithelial necrosis and alveolar collapse in the pathogenesis of usual interstitial pneumonia. Chest. 1988;94(6):1309–1311. doi: 10.1378/chest.94.6.1309. - DOI - PubMed

Publication types

MeSH terms

Substances