. 2024 Jul 16;121(29):e2400592121.
doi: 10.1073/pnas.2400592121. Epub 2024 Jul 9.

Global expansion of marine protected areas and the redistribution of fishing effort

Affiliations

Global expansion of marine protected areas and the redistribution of fishing effort

Gavin McDonald et al. Proc Natl Acad Sci U S A. .

Abstract

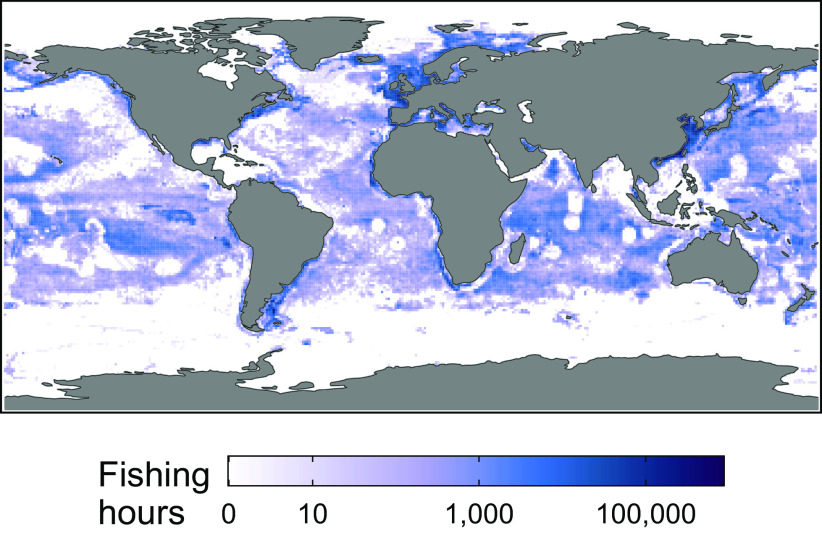
The expansion of marine protected areas (MPAs) is a core focus of global conservation efforts, with the "30x30" initiative to protect 30% of the ocean by 2030 serving as a prominent example of this trend. We consider a series of proposed MPA network expansions of various sizes, and we forecast the impact this increase in protection would have on global patterns of fishing effort. We do so by building a predictive machine learning model trained on a global dataset of satellite-based fishing vessel monitoring data, current MPA locations, and spatiotemporal environmental, geographic, political, and economic features. We then use this model to predict future fishing effort under various MPA expansion scenarios compared to a business-as-usual counterfactual scenario that includes no new MPAs. The difference between these scenarios represents the predicted change in fishing effort associated with MPA expansion. We find that regardless of the MPA network objectives or size, fishing effort would decrease inside the MPAs, though by much less than 100%. Moreover, we find that the reduction in fishing effort inside MPAs does not simply redistribute outside-rather, fishing effort outside MPAs would also decline. The overall magnitude of the predicted decrease in global fishing effort principally depends on where networks are placed in relation to existing fishing effort. MPA expansion will lead to a global redistribution of fishing effort that should be accounted for in network design, implementation, and impact evaluation.

Keywords: conservation; fishing effort; marine protected areas; predictive machine learning.


Conflict of interest statement

Competing interests statement:The authors declare no competing interest.

Figures

Fig. 1.
Fig. 1.
Map of observed fishing effort (hours) in 2021, shown using a log10 scale for visualization purposes. Pixels have a 1x1 degree geographic coordinate resolution, the spatial unit of our analysis.
Fig. 2.
Fig. 2.
Maps of business-as-usual (BAU) network and hypothetical global MPA networks used in our simulations. The fill color of the global MPA network maps is by the global area coverage size, and only pixels that are fully enclosed in MPAs are colored. The BAU scenario holds fixed the existing fully protected MPA coverage as of the end of 2020 (2.5% of ocean area). Since the Sala et al. 2021 network scenarios, protecting most-fished pixel scenario, and random, unfished, and most-fished scenarios each protect pixels in descending order of priority, the network for each area protected size (3%, 5%, 10%, 16%, 20%, and 30%) is inclusive of all pixels in smaller coverage sizes. The Visalli et al. 2020 and expert-derived EBSA scenarios are each only available for a single coverage size (16% and 20%). Pixels have a 1x1 degree geographic coordinate resolution, the spatial unit of our analysis.
Fig. 3.
Fig. 3.
Percent of global fishing effort (hours) that spatially occurs within pixels that would be protected by hypothetical MPA networks versus percent of global ocean area protected, colored by MPA scenario. Colors differentiate the various hypothetical MPA networks. Linetypes are used to further differentiate networks that can have various levels of protection, while shapes are used to differentiate networks that only have a single level of protection. The scenarios are listed in the legend in the same order as they appear in the figure at the level of their largest area protected.
Fig. 4.
Fig. 4.
Total observed global fishing effort (hours) (where forecast horizons −5 to 0 correspond to observed data from years 2016 to 2021), and total predicted global fishing effort in the business-as-usual (BAU) scenario and all MPA scenarios for the three predicted forecast horizons. A vertical dashed line is shown at 0 y (such that the line to the Left represents observed data, and the lines to the Right represent predictions). A horizontal dashed line is shown at the level of currently observed fishing effort in the last year of historically observed data. Each panel represents global MPA networks that are sized for a given percentage coverage. Colors and linetypes differentiate the various hypothetical MPA networks and the BAU scenario. The MPA network scenarios are listed in the legend in the same order as they appear in the figure at a forecast horizon of 3 y and their largest MPA coverage.
Fig. 5.
Fig. 5.
Predicted aggregate percentage changes in global fishing hours from expanding MPAs. The y-axis shows the relative difference in fishing hours between each MPA network scenario and the business-as-usual counterfactual scenario, with values aggregated globally. (A) presents the relationship between the percentage change in fishing hours and the percentage of ocean area covered by each hypothetical MPA network, with panels for each of the three forecast horizon years. (B) presents the relationship between the percentage change in fishing hours and the percentage of current global fishing hours occurring in areas that would be covered by each hypothetical MPA network, with panels for each of the three forecast horizon years. In all panels, colors differentiate the various hypothetical MPA networks. Linetypes are used to further differentiate networks that can have various levels of protection, while shapes are used to differentiate networks that only have a single level of protection. The MPA network scenarios are listed in the legend in the same order as they appear in the Top Right panel and their largest MPA coverage.
Fig. 6.
Fig. 6.
(A) Observed historic pixel-level changes in fishing hours between one-year after MPA implementation and one-year before MPA implementation, for fully protected MPAs implemented after 2016 and before 2021. Pixels are bucketed into different distance bins to the nearest MPA. (B) Predicted pixel-level changes in fishing hours from expanding MPAs, relative to business-as-usual scenario, with pixels grouped into different distance categories to the nearest MPA. Each point represents the pixel-level results for a different hypothetical MPA scenario, coverage size, and forecast horizon. For both (A and B), the points are jittered to avoid visual overlap. Boxplots and violin plots show distributions for each bin. The boxplots for each bin show the median, 25th percentile, and 75th percentile. A line connects the median values for each distance bin. The y-axis is limited to −100% to 150%, although some outlier values extend beyond 150%.

Comment in

References

    1. Woodley S., et al. , A review of evidence for area-based conservation targets for the post-2020 global biodiversity framework. Parks 25, 31–46 (2019).
    1. Eckert I., Brown A., Caron D., Riva F., Pollock L. J., 30x30 biodiversity gains rely on national coordination. Nat. Commun. 14, 7113 (2023). - PMC - PubMed
    1. Dinerstein E., et al. , A global deal for nature: Guiding principles, milestones, and targets. Sci. Adv. 5, eaaw2869 (2019). - PMC - PubMed
    1. Grorud-Colvert K., et al. , The MPA guide: A framework to achieve global goals for the ocean. Science 373, eabf0861 (2021). - PubMed
    1. Marine Conservation Institute, MPAtlas version December 2020. https://marine-conservation.org/mpatlas/download/. Accessed 1 December 2020.

Grants and funding