. 2024 Jul 9;18(12):1957-1966.
doi: 10.1093/ecco-jcc/jjae096. Online ahead of print.

Inflammatory bowel disease associated with primary sclerosing cholangitis is associated with an altered gut microbiome and bile acid profile

Affiliations

Inflammatory bowel disease associated with primary sclerosing cholangitis is associated with an altered gut microbiome and bile acid profile

Haim Leibovitzh et al. J Crohns Colitis. .

Abstract

Background: Primary sclerosing cholangitis associated with inflammatory bowel disease (IBD-PSC) carries significant morbidity compared to IBD without PSC. Alterations in microbial composition and bile acid (BA) profiles have been shown to modulate chronic inflammation in IBD, but data in IBD-PSC is scarce. We aimed to assess the differences in gut microbiome composition as well as in the BA profile and BA-related microbial functions between IBD-PSC and IBD-only.

Methods: 54 IBD-PSC and 62 IBD-only subjects were enrolled from 2012 to 2021. Baseline samples were collected for fecal DNA shotgun metagenomic sequencing, fecal and serum BA quantitation using mass spectrometry and fecal calprotectin. Liver fibrosis measured by transient elastography (TE) was assessed in the IBD-PSC group. Data was analyzed using general linear regression models and Spearman rank correlation tests.

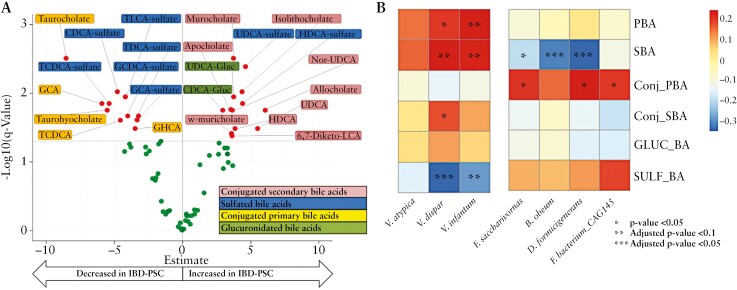
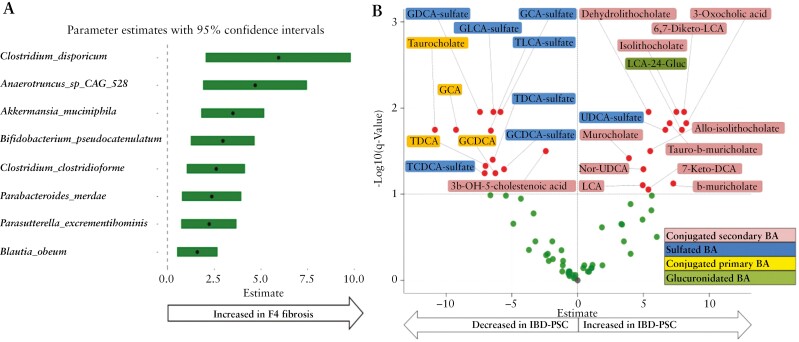
Results: Patients with IBD-PSC had reduced microbial gene richness (p=0.004) and significant compositional shifts (PERMANOVA: R2=0.01, p=0.03) compared to IBD-only. IBD-PSC was associated with altered microbial composition and function, including decreased abundance of Blautia obeum, increased abundance of Veillonella atypica, Veillonella dispar and Clostridium scindens (q<0.05 for all), and increased abundance of microbial genes involved in secondary BA metabolism. Decreased serum sulfated and increased serum conjugated secondary BA were associated with IBD-PSC and increased liver fibrosis.

Conclusion: We identified differences in microbial species, functional capacity and serum BA profiles in IBD-PSC compared with IBD-only. Our findings provide insight into the pathophysiology of IBD associated with PSC and suggest possible targets for modulating the risk and course of IBD in subjects with PSC.

Keywords: Bile acids; Gut microbiome; Inflammatory Bowel Disease; Primary Sclerosing Cholangitis.


Conflict of interest statement

All authors disclose no potential conflicts [financial, professional, or personal] that are relevant to the manuscript.

Figures

Figure 1.
Figure 1.
Diversity and species differential abundance in IBD-PSC compared to IBD-only. [A] Alpha diversity expressed by microbial gene richness [observed genes]; p-value calculated using the Wilcoxon test. [B] Beta diversity was assessed with principal coordinates analysis plots at the species level based on Bray–Curtis dissimilarity index. Ellipsoids represent a 95% confidence interval surrounding each group [orange = IBD-only; green = IBD-PSC]. Permutation analysis of variance [PERMANOVA] was applied on distance matrices with 1000 permutations. [C] Coefficient plot showing the effect size and 95% confidence interval [x-axis] for the 11 taxa found to be associated with IBD-PSC [y-axis], based on MaAsLin2 adjusted for age, sex, and body mass index. Green colour denotes taxa associated with increased risk of IBD-PSC and red colour denotes taxa associated with decreased risk of IBD-PSC. IBD = inflammatory bowel disease, PSC = primary sclerosing cholangitis.
Figure 2.
Figure 2.
Microbial bile acid inducible [bai] operon genes in IBD-PSC compared to IBD-only. Association between microbial bai operon genes and IBD-PSC [green] compared to IBD-only [orange]; p-values calculated using a multivariable linear regression model adjusted for age, sex, and body mass index. Grey lines represent the means. The stacked bar-plot next to each gene shows the relative abundance of the bacterial species contributing to each microbial gene. IBD = inflammatory bowel disease, PSC = primary sclerosing cholangitis.
Figure 3.
Figure 3.
Serum bile acid associations with IBD-PSC phenotype and microbial species. [A] Volcano plot showing the associations of serum bile acids [BAs] with IBD-PSC; x-axis: effect size [estimate], y-axis: log10 of the q-value [log transformation is for visualization purposes]. Red dots represent BAs with q < 0.05, whereas green dots represent BA with q ≥ 0.05. Red dots right of the dotted vertical line are positively associated with IBD-PSC, whereas those to the left of the dotted vertical line are negatively associated with IBD-PSC. Each BA with q < 0.05 is coloured based on the BA family it belongs to [red—conjugated secondary BAs, blue—sulphated BAs, yellow—conjugated primary BAs, green—glucuronidated BAs]. [B] Heatmap of BAs [y-axis] and microbial species [x-axis] associated with IBD-PSC based on the Spearman rank correlation test. Species in the left panel are those belonging to the genus Veillonella whose relative abundance was significantly increased in IBD-PSC, whereas those in the right panel are those whose relative abundance was significantly decreased in IBD-PSC. Inverse correlation is seen between these species and sulphated as well as secondary BAs. IBD = inflammatory bowel disease, PSC = primary sclerosing cholangitis, PBA = primary BAs, SBA = secondary BAs, conj_PBA = conjugated primary BAs, conj_SBA = conjugated secondary BAs, GLUC_BA = glucuronidated BAs, SULF_BA = sulphated BAs. Asterisks: *p < 0.05, **adjusted p < 0.1, ***adjusted p < 0.05.
Figure 4.
Figure 4.
Associations of microbial species and serum bile acid composition with degree of liver fibrosis. [A] Coefficient plot showing the effect size and 95% confidence interval [x-axis] for the eight taxa found to be associated with degree of liver fibrosis [F4 vs F0–3] measured by transient elastography [TE] in the subgroup of patients with IBD-PSC and available TE data [n = 50] [y-axis], based on MaAsLin2 adjusted for age, sex, ursodeoxycholic acid treatment at recruitment, body mass index, alkaline phosphatase level, and time difference from recruitment to TE measurements. [B] Volcano plot showing the associations of serum BAs with degree of liver fibrosis [F4 vs F0–3] measured by TE in the subgroup of patients with IBD-PSC and available TE data [n = 50]; x-axis: effect size [beta coefficient], y-axis: log10 of the q-value [log transformation is for visualization purposes]. Red dots represent BAs with q < 0.1, whereas green dots represent BAs with q ≥ 0.1. Red dots right of the dotted vertical line are positively associated with F4 fibrosis degree, whereas those to the left of the dotted vertical line are negatively associated with F4 fibrosis degree. Each BA with q < 0.1 is coloured based on the BA family it belongs to [red—conjugated secondary BAs, blue—sulphated BAs, yellow—conjugated primary BAs, green—glucuronidated BAs]. IBD = inflammatory bowel disease, PSC = primary sclerosing cholangitis.

References

    1. Gochanour E, Jayasekera C, Kowdley K.. Primary sclerosing cholangitis: epidemiology, genetics, diagnosis, and current management. Clin Liver Dis 2020;15:125–8. - PMC - PubMed
    1. Karlsen TH, Folseraas T, Thorburn D, Vesterhus M.. Primary sclerosing cholangitis – a comprehensive review. J Hepatol 2017;67:1298–323. - PubMed
    1. Kummen M, Holm K, Anmarkrud JA, et al.The gut microbial profile in patients with primary sclerosing cholangitis is distinct from patients with ulcerative colitis without biliary disease and healthy controls. Gut 2017;66:611–9. - PubMed
    1. Kummen M, Thingholm LB, Rühlemann MC, et al.Altered gut microbial metabolism of essential nutrients in primary sclerosing cholangitis. Gastroenterology 2021;160:1784–98.e0. - PMC - PubMed
    1. Little R, Wine E, Kamath BM, Griffiths AM, Ricciuto A.. Gut microbiome in primary sclerosing cholangitis: A review. World J Gastroenterol 2020;26:2768–80. - PMC - PubMed