. 2024 Sep;11(34):e2400064.
doi: 10.1002/advs.202400064. Epub 2024 Jul 9.

Microglia Gravitate toward Amyloid Plaques Surrounded by Externalized Phosphatidylserine via TREM2

Affiliations

Microglia Gravitate toward Amyloid Plaques Surrounded by Externalized Phosphatidylserine via TREM2

Jong-Chan Park et al. Adv Sci (Weinh). 2024 Sep.

Abstract

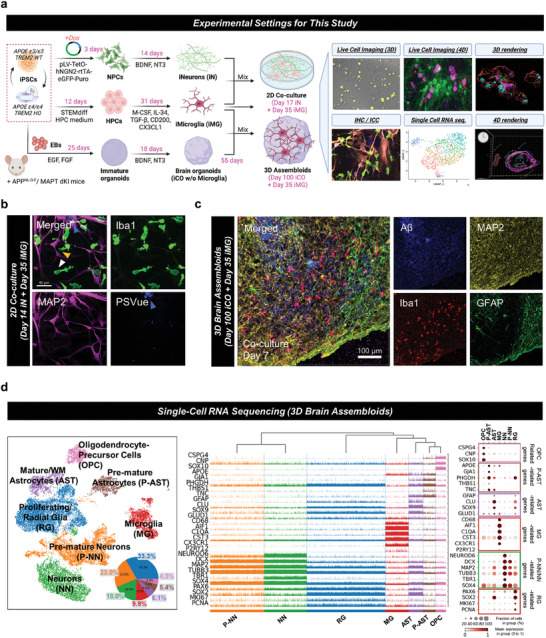
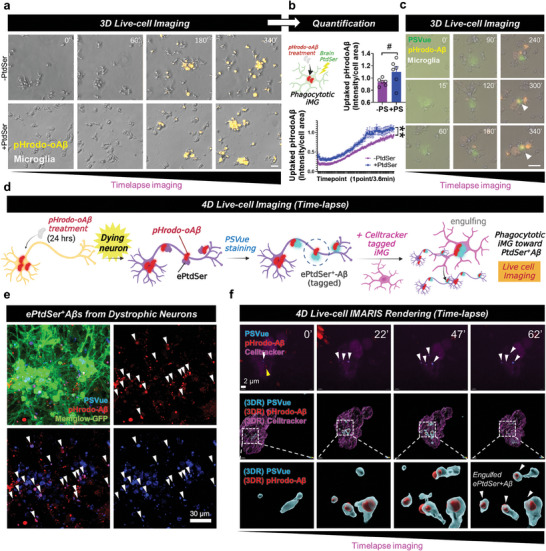
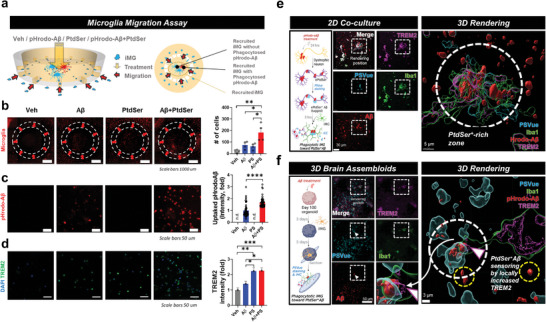
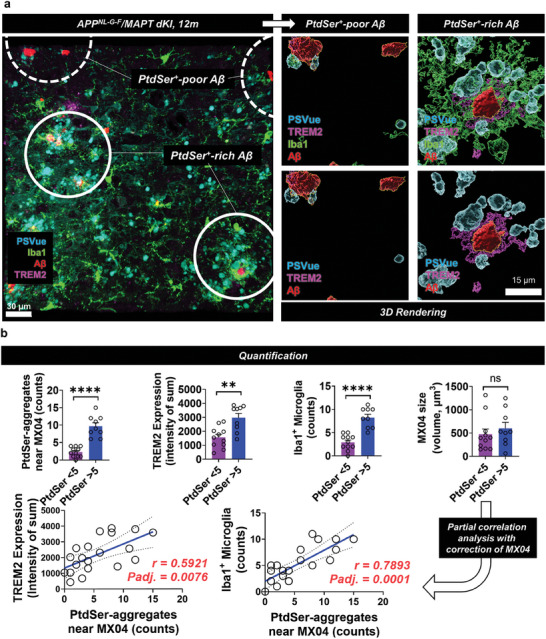
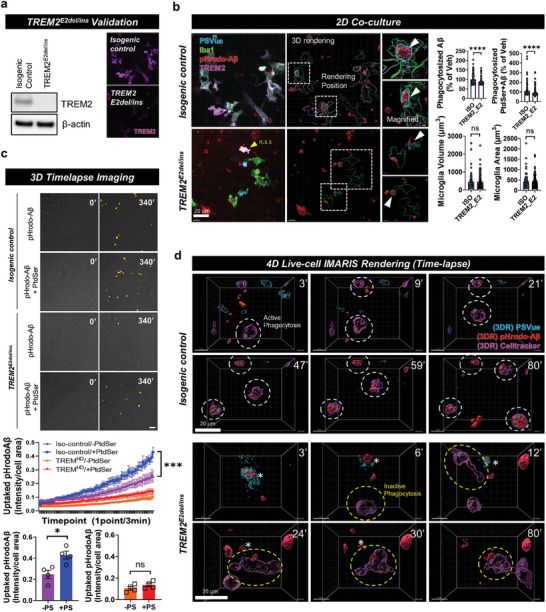
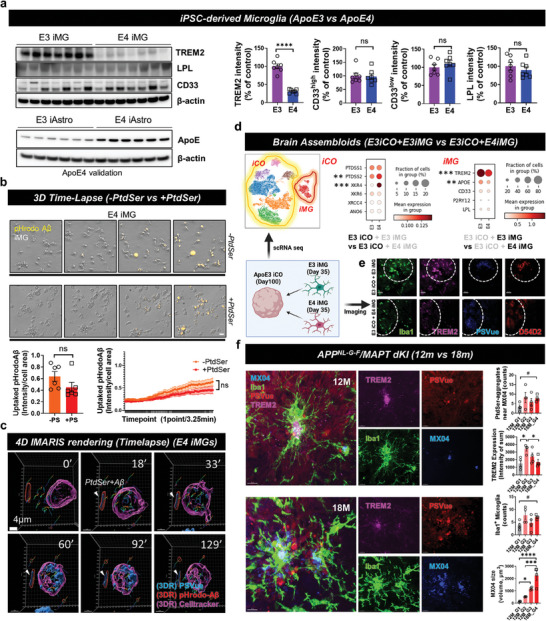
Microglia play a crucial role in synaptic elimination by engulfing dystrophic neurons via triggering receptors expressed on myeloid cells 2 (TREM2). They are also involved in the clearance of beta-amyloid (Aβ) plaques in Alzheimer's disease (AD); nonetheless, the driving force behind TREM2-mediated phagocytosis of beta-amyloid (Aβ) plaques remains unknown. Here, using advanced 2D/3D/4D co-culture systems with loss-of-function mutations in TREM2 (a frameshift mutation engineered in exon 2) brain organoids/microglia/assembloids, it is identified that the clearance of Aβ via TREM2 is accelerated by externalized phosphatidylserine (ePtdSer) generated from dystrophic neurons surrounding the Aβ plaques. Moreover, it is investigated whether microglia from both sporadic (CRISPR-Cas9-based APOE4 lines) and familial (APPNL-G-F/MAPT double knock-in mice) AD models show reduced levels of TREM2 and lack of phagocytic activity toward ePtdSer-positive Aβ plaques. Herein new insight is provided into TREM2-dependent microglial phagocytosis of Aβ plaques in the context of the presence of ePtdSer during AD progression.

Keywords: Alzheimer's disease; TREM2; beta‐amyloid; microglia; phosphatidylserine.


Conflict of interest statement

The authors declare no conflict of interest.

Figures

Figure 1
Figure 1
Experimental models (2D/3D/4D co‐culture) used in this study. a) Development of 2D/3D/4D co‐culture systems. The iPSC‐derived neurons (DIV 14) and microglia (DIV 35) were co‐cultured for immunocytochemistry, live cell imaging, and IMARIS 3D/4D rendering. Additionally, brain assembloids (DIV 100 brain organoids including DIV 35 iPSC‐derived microglia) were used for single‐cell RNA sequencing, immunohistochemistry, and IMARIS 3D rendering. b) Confocal microscopy imaging was used for the validation of 2D co‐culture systems. Human iPSC‐derived microglia (anti‐Iba1) mingle with iPSC‐derived neurons (anti‐MAP2), and externalized PtdSer (PSVue) are observed around the neurons. Green, microglia, anti‐Iba1; Pink, neurons, MAP2; Blue and white arrows, ePtdSer+, PSVue. Scale bar = 40 µm. c) Infiltration of microglia into the brain organoid. Blue, amyloid‐beta, anti‐D54D2; green, astrocytes, anti‐GFAP; red, microglia, anti‐Iba1; yellow, neurons, anti‐MAP2; white arrows, the deepest reaches of microglia. Scale bar = 100 µm. d) Characterization of brain assembloids via single‐cell RNA sequencing analysis. Uniform Manifold Approximation and Projection (UMAP) displaying the assembloids (n = 17,472 cells). A microglial population (a circle with a dotted line) was detected in the brain assembloids. Tracksplot showed gene expression levels by height. Dot plot showing the expression levels and fractions of cells expressing each cell type marker genes.
Figure 2
Figure 2
PtdSer improves microglial uptake of Aβ. a,b) Timelapse imaging of microglial uptake of pHrodo‐Aβs with/without PtdSer. Yellow, pHrodo‐Aβ. N = 6 slides for each group; average n = 27.68 cells were tracked per one field of view (scale bar = 20 µm). **p < 0.01, comparison of area under curves; # p < 0.1, independent t‐test. c) PtdSer initializes microglial uptake of pHrodo‐Aβs. Yellow, uptaken pHrodo‐Aβ; green, PSVue. Scale bar = 20 µm. d) Concept of 4D live‐cell imaging to visualize the uptake of ePtdSer+ Aβs by microglia. e) Generation of ePtdSer+ Aβs by dystrophic neurons. Green, Memglow‐GFP, neurons; blue, PSVue; red, pHrodo‐Aβ. f) 4D time‐lapse imaging with 3D rendering using IMARIS software. The internalized pHrodo‐Aβs were colocalized with ePtdSer (ePtdSer+ Aβs). White arrows, internalized ePtdSer+ Aβs; white box, 3D rendering position; blue, PSVue; red, pHrodo‐Aβs; pink, cell‐tracker 647, microglia.
Figure 3
Figure 3
Microglia gravitate toward ePtdSer+ Aβs via TREM2. a) Schematic illustration of microglia migration chip. Four independent treatment conditions (‘No treatment’ vs ‘pHrodo‐oAβ’ vs ‘PtdSer’ vs ‘pHrodo‐oAβ + PtdSer’) were compared. b) Microglia gravitate toward ePtdSer+ Aβs. The number of cells was counted. c) Comparison of pHrodo‐oAβ intensity (uptaked pHrodo‐oAβ) between the ‘pHrodo‐oAβ’ and ‘pHrodo‐oAβ + PtdSer’ condition. d) Comparison of TREM2 intensity. e) Microglia gravitate toward Aβs in the PtdSer+ rich zone (2D co‐culture). 3D rendering image shows engulfment of ePtdSer+ Aβs by microglia via TREM2. Scale bar = 30 µm or 5 µm. f) Microglia gravitate toward ePtdSer+ Aβs (white circle) rather than Aβs alone (yellow circle) via TREM2 in the brain assembloid. 3D rendering image shows the captured moment of the microglial arm with high expression of TREM2 toward ePtdSer+ Aβs. For (a‐d), *p < 0.05, **p < 0.01, ****p < 0.0001, multiple comparisons (ANOVA) with Tukey's post‐hoc test or unpaired t‐test were used for statistical analyses. Microglia, pseudo‐colored; pHrodo‐oAβ, red; DAPI, blue; TREM2 green. For (e,f), Scale bar = 50 µm or 3 µm. White box, 3D rendering position; white circles for (e), PtdSer+ rich zone; white circle for (f), ePtdSer+ Aβ sensing via TREM2; yellow circle for (f), Aβ alone; pink arrow, the TREM2‐expressing microglial arm for sensing ePtdSer+ Aβ; blue, PSVue; green, anti‐Iba1; red, MX04; pink, anti‐TREM2.
Figure 4
Figure 4
Difference in microglial responses toward Aβ plaques between PtdSer+ rich and poor zones in APPNL‐G‐F /MAPT dKI mice (12 months). a) The active microglia (high expression of TREM2) and the number of microglia (Iba1+) were significantly increased in the PtdSer+ rich zone. b) Quantification and correlation data. *p < 0.05, ***p < 0.001, independent t‐test; adjusted p‐values, p‐values from partial correlation analysis with the correction of MX04 (Aβ plaques) size; white circles for (a), PtdSer+ rich zone or PtdSer+ poor zone; blue, PSVue; green, anti‐Iba1; red, MX04; pink, anti‐TREM2. In N = 4 slices, MX04 regions (n = 12 for PtdSer aggregates < 5 and n = 8 for PtdSer aggregates> 5; total n = 20 spots; PtdSer aggregates were counted by IMARIS software after 3D rendering) were selected and quantified.
Figure 5
Figure 5
Loss‐of‐function of TREM2 causes defects in ePtdSer+‐Aβ recognition and phagocytic activity. a) Validation of iPSC‐derived microglia with TREM2 E2del/ins mutation. b) Deficient uptake efficiency of TREM2 E2del/ins microglia toward ePtdSer+ Aβ. n.s.s. non‐specific signals; white boxes, 3D rendering position. Scale bar = 20 µm. c) Timelapse imaging for TREM2 isogenic and TREM2 E2del/ins microglial uptake of pHrodo‐Aβs with/without PtdSer. PtdSer treatment significantly increased the phagocytic activity of isogenic microglia but not TREM2 E2del/ins microglia. Yellow, pHrodo‐Aβ. N = 4 slides for each group; average n = 129.5 cells were tracked per one field of view (scale bar = 100 µm). d) 4D time‐lapse imaging with 3D rendering using IMARIS software to compare between TREM2 isogenic and TREM2 E2del/ins microglia. TREM2 E2del/ins microglia show deficient uptake of ePtdSer+ Aβ. White circle, phagocytotic TREM2 isogenic microglia; yellow circle, deficient phagocytic activity of TREM2 E2del/ins microglia; blue, PSVue; red, pHrodo‐Aβs; pink, cell‐tracker 647, microglia. Scale bar = 10 µm. ***p < 0.001, comparison of slope analysis for linear regression models; *p < 0.05, independent t‐test; ns, no significance.
Figure 6
Figure 6
Loss‐of‐function of TREM2 toward ePtdSer+‐Aβ in both sporadic and familial AD model. a) Comparison of microglial markers between ApoE ɛ4/ɛ4 and ɛ3/ɛ3 iMG (upper band set) and validation of ApoE genotypes with iPSC‐derived astrocytes (iAsts; lower band set). Due to the low expression levels of ApoE proteins in iMG, we used iAsts for APOE genotype validation. **** p < 0.0001, independent t‐test. b) The 3D long‐term live‐cell imaging shows that PtdSer treatment does not affect the phagocytic activity of ApoE ɛ4/ɛ4 iMG. N = 6 slides for each group; average n = 30.38 cells were tracked per one field of view (scale bar = 20 µm). P‐values by independent t‐test and comparison of area under curves. c) 4D time‐lapse imaging with 3D rendering using IMARIS software. ApoE ɛ4/ɛ4 iMG show deficient phagocytic activity on ePtdSer+ Aβ. blue, PSVue; red, pHrodo‐Aβs; pink, cell‐tracker 647, microglia. Scale bar = 4 µm. d) Comparison of ApoE ɛ4/ɛ4 and ɛ3/ɛ3 iMGs with single cell RNA sequencing using human brain assembloids. Dot plots show the expression levels and fraction of cells that express each gene in iCOs and iMG. Statistical significance of differentially expressed genes and P‐values were calculated using Wilcoxon rank sum test for each group. e) Comparison of ePtdSer+ Aβs and microglial TREM2 in brain assembloids between ApoE ɛ4/ɛ4 and ɛ3/ɛ3 brain assembloids. blue, PSVue; green, anti‐Iba1; red, Aβ, anti‐D54D2; pink, anti‐TREM2. Scale bar = 50 µm. f) Comparison of ePtdSer+ Aβs and microglial TREM2 in the brain cortical sections of APP/MAPT dKI mice between 12‐month‐old mice and 18‐month‐old mice. 12 month‐group 1 (12M_G1), MX04 volume < 500; 12 month‐group 2 (12M_G2), 500 < MX04 volume < 1000; 12 month‐group 3 (12M_G3), MX04 volume > 1000; 18 month‐group 4 (18M_G4), MX volume > 1000. Sequential groups represent the progression of AD (from acute to chronic status). N = 4 slices were used for each bar. blue, PSVue; red, anti‐Iba1; blue, Aβ (MX04); pink, anti‐TREM2. Scale bar = 10 µm. #p = 0.05, independent t‐test; *p < 0.05, ***p < 0.001, and ****p < 0.0001 by ANOVA with post‐hoc test; ns, no significance.

References

    1. a) Yang I., Han S. J., Kaur G., Crane C., Parsa A. T., J. Clin. Neurosci. 2010, 17, 6; - PMC - PubMed
    2. b) Baik S. H., Kang S., Lee W., Choi H., Chung S., Kim J. I., Mook‐Jung I., Cell Metab. 2019, 30, 493. - PubMed
    1. Paolicelli R. C., Bolasco G., Pagani F., Maggi L., Scianni M., Panzanelli P., Giustetto M., Ferreira T. A., Guiducci E., Dumas L., Ragozzino D., Gross C. T., Science 2011, 333, 1456. - PubMed
    1. a) Streit W. J., Glia 2002, 40, 133; - PubMed
    2. b) Zhou X. G., Qiu W. Q., Yu L., Pan R., Teng J. F., Sang Z. P., Law B. Y., Zhao Y., Zhang L., Yan L., Tang Y., Sun X. L., Wong V. K. W., Yu C. L., Wu J. M., Qin D. L., Wu A. G., Inflamm. Regen. 2022, 42, 25; - PMC - PubMed
    3. c) Baik S. H., Kang S., Son S. M., Mook‐Jung I., Glia 2016, 64, 2274. - PubMed
    1. a) Kurematsu C., Sawada M., Ohmuraya M., Tanaka M., Kuboyama K., Ogino T., Matsumoto M., Oishi H., Inada H., Ishido Y., Sakakibara Y., Nguyen H. B., Thai T. Q., Kohsaka S., Ohno N., Yamada M. K., Asai M., Sokabe M., Nabekura J., Asano K., Tanaka M., Sawamoto K., J. Exp. Med. 2022, 219, e20202304; - PMC - PubMed
    2. b) Scott‐Hewitt N., Perrucci F., Morini R., Erreni M., Mahoney M., Witkowska A., Carey A., Faggiani E., Schuetz L. T., Mason S., Tamborini M., Bizzotto M., Passoni L., Filipello F., Jahn R., Stevens B., Matteoli M., EMBO J. 2020, 39, 105380; - PMC - PubMed
    3. c) Shacham‐Silverberg V., Sar Shalom H., Goldner R., Golan‐Vaishenker Y., Gurwicz N., Gokhman I., Yaron A., Cell Death Dis. 2018, 9, 1116. - PMC - PubMed
    1. a) Guerreiro R., Wojtas A., Bras J., Carrasquillo M., Rogaeva E., Majounie E., Cruchaga C., Sassi C., Kauwe J. S., Younkin S., Hazrati L., Collinge J., Pocock J., Lashley T., Williams J., Lambert J. C., Amouyel P., Goate A., Rademakers R., Morgan K., Powell J., St George‐Hyslop P., Singleton A., Hardy J., Alzheimer Genetic Analysis G., N Engl. J. Med. 2013, 368, 117; - PubMed
    2. b) Rueda‐Carrasco J., Sokolova D., Lee S‐E., Childs T., Jurčáková N., Crowley G., De Schepper S., Ge J. Z., Lachica J. I., Toomey C. E., Freeman O. J., Hardy J., Barnes S. J., Lashley T., Stevens B., Chang S., Hong S., EMBO J. 2023, 42, 113246. - PMC - PubMed