Comparative Study
. 2024 Aug 8;68(7):725-736.
doi: 10.1093/annweh/wxae043.

Comparison of 3 methods characterizing H2S exposure in water and wastewater management work

Affiliations
Comparative Study

Comparison of 3 methods characterizing H2S exposure in water and wastewater management work

Åse Dalseth Austigard et al. Ann Work Expo Health. .

Abstract

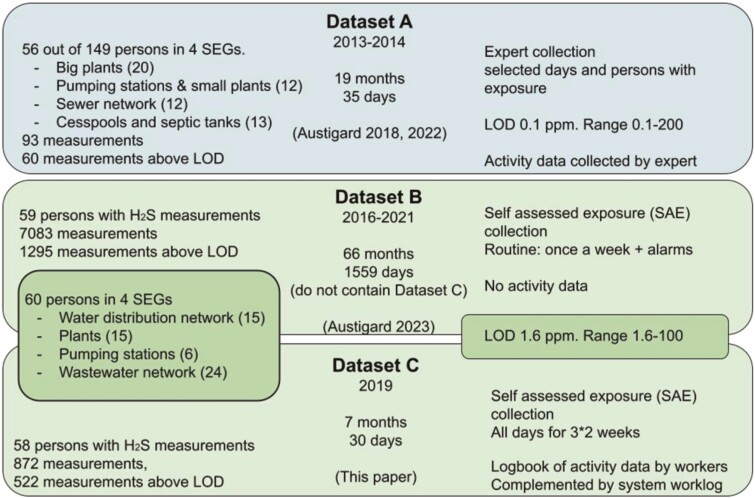
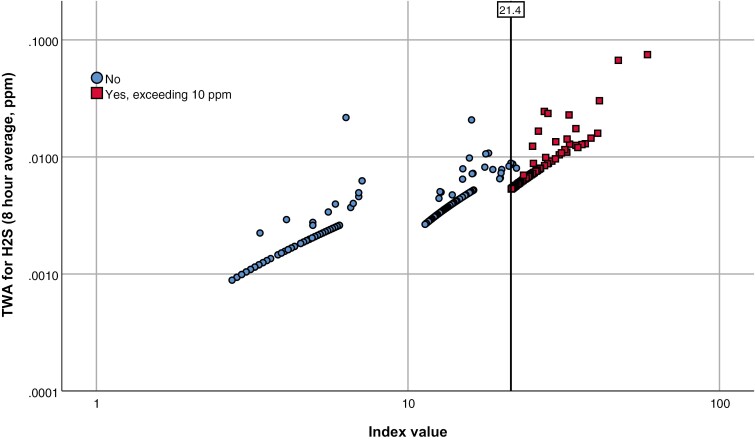
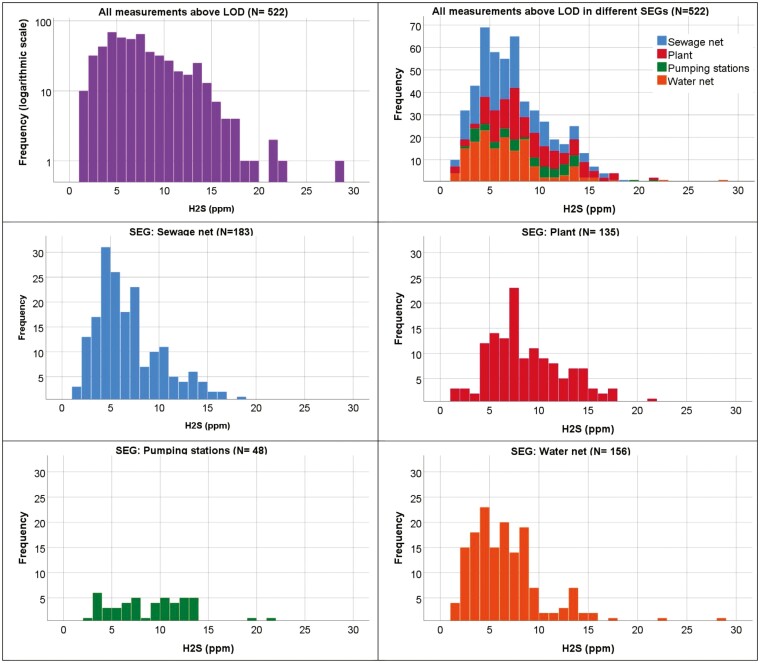
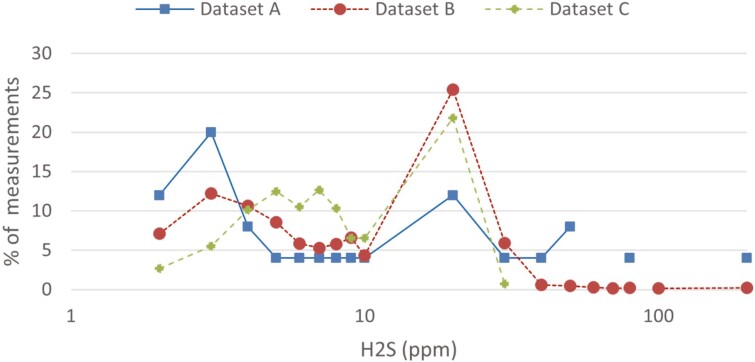
This study evaluates the effectiveness of self-assessed exposure (SAE) data collection for characterization of hydrogen sulfide (H2S) risks in water and wastewater management, challenging the adequacy of traditional random or campaign sampling strategies. We compared 3 datasets derived from distinct strategies: expert data with activity metadata (A), SAE without metadata (B), and SAE with logbook metadata (C). The findings reveal that standard practices of random sampling (dataset A) fail to capture the sporadic nature of H2S exposure. Instead, SAE methods enhanced by logbook metadata and supported by reliable detection and calibration infrastructure (datasets B and C) are more effective. When assessing risk, particularly peak exposure risks, it is crucial to adopt measures that capture exposure variability, such as the range and standard deviations. This finer assessment is vital where high H2S peaks occur in confined spaces. Risk assessment should incorporate indices that account for peak exposure, utilizing variability measures like range and standard or geometric standard deviation to reflect the actual risk more accurately. For large datasets, a histogram is just as useful as statistical measures. This approach has revealed that not only wastewater workers but also water distribution network workers, can face unexpectedly high H2S levels when accessing confined underground spaces. Our research underscores the need for continuous monitoring with personal electrochemical gas detector alarm systems, particularly in environments with variable and potentially hazardous exposure levels.

Keywords: H2S; assessment strategies; exposure index; hydrogen sulfide; logbook; peak exposure; self-assessed data collection; wastewater.


Conflict of interest statement

The authors declare no conflict of interest relating to the material presented in this Article. Its contents, including any opinions and/or conclusions expressed, are solely those of the authors.

Figures

Fig. 1.
Fig. 1.
Illustration of the specifications, differences, and connections among the 3 datasets and publications. The boxes overlapping datasets B and C illustrate that the same people and equipment are involved. “Days” refers to days with measurements, and “months” refer to study duration. H2S measurements in dataset A are from a larger dataset which includes endotoxin and bioaerosol exposure measurements in a total study group of 149 persons. No measurement was duplicated between dataset B and dataset C. One person was in 2 groups in dataset A.
Fig. 2.
Fig. 2.
Index to TWA for H2S, separated into workdays with [N = 118 (squares)] and without [N = 404 (circles)] peaks exceeding 10 ppm. The bar at index value 21.4 symbolizes the lowest possible index value of measurement when exceeding 10 ppm during a workday. The 3 arches forming the bottom of the figure are due to the index algorithm multiplication at different levels of H2S. This is most visible when formed by measurements with a single data point above LOD. Regression values (coefficient of determination) for linear fit lines are R2total = 0.819, R2No = 0.758, R2yes, exceeding CV = 0.813. The axes are in logarithmic scale. The “Y” axis is in decimal scale in scientific notation. “1.E−1” equals 0.1 ppm. This is 1/20 of the OEL at 5 ppm.
Fig. 3.
Fig. 3.
Distribution of maximum H2S level in measurements for a workday with recording every 15 s, illustrating how common it was to reach different maximum levels of H2S in the water distribution network and wastewater-related work, and to exceed the ceiling value of 10 ppm. Total N = 522. Upper row: all measurements above LOD (mean 7.5 ppm, SD 3.9 ppm). Upper left: logarithmic “Y” axis. Upper right: stacked total on linear “Y” axis. Middle and bottom row separate for the SEGs. Linear axis in the same scale. Not corrected for group size.
Fig. 4.
Fig. 4.
Distribution of maximum H2S value per workday in ppm in measurement above 1.6 ppm, which was the mutual measurement area for the datasets. Differences in equipment and collection strategy affects the fractions. Values are binned as “<x<=”. Bin size is made by 1/10 of upper 10-integer, so that in the interval 2.1 to 10.0, the bin size is 1. From 10.1 to 100 it is 10. The bin endpoint 10.0, was chosen as this is the CV that should not be exceeded. Values between 1.7 and 2.0 are the first bin shown, as LOD for B and C sampling was 1.6 ppm. Values above 100 ppm are in one bin. In datasets B and C this equals overload of alarm equipment. Lines are broken when no fraction is present in the bin.

Similar articles

References

    1. Austigard AD, Smedbold HT.. Hydrogen sulphide (H2S) exposure hazard assessment: an algorithm for generating exposure index based on direct instrument readings. Ann Work Expo Health. 2022:66(1):124–129. 10.1093/annweh/wxab047 - DOI - PMC - PubMed
    1. Austigard AD, Smedbold HT, Svendsen K.. Risk characteristics of hydrogen sulphide exposure in wastewater collection and treatment related occupations. Ann Work Expo Health. 2023:67(2):12. 10.1093/annweh/wxac065 - DOI - PMC - PubMed
    1. Austigard AD, Svendsen K, Heldal KK.. Hydrogen sulphide exposure in waste water treatment. J Occup Med Toxicol. 2018:13:10. 10.1186/s12995-018-0191-z - DOI - PMC - PubMed
    1. Austigard ÅD, Smedbold HT, Svendsen K.. 2022b. Correlation of measured gas concentrations in four-gas alarm equipment data in wastewater related work. AIRMON conference Nov 7th-10th. Bristol, UK. 10.1093/annweh/wxac087.074 - DOI
    1. Bates MN, Garrett N, Shoemack P.. Investigation of health effects of hydrogen sulfide from a geothermal source. Arch Environ Health. 2002:57(5):405–411. 10.1080/00039890209601428 - DOI - PubMed

Publication types

LinkOut - more resources