. 2024 Aug 22;187(17):4770-4789.e23.
doi: 10.1016/j.cell.2024.06.019. Epub 2024 Jul 8.

A non-canonical role for a small nucleolar RNA in ribosome biogenesis and senescence

Affiliations

A non-canonical role for a small nucleolar RNA in ribosome biogenesis and senescence

Yujing Cheng et al. Cell. .

Abstract

Cellular senescence is an irreversible state of cell-cycle arrest induced by various stresses, including aberrant oncogene activation, telomere shortening, and DNA damage. Through a genome-wide screen, we discovered a conserved small nucleolar RNA (snoRNA), SNORA13, that is required for multiple forms of senescence in human cells and mice. Although SNORA13 guides the pseudouridylation of a conserved nucleotide in the ribosomal decoding center, loss of this snoRNA minimally impacts translation. Instead, we found that SNORA13 negatively regulates ribosome biogenesis. Senescence-inducing stress perturbs ribosome biogenesis, resulting in the accumulation of free ribosomal proteins (RPs) that trigger p53 activation. SNORA13 interacts directly with RPL23, decreasing its incorporation into maturing 60S subunits and, consequently, increasing the pool of free RPs, thereby promoting p53-mediated senescence. Thus, SNORA13 regulates ribosome biogenesis and the p53 pathway through a non-canonical mechanism distinct from its role in guiding RNA modification. These findings expand our understanding of snoRNA functions and their roles in cellular signaling.

Keywords: RPL23; SNORA13; nucleolar stress; p53; ribosome biogenesis; senescence; snoRNA.


Conflict of interest statement

Declaration of interests J.T.M. is a scientific advisor for Ribometrix, Inc. and owns equity in Orbital Therapeutics, Inc. H. Zhu is academic co-founder of Quotient Therapeutics and Jumble Therapeutics, has sponsored research agreements with Alnylam Pharmaceuticals and Chroma Medicines, and serves on the SAB of Newlimit and Ubiquitix. UTSW has filed a provisional patent on the inhibition of SNORA13 as a strategy to increase ribosome biogenesis.

Figures
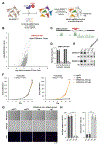
Figure 1.
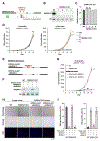
Figure 1.. Identification of EPB41L4A-AS1 as a noncoding RNA required for oncogene-induced senescence
(A) Overview of the genome-wide CRISPRi screen for noncoding RNAs required for OIS (created with BioRender.com). (B) Plot of gene enrichment (tamoxifen-treated/untreated cells) versus p value calculated by MAGeCK. (C) Schematic of EPB41L4A-AS1 locus showing location and conservation of SNORA13. UCSC Genome Browser PhastCons track shown in green. (D-E) qRT-PCR analysis of EPB41L4A-AS1 expression relative to GAPDH (D), or northern blot of SNORA13 and U6 snRNA (loading control) (E), in BJ-HRASG12V-dCas9KRAB cells after lentiviral expression of non-target (NT) or EPB41L4A-AS1-targeting sgRNAs. Indicated cells were treated with tamoxifen for 7 days. (F) Growth of BJ-HRASG12V-dCas9KRAB cells expressing the indicated sgRNAs in the absence (left) or presence of tamoxifen (right). (G) Cell morphology, SA-β-gal staining, and EdU incorporation of BJ-HRASG12V-dCas9KRAB cells expressing the indicated sgRNAs 15 days after addition of tamoxifen. (H) Quantification of SA-β-gal activity and EdU incorporation in (G). Data are represented as mean ± SD (n=3 biological replicates). p values were calculated by unpaired two-tailed student’s t-test comparing sgNT group (sgNT1 and sgNT2) to sgEPB41L4A-AS1 group (EPB41L4A-AS1 sg1 and sg2) (panels F,H). n.s., not significant; ****p≤0.0001. See also Figure S1.
Figure 2.
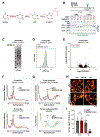
Figure 2.. SNORA13 is required for oncogene-induced senescence
(A) Schematic of dual guide CRISPR strategy for SNORA13 deletion. (B-C) Northern blot of SNORA13 and U6 snRNA (B), or qRT-PCR analysis of EPB41L4A-AS1 expression relative to GAPDH (C), in wild-type BJ-HRASG12V cells or four independent SNORA13 knockout clones. (D) Growth of wild-type or SNORA13 knockout BJ-HRASG12V cells in the absence (left) or presence of tamoxifen (right). (E) Schematic of EPB41L4A-AS1 rescue constructs with or without SNORA13. (F) Northern blot of SNORA13 and U6 snRNA in wild-type or SNORA13 knockout BJ-HRASG12V cells following stable transfection with empty vector or the indicated EPB41L4A-AS1 rescue constructs. (G) Growth of BJ-HRASG12V cells expressing the indicated EPB41L4A-AS1 rescue constructs in the presence of tamoxifen. (H) Cell morphology, SA-β-gal staining, and EdU incorporation of BJ-HRASG12V cells expressing the indicated EPB41L4A-AS1 rescue constructs 15 days after addition of tamoxifen. (I) Quantification of SA-β-gal activity and EdU incorporation in (H). Data are represented as mean ± SD (n=3 biological replicates). p values were calculated by unpaired two-tailed student’s t-test comparing all groups to WT (panels D,G,I). n.s., not significant; ****p≤0.0001. See also Figure S1.
Figure 3.
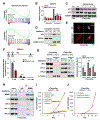
Figure 3.. SNORA13 guides pseudouridylation of 18S rRNA and negatively regulates 60S ribosomal subunit biogenesis
(A) Installation of m1acp3Ψ on human 18S:1248U. Figure modified from Sloan et al.. (B) HinF1 digestion assay to monitor 18S.1248m1acΨ. (C) Anti-puromycin western blot of wild-type or SNORA13 knockout BJ-HRASG12V cells pulsed with puromycin in the absence of tamoxifen. (D) Flow cytometry analysis of OP-Puro incorporation in wild-type or SNORA13 knockout BJ-HRASG12V cells in the absence of tamoxifen. (E) Volcano plot of translation efficiency (TE; defined as ribosome occupancy/mRNA abundance), as determined by ribosome profiling and RNA-seq, in SNORA13 knockout relative to wild-type BJ-HRASG12V cells treated with tamoxifen for 7 days. Transcripts with a statistically-significant increase or decrease in TE (p<0.01) highlighted in red. (F) Sucrose gradient fractionation of wild-type and SNORA13 knockout BJ-HRASG12V cells in the absence of tamoxifen (upper) or after 7 days of tamoxifen treatment (lower). (G) Sucrose gradient fractionation showing total ribosome levels (upper) or fluorescently-labeled newly synthesized 60S ribosomal subunits (lower) in HEK293T RPL28-SNAP cells after lentiviral expression of Cas9 and non-target sgRNA (sgNT) or sgRNA targeting SNORA13. (H) Images of pulse-labeled HEK293T RPL28-SNAP cells expressing Cas9 and the indicated sgRNAs immediately after labeling (0 hr) or 1 hour later. White arrowheads indicate nucleolar RPL28. (I) Quantification of nuclear RPL28 signal in (H). Data are represented as mean ± SD with individual data points shown (n=20 cells per condition). p values were calculated by unpaired two-tailed student’s t-test. n.s., not significant; ****p≤0.0001. See also Figures S2–S5.
Figure 4.
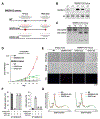
Figure 4.. SNORA13 regulates p53 activity through the nucleolar stress response pathway
(A) Gene set enrichment analysis (GSEA) showing downregulation of the p53 pathway in SNORA13 knockout BJ-HRASG12V cells at baseline or after tamoxifen treatment. (B) qRT-PCR analysis of CDKN1A expression relative to GAPDH in wild-type BJ-HRASG12V cells or four independent SNORA13 knockout clones at baseline or after tamoxifen treatment. (C-D) Western blots of total cell lysates (C) or nuclear and cytoplasmic fractions (D) in wild-type or SNORA13 knockout BJ-HRASG12V cells. (E) Immunofluorescence of p53 in tamoxifen-treated wild-type or SNORA13 knockout BJ-HRASG12V cells. (F) ChIP-qPCR of p53 binding at the CDKN1A promoter in tamoxifen-treated wild-type or SNORA13 knockout BJ-HRASG12V cells. (G) Western blots showing ribosome and non-ribosome associated RP levels in wild-type or SNORA13 knockout BJ-HRASG12V cells with or without tamoxifen treatment. Bar graph shows western blot quantification of ribosome-free RP levels in tamoxifen-treated cells (n=3 biological replicates). (H) Western blot of MDM2 co-immunoprecipitation with the indicated proteins in tamoxifen-treated wild-type or SNORA13 knockout BJ-HRASG12V cells. (I-J) Growth of tamoxifen-treated wild-type or SNORA13 knockout BJ-HRASG12V cells after MDM2 inhibition using siRNA (I) or Nutlin-3 (J). Tamoxifen treatment was carried out for 7 days for all experiments except panels I-J, where tamoxifen treatment was maintained throughout the experiment. Data are represented as mean ± SD (n=3 biological replicates). p values were calculated by unpaired two-tailed student’s t-test comparing groups to WT (panels B,F,G), SNORA13 KO siNonTarget (panel I), or SNORA13 KO (DMSO) (panel J). **p≤0.01, ***p≤0.001, ****p≤0.0001. See also Figure S6.
Figure 5.
Figure 5.. Regulation of ribosome biogenesis and senescence by SNORA13 are genetically separable from pseudouridylation
(A) Sequences of wild-type and mutant SNORA13 used for rescue experiments. (B) Northern blots showing expression of wild-type and mutant SNORA13 constructs. U6 snRNA served as a loading control. (C) HinF1 digestion assay for pseudouridylation of 18S:1248U in SNORA13 knockout cells reconstituted with wild-type or mutant SNORA13. Note that TSR3 was also knocked out in these cells to prevent the addition of acp, thereby enabling the specific detection of 18S:1248Ψ after treatment with CMC. (D) Growth of tamoxifen-treated wild-type or SNORA13 knockout BJ-HRASG12V cells reconstituted with wild-type or mutant SNORA13. (E) Cell morphology, SA-β-gal staining, and EdU incorporation of wild-type or SNORA13 knockout BJ-HRASG12V cells with or without rescue with SNORA13 mutants, 15 days after addition of tamoxifen. (F) Quantification of SA-β-gal activity and EdU incorporation in (E). (G) Sucrose gradient fractionation showing ribosomal subunit levels in SNORA13 mutant-expressing BJ-HRASG12V cells without tamoxifen treatment. Data representative of n=8 biological replicates. Data are represented as mean ± SD (n=3 biological replicates). p values were calculated by unpaired two-tailed student’s t-test comparing all groups to SNORA13 KO (panels D,F). ***p≤0.001, ****p≤0.0001. See also Figure S6.
Figure 6.
Figure 6.. SNORA13 directly interacts with ribosomal protein RPL23 and inhibits RPL23:28S rRNA interaction
(A) Schematic of UV-crosslinking and purification of the endogenous SNORA13 RNP to identify interacting proteins by mass spectrometry. (B) Volcano plot showing fold enrichment and significance of putative SNORA13 interacting proteins detected by mass spectrometry. H/ACA box snoRNP component DKC1 and RPL23 highlighted in red text. (C) qRT-PCR analysis of SNORA13 and SNORA25 in UV-RIP samples after pull-down of large and small subunit ribosomal proteins. Enrichment was normalized to input. Data are represented as mean ± SD with individual data points shown (n=3 biological replicates). (D) Western blots of ribosomal proteins after UV crosslinking and pull-down of SNORA13 with ASOs under denaturing conditions. SNORA13 sense oligonucleotides served as a negative control. (E) Coomassie stain of purified MBP-RPL23 protein used for in vitro binding experiments. (F) In vitro binding assays with purified MBP-RPL23 and SNORA13 or SNORA25. (G) Competitive binding assays with MBP-RPL23:28S rRNA4389-5070 and increasing concentrations of unlabeled SNORA13. SNORA13 concentration is expressed as fold excess over the concentration of 28S rRNA4389-5070 in the assay. See also Figure S7.
Figure 7.
Figure 7.. Mouse SNORA13 homologs are required for oncogene-induced senescence in hepatocytes in vivo
(A) Alignment of human SNORA13 with mouse homologs (GENCODE M33 annotation Gm25636, Gm23639, and Gm55482). H box (consensus ANANNA) and ACA box highlighted in gray. (B) Sucrose gradient fractionation of MEFs infected with lentivirus expressing Cas9 and control sgRNA (sgNT) or sgRNAs targeting all three mouse SNORA13 homologs (Triple KO). (C) Hydrodynamic transfection (HDT) was carried out by tail-vein injection of plasmids encoding a Sleeping Beauty transposon expressing NRASG12V, Cas9 and sgRNAs, and Sleeping Beauty transposase (SB100). Livers were analyzed 12 days post-injection. n=3 biological replicates for all tested conditions. Figure created with BioRender.com. (D) qRT-PCR analysis of snoRNA and Cdkn1a (encoding p21) expression relative to Actb in mouse liver after HDT. p values were calculated by unpaired two-tailed student’s t-test comparing all groups to sgControl. n.s., not significant; **p≤0.01, *p≤0.05. (E-G) Whole mount SA-β-gal staining (E), western blot analysis (F), and p21 immunohistochemistry and SA-β-gal staining (G) of liver after HDT of the indicated plasmids. See also Figure S8.

References

    1. Collado M, and Serrano M (2010). Senescence in tumours: evidence from mice and humans. Nat Rev Cancer 10, 51–57. 10.1038/nrc2772. - DOI - PMC - PubMed
    1. Mooi WJ, and Peeper DS (2006). Oncogene-induced cell senescence--halting on the road to cancer. N Engl J Med 355, 1037–1046. 10.1056/NEJMra062285. - DOI - PubMed
    1. Serrano M, Lin AW, McCurrach ME, Beach D, and Lowe SW (1997). Oncogenic ras provokes premature cell senescence associated with accumulation of p53 and p16INK4a. Cell 88, 593–602. 10.1016/s0092-8674(00)81902-9. - DOI - PubMed
    1. Collado M, Gil J, Efeyan A, Guerra C, Schuhmacher AJ, Barradas M, Benguria A, Zaballos A, Flores JM, Barbacid M, et al. (2005). Tumour biology: senescence in premalignant tumours. Nature 436, 642. 10.1038/436642a. - DOI - PubMed
    1. Collado M, and Serrano M (2006). The power and the promise of oncogene-induced senescence markers. Nat Rev Cancer 6, 472–476. 10.1038/nrc1884. - DOI - PubMed