. 2024 Aug;65(8):100590.
doi: 10.1016/j.jlr.2024.100590. Epub 2024 Jul 7.

Peridroplet mitochondria are associated with the severity of MASLD and the prevention of MASLD by diethyldithiocarbamate

Affiliations

Peridroplet mitochondria are associated with the severity of MASLD and the prevention of MASLD by diethyldithiocarbamate

Xiangyun Sun et al. J Lipid Res. 2024 Aug.

Abstract

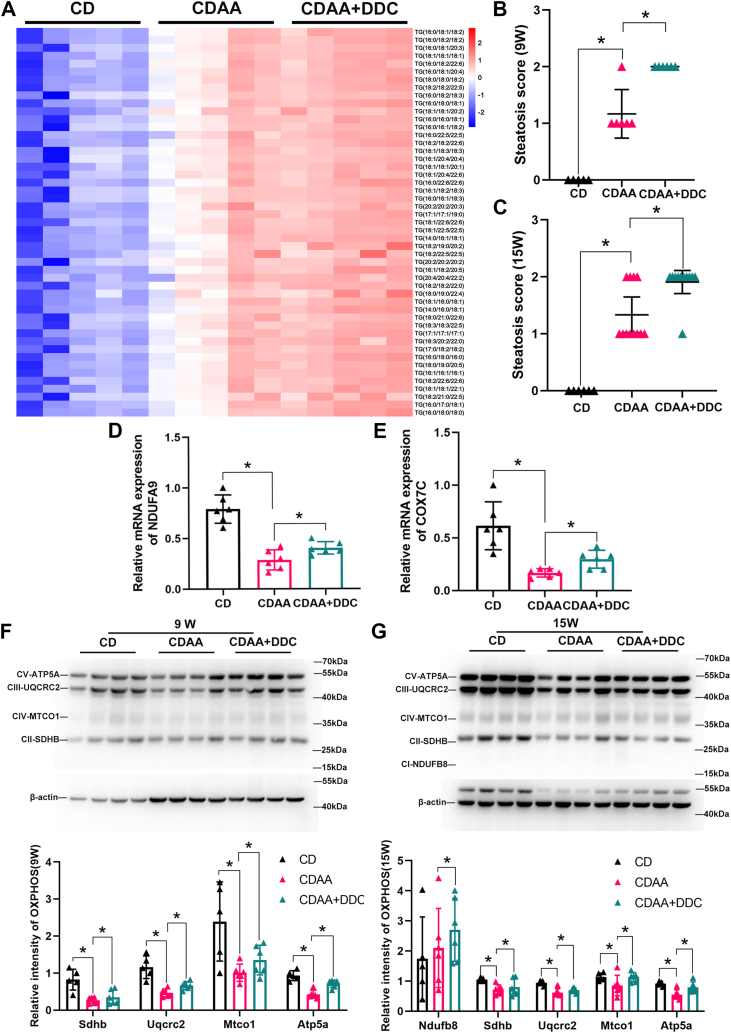
Mitochondria can contact lipid droplets (LDs) to form peridroplet mitochondria (PDM) which trap fatty acids in LDs by providing ATP for triglyceride synthesis and prevent lipotoxicity. However, the role of PDM in metabolic dysfunction associated steatotic liver disease (MASLD) is not clear. Here, the features of PDM in dietary MASLD models with different severity in mice were explored. Electron microscope photographs show that LDs and mitochondria rarely come into contact with each other in normal liver. In mice fed with high-fat diet, PDM can be observed in the liver as early as the beginning of steatosis in hepatocytes. For the first time, we show that PDM in mouse liver varies with the severity of MASLD. PDM and cytosolic mitochondria were isolated from the liver tissue of MASLD and analyzed by quantitative proteomics. Compared with cytosolic mitochondria, PDM have enhanced mitochondrial respiration and ATP synthesis. Diethyldithiocarbamate (DDC) alleviates choline-deficient, L-amino acid-defined diet-induced MASLD, while increases PDM in the liver. Similarly, DDC promotes the contact of mitochondria-LDs in steatotic C3A cells in vitro. Meanwhile, DDC promotes triglyceride synthesis and improves mitochondrial dysfunction in MASLD. In addition, DDC upregulates perilipin 5 both in vivo and in vitro, which is considered as a key regulator in PDM formation. Knockout of perilipin 5 inhibits the contact of mitochondria-LDs induced by DDC in C3A cells. These results demonstrate that PDM might be associated with the progression of MASLD and the prevention of MASLD by DDC.

Keywords: fatty acids; lipid droplets; perilipin 5; proteomics; steatotsis; triglyceride.


Conflict of interest statement

Conflicts of interest The authors declare that they have no conflicts of interest with the contents of this article.

Figures

Fig. 1
Fig. 1
PDM in mouse liver tissues with different severity of MASLD. Dietary MASLD models with different severity have been established. The normal mice were fed a chow diet (CD) for 9 weeks, the mice in mild steatosis were fed a WD diet for 2 weeks, the mice in mild MASH were fed a WD diet for 20 weeks, and the mice in advanced MASH were fed MCD diet for 8 weeks. (A) Representative H&E stainings of mouse liver tissues with different severity of MASLD (n = 5). Scale bars, 100 μm. (B) Representative Sirius Red stainings of mouse liver tissues with different severity of MASLD (n = 5). Scale bars, 100 μm. (C)Transmission electron micrographs of mouse liver tissues with different severity of MASLD (n = 5). Scale bars, 5 μm. Red arrows point to mitochondria which contact with LDs (PDM). MCD, methionine and choline deficient; MASH, metabolic dysfunction–associated steatohepatitis; MASLD, metabolic dysfunction–associated steatotic liver disease; PDM, peridroplet mitochondria; WD, Western diet.
Fig. 2
Fig. 2
Isolation of PDM and CM in steatotic liver of MASLD. (A) Schematic representation of PDM and CM isolation procedure. Eight-week-old male C57BL/6 mice were fed a WD diet for 20 weeks. The liver tissues were dissected from mice and homogenized. Low-speed centrifugation separated the fat layer containing PDM from supernatant containing CM. High-speed centrifugation stripped PDM from LDs and pelleted CM from the supernatant. (B) Confocal image of PDM in fraction 1 (fat layer) before high-speed centrifugation. Twenty-five microliters fat layer were taken and costained with MitoView™ Green (green) for mitochondria and LipidSpot™ 610 (red) for LDs (n = 5). White arrows point to the LDs surrounded by mitochondria (PDM). Scale bar, 5 μm. (C) Confocal images of isolated PDM. PDM were isolated from fat layer by high-speed centrifugation and were costained with MitoView™ Green (green) and LipidSpot™ 610 (red) (n = 5). Scale bar, 5 μm. (D) Confocal images of isolated CM. CM were isolated from fraction 2 (supernatant) by high-speed centrifugation and were costained with MitoView™ Green (green) and LipidSpot ™ 610 (red) (n = 5). Scale bar, 5 μm. CM, cytoplasmic mitochondria; LD, lipid droplet; PDM, peridroplet mitochondria; WD, Western diet.
Fig. 3
Fig. 3
The difference of OXPHOS complex and fatty acid β-oxidation–related proteins between PDM and CM in steatotic liver of MASLD. Eight-week-old male C57BL/6 mice were fed a WD diet for 20 weeks (A–E) Heat map and the higher levels of OXPHOS complex I–V–related proteins in PDM versus CM (n = 5). (F) Relative levels of fatty acid β-oxidation–related proteins in PDM versus CM (n = 5). (G) Western blot of antibodies of OXPHOS complex I–V in PDM and CM isolated from 20-week WD–induced steatotic liver of MASLD mice, and TOM20 was used as a loading control (n = 6). The semiquantification of OXPHOS complex I–V in PDM and CM isolated from 20-weeks WD-induced steatotic liver of MASLD mice (n = 6). First quantification of OXPHOS complex subunits were normalized to TOM20 loading control to obtain the raw data. For independent samples, the raw data of CM and PDM from each individual sample were normalized to the sum of PDM and CM in that sample as shown in the formula: PDMnormalized = PDMraw/PDMraw + CMraw, CMnormalized = CMraw/PDMraw + CMraw. (H) Relative levels of ATP content in PDM and CM isolated from 20-week WD–induced steatotic liver of MASLD mice (n = 6). The data are expressed as the mean ± SD and analysed by paired t test for comparing PDM and CM. ∗P < 0.05, denotes differences between the compared group. CM, cytoplasmic mitochondria; OXPHOS, oxidative phosphorylation; MASLD, metabolic dysfunction–associated steatotic liver disease; PDM, peridroplet mitochondria; WD, Western diet.
Fig. 4
Fig. 4
DDC alleviates hepatic fibrosis and inflammation in CDAA diet-induced MASH mice. Six-week-old male C57BL/6 mice were fed a CD diet or a CDAA diet for 15 weeks. The CDAA group were treated either with standard drinking water or 4 mg/ml DDC via daily drinking water. (A) Representative image of Sirius Red staining, scale bar, 50 μm. (B) The quantification of Sirius Red area (n = 6 for CD, n = 12 for CDAA, n = 11 for CDAA + DDC). (C) Representative image of IHC staining of α-SMA (n = 6), scale bar, 50 μm. (D) Relative mRNA levels of Collagen 1α2 in liver tissues (n = 6). (E) Representative image of H&E staining, scale bar, 50 μm. (F, G) Representative image of IHC staining of CD68 and quantification in the average of five randomly selected fields per section (20× magnification) (n = 6), scale bar, 50 μm. Data are expressed as mean ± SD and analyzed by one-way ANOVA with multiple comparisons and Tukey post hoc test. ∗P < 0.05, denotes differences between the compared group. CD, chow diet; CD68, cluster of differentiation 68; CDAA, choline-deficient l-amino acid–defined; CM, cytoplasmic mitochondria; DDC, diethyldithiocarbamate; IHC, immunohistochemistry; MASH, metabolic dysfunction–associated steatohepatitis; α-SMA, α-smooth muscle actin.
Fig. 5
Fig. 5
DDC promotes the formation of PDM in vivo. Six-week-old male C57BL/6 mice were fed a CD diet or a CDAA diet for 9 or 15 weeks. The CDAA group was treated either with standard drinking water or 4 mg/ml DDC via daily drinking water. (A) Representative image of electron micrographs of liver tissues from 9-week CDAA diet–induced MASH mice without or with DDC treatment showing mitochondria and LDs (n = 5). Scale bar, 5 μm. Red arrows point to mitochondria which contact with LD (PDM). Mitochondria were manually traced, and mitochondria contact with LD were defined as PDM, while the other mitochondria were defined as CM. PDM were quantified by count. n = 10 electron micrographs per sample. The raw data of PDM from each sample were normalized to the average value of LD perimeter. (B and C) Liver tissues of 15-week CDAA diet–induced MASH mice was homogenized and centrifugated at 1000 g to generate a floating fat layer containing PDM and a supernatant containing CM. Twenty-five microliters fat layer were taken and co-stained with MitoView™ Green (green) for mitochondria and LipidSpot™ 610 (red) for LDs (n = 5) in the panel B. White arrows point to the LDs surrounded by mitochondria (PDM). Then, PDM were isolated from fat layer by high-speed centrifugation at 12,000 g, and were stained with MitoView™ Green (green). Confocal images of isolated PDM (n = 5) in the panel C. Scale bar, 20 μm. (D) Relative quantification of PDM yield in liver tissue from 9-week CDAA diet–induced MASH mice and DDC-treated mice (n = 6). The data are expressed as the mean ± SD and analyzed by the Student’s t test for comparing two selected groups. ∗P < 0.05, denotes differences between the compared group. CD, chow diet; CM, cytoplasmic mitochondria; CDAA, choline-deficient l-amino acid–defined; DDC, diethyldithiocarbamate; LD, lipid droplet; MASH, metabolic dysfunction–associated steatohepatitis; PDM, peridroplet mitochondria.
Fig. 6
Fig. 6
DDC promotes TG synthesis and enhances mitochondrial respiration in the liver of CDAA diet–induced MASH mice. Male C57BL/6 mice were fed either CD or CDAA diets for 9 or 15 weeks, respectively. The CDAA group were treated either with standard drinking water or 4 mg/ml DDC via daily drinking water. (A) Liver tissue homogenates were harvested from 9-week CDAA diet–induced MASH mice for lipidomic analyses. Heatmap of different types of TGs expression from the indicated groups (n = 5 liver specimens per group). (B) Hepatic steatosis score for all mice in the average of 10 randomly selected fields per section of H&E staining (20 × magnification) in mice fed either CD or CDAA diets for 9 weeks (n = 5 for CD; n = 6 for CDAA; n = 6 for CDAA + DDC). (C) Hepatic steatosis score for all mice in the average of ten randomly selected fields per section of H&E staining (20× magnification) in mice fed either CD or CDAA diets for 15 weeks (n = 6 for CD; n = 12 for CDAA; n = 11 for CDAA + DDC). (D, E) Relative mRNA levels of Ndufa9 and Cox7c in liver tissues of 15-week CDAA diet–induced MASH mice (n = 6). (F) The total protein was extracted from the liver tissues. The OXPHOS complex II–V were detected by Western blot in the livers of 9-week mice (n = 6). Quantification of OXPHOS complex subunits normalized to β-actin loading control (G) The total protein was extracted from the liver tissues. The OXPHOS complex I–V were detected by Western blot in the livers of 15-week mice (n = 6). Quantification of OXPHOS complex subunits normalized to β-actin loading control data are expressed as mean ± SD and analyzed by one-way ANOVA with multiple comparisons and Tukey post hoc test. ∗P < 0.05, denotes differences between the compared group. CD, chow diet; CDAA, choline-deficient l-amino acid–defined; DDC, diethyldithiocarbamate; MASH, metabolic dysfunction–associated steatohepatitis; OXPHOS, oxidative phosphorylation; TG, triglyceride.
Fig. 7
Fig. 7
Plin5 is upregulated by DDC in the liver of CDAA diet-induced MASH mice. Male C57BL/6 mice were fed either CD or CDAA diets for 9 or 15 weeks, respectively. (A, B) RNAscope of chromogenic assays for Plin5 (red) and quantification of Plin5 in livers of 15-week mice (n = 6). Scale bars, 100 μm. (C, D) Relative mRNA levels of Plin5 detected by qPCR in livers of 9 and 15-week mice (n = 6). (E, F) Western blot analysis and relative density ratio of Plin5 to β-actin in livers of 9 and 15-week mice (n = 6). All data represent the mean ± SD. One-way ANOVA with Tukey post test. ∗P < 0.05. MASH, metabolic dysfunction–associated steatohepatitis; Plin5, perilipin 5; qPCR, quantitative real-time PCR; DDC, diethyldithiocarbamate; CD, chow diet; CDAA, choline-deficient l-amino acid–defined.
Fig. 8
Fig. 8
DDC promotes the contact of mitochondria-LDs through regulating PLIN5 in vitro. Mixture (OA: PA = 1: 10) were used to treat C3A cells without (FFAs) or with DDC (FFAs + DDC). (A) The C3A cells were stained with the LipidSpot™ 610 and MitoView™ Green and observed by confocal microscope. White arrows point to LDs. Scale bar, 10 μm. (n = 5). (B) Super-resolution confocal image staining of one cell in FFAs + DDC group. White arrows point to the contact of mitochondria-LDs. Scale bar, 10 μm. (C, D) The amount of LDs was assessed as the area of LipidSpot™ 610. And mitochondria-LD contact was assessed as the area of mitochondria colocalized with LDs. n ≥ 60 C3A cells analyzed per group from five independent experiments. (E) Relative mRNA levels of PLIN5 in C3A cells. The expression of target gene was normalized to that of β-ACTIN. These experiments were repeated at least three times. (n ≥ 3). (F) Western blot analysis of PLIN5 in C3A cells and relative density ratio of PLIN5 to β-ACTIN. These experiments were repeated at least three times. (n ≥ 3). (G) si-PLIN5 was transfected to silence the expression of PLIN5 in DDC-treated steatotic C3A cells. Relative mRNA levels of PLIN5 in C3A cells were detected by qPCR. These experiments were repeated at least three times. (n ≥ 3). (H) The C3A cells were stained with the LipidSpot™ 610 and MitoView™ Green and observed by confocal microscope. Scale bar, 10 μm. (n = 5). (I, J) The amount of LDs was assessed as the area of LipidSpot™ 610. And mitochondria-LDs contact was assessed as the area of mitochondria colocalized with LDs. n ≥60 C3A cells analyzed per group from five independent experiments. Hoechst 33,342 was used to visualize nuclei (blue) in the panels A, B, and H. All data represent the mean ± SD. Student’s t test for comparing two selected groups and one-way ANOVA with Tukey post test was used to compare multiple groups. ∗P < 0.05. DDC, diethyldithiocarbamate; PLIN5, perilipin 5; qPCR, quantitative real-time PCR; LD, lipid droplet; OA, oleic acid; LD, lipid droplet; PA, palmitic acid.

Similar articles

Cited by

References

    1. European Association for the Study of the L, European Association for the Study of D, European Association for the Study of O EASL-EASD-EASO Clinical Practice Guidelines for the management of non-alcoholic fatty liver disease. Diabetologia. 2016;59:1121–1140. - PubMed
    1. Grattagliano I., Montezinho L.P., Oliveira P.J., Fruhbeck G., Gomez-Ambrosi J., Montecucco F., et al. Targeting mitochondria to oppose the progression of nonalcoholic fatty liver disease. Biochem. Pharmacol. 2019;160:34–45. - PubMed
    1. Gluchowski N.L., Becuwe M., Walther T.C., Farese R.V., Jr. Lipid droplets and liver disease: from basic biology to clinical implications. Nat. Rev. Gastroenterol. Hepatol. 2017;14:343–355. - PMC - PubMed
    1. Jarc E., Petan T. Lipid droplets and the management of cellular stress. Yale J. Biol. Med. 2019;92:435–452. - PMC - PubMed
    1. Pereira-Dutra F.S., Teixeira L., de Souza Costa M.F., Bozza P.T. Fat, fight, and beyond: the multiple roles of lipid droplets in infections and inflammation. J. Leukoc. Biol. 2019;106:563–580. - PubMed

Publication types

LinkOut - more resources