. 2024 Jul 9;15(1):5748.
doi: 10.1038/s41467-024-50007-7.

Start codon variant in LAG3 is associated with decreased LAG-3 expression and increased risk of autoimmune thyroid disease

Affiliations

Start codon variant in LAG3 is associated with decreased LAG-3 expression and increased risk of autoimmune thyroid disease

Saedis Saevarsdottir et al. Nat Commun. .

Abstract

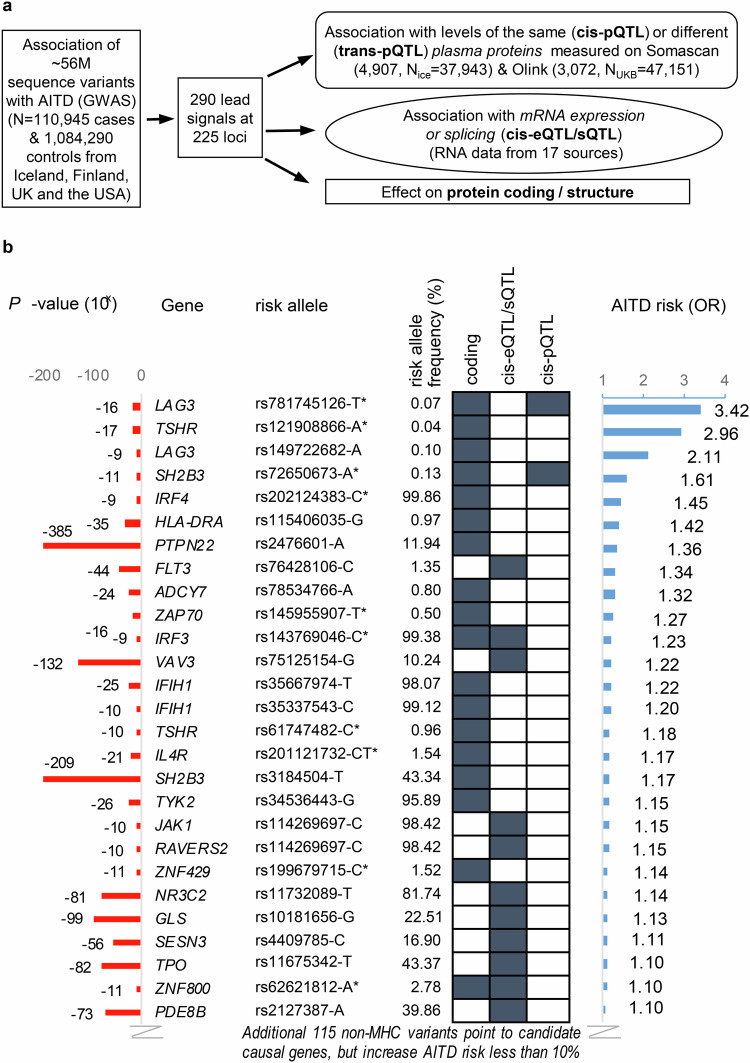
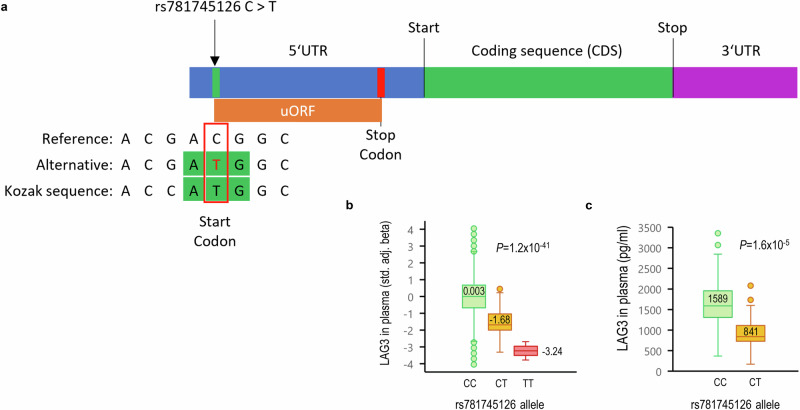
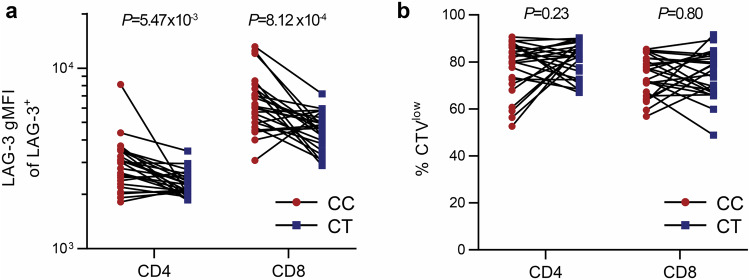
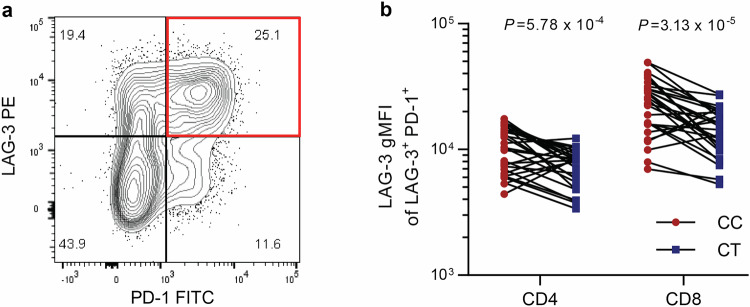
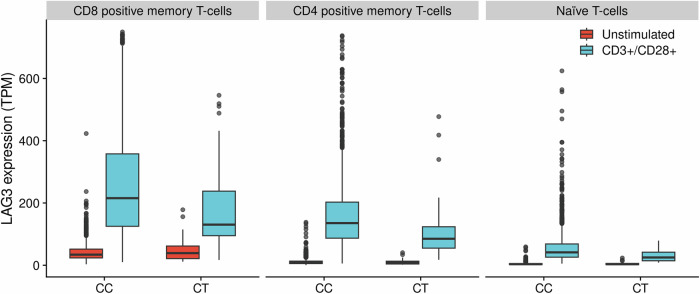
Autoimmune thyroid disease (AITD) is a common autoimmune disease. In a GWAS meta-analysis of 110,945 cases and 1,084,290 controls, 290 sequence variants at 225 loci are associated with AITD. Of these variants, 115 are previously unreported. Multiomics analysis yields 235 candidate genes outside the MHC-region and the findings highlight the importance of genes involved in T-cell regulation. A rare 5'-UTR variant (rs781745126-T, MAF = 0.13% in Iceland) in LAG3 has the largest effect (OR = 3.42, P = 2.2 × 10⁻¹⁶) and generates a novel start codon for an open reading frame upstream of the canonical protein translation initiation site. rs781745126-T reduces mRNA and surface expression of the inhibitory immune checkpoint LAG-3 co-receptor on activated lymphocyte subsets and halves LAG-3 levels in plasma among heterozygotes. All three homozygous carriers of rs781745126-T have AITD, of whom one also has two other T-cell mediated diseases, that is vitiligo and type 1 diabetes. rs781745126-T associates nominally with vitiligo (OR = 5.1, P = 6.5 × 10⁻³) but not with type 1 diabetes. Thus, the effect of rs781745126-T is akin to drugs that inhibit LAG-3, which unleash immune responses and can have thyroid dysfunction and vitiligo as adverse events. This illustrates how a multiomics approach can reveal potential drug targets and safety concerns.


Conflict of interest statement

S.S., K.B., T.M., J.B., T.A.O., G.H.H., G.R., K.G., A.O.A., S.H.L., L.S., J.G., A.S., A.O., B.V.H., E.F., E.V.I., G.S., G.M., G.H.E., G.A.T., K.K., K.H.S.M, S.A.G., S.R., H.H., O.T.M., P.S., D.F.G., T.R., G.T., P.M., G.L.N., I.J., and K.S. declare competing interests as employees of deCODE genetics/Amgen. The remaining authors declare no competing interests.

Figures

Fig. 1
Fig. 1. Multiomics approach to identify sequence variants that associate with autoimmune thyroid disease (AITD) and point to candidate causal genes.
a A GWAS meta-analysis on 110,945 cases and 1,084,290 controls from Iceland, Finland, UK and USA was performed to identify sequence variants that associate with AITD. For lead signals, a systematic variant annotation was applied, identifying AITD lead variants or correlated variants (r2 > 0.8) that affect protein coding (Supplementary Data 1 and 3), mRNA expression (top cis-eQTL or sQTL, Supplementary Data 4–6) or levels of proteins in plasma (top cis-pQTL, Supplementary Data 1 and Supplementary Data 7–8). b Out of 280 AITD lead variants outside the MHC-region, 141 sequence variants point to candidate genes, of which 25 variants pointing to 26 genes increased the risk of AITD by ≥10%, as shown in the figure, ranked by effect size (odds ratio, OR), calculated using logistic regression analysis assuming a multiplicative model, with two-sided P-values adjusted for year of birth, sex and origin (Iceland) or the first principal components (UK, USA), and Bonferroni adjustments for multiple comparisons, see details in Methods. In addition, the variant at the HLA locus with largest effect is shown. All effects are shown for the AITD risk increasing allele based on meta-analysis of study populations from Iceland, Finland, UK and USA. Previously unreported associations (GWAS catalog with P < 5 × 10−8) with AITD or related phenotypes (Graves’ disease, Hashimoto’s thyroiditis, hypo- or hyperthyroidism) are marked with *.
Fig. 2
Fig. 2. LAG3 5′ UTR variant rs781745126-T creates a novel upstream open reading frame (uORF) and associates with lower plasma levels of LAG-3.
a rs781745126-T creates a novel start codon, thereby generating a novel upstream open reading frame (uORF), that contains a STOP codon after 84 codons or 51 bp upstream of LAG-3 protein translation initiation site. rs781745126-T generates a stronger Kozak sequence than the reference LAG3 start codon has, which might reduce the use of the canonical start site, that could result in reduced levels of the LAG-3 protein. b Plasma levels of LAG-3 were measured using a proteome-wide screening with the aptamer-based SomaScan® platform in 37,943 Icelanders. rs781745126-T had the largest effect on LAG-3 levels (top cis-pQTL). The distribution of standardized beta adjusted values in two homozygote rs781745126-T carriers (TT), 93 heterozygote carriers (CT), and 37,848 non-carriers (CC) is shown by box-plots (outliers, 10th-90th percentile, interquartile range, median levels) and statistical comparison is calculated using linear regression of log-transformed protein levels against SNP allele count (see also Table 1). c Lower plasma levels in 66 rs781745126-T carriers (CT, median 841 pg/ml) than in 66 age and sex-matched non-carriers (CC, median 1589 pg/ml) were confirmed in Icelanders by another method, the antibody-based MSD assay (R-PLEX # F213Y-3, Meso Scale Diagnostics) and the distribution is shown as in figure b. The correlation (Spearman) between the two methods was high (R = 0.93, P < 2.2 × 10−16). All P-values are two-sided.
Fig. 3
Fig. 3. rs781745126-T carriers have reduced LAG-3 expression on surface of activated CD4+ and CD8+ T-cells.
Peripheral blood mononuclear cells (PBMCs) from 25 heterozygous rs781745126-T carriers (CT, blue) and 25 non-carrier controls (CC, red) matched for age and sex were stimulated with anti-CD3/anti-CD28 beads for 6 days to induce LAG-3 expression and proliferation. a LAG-3 surface expression on CD4+ and CD8+ T-cells (geometric mean fluorescense intensity, gMFI) and (b) frequency of proliferating cells analyzed on day 6, using cell trace violet (CTV) stain. Paired t-test with two-sided P-values was used to compare carriers (blue) and non-carriers (red).
Fig. 4
Fig. 4. Exhausted T-cells from rs781745126-T carriers express less LAG-3.
PBMCs from 28 heterozygous rs781745126-T carriers (CT) and 28 non-carrier controls (CC) matched for age and sex were stimulated for 48 h with Staphylococcal Enterotoxin B (SEB) to upregulate LAG-3 and PD-1 expression and induce exhaustion. a LAG-3+PD-1+ cells (red square) representing exhausted T-cells. b Surface expression intensity (geometric mean) of LAG-3 on double-positive LAG-3+PD-1+ exhausted CD4+ and CD8+ T-cells. Paired t-test with two-sided P-values was used to compare carriers (blue) and non-carriers (red).
Fig. 5
Fig. 5. rs781745126-T carriers have less LAG3 mRNA expression in stimulated T-cell subsets.
LAG3 expression was assessed in data from single-cell RNA (scRNA) sequencing (in-house data) of unstimulated (red) and stimulated (blue) peripheral mononuclear cells (PBMCs, 24-h stimulation with anti-CD3/anti-CD28) from 26 heterozygous carriers (CT) and 766 non-carriers (CC) of rs781745126-T. The y-axis shows the expression in TPM (Transcripts Per Million) and the distribution is shown by box-plots (outliers, 10–90th percentile, interquartile range, median levels). LAG3 expression was increased after stimulation, but this upregulation was lower among carriers of rs781745126-T than among non-carriers on CD8+ T-cells (43% lower, P = 1.06 × 10−5), CD4+ memory T-cells (35% lower, P = 8.59 × 10−4) and naïve T-cells (45% lower, P = 3.36 × 10−6). For all subsets and information about marker genes and cell type classification of scRNA-sequencing data, see Supplementary Data 12, Supplementary Data 13, Supplementary Information and “Methods” section. Two-sided P-values were computed using Satterthwaite’s method for mixed-effect models.

Similar articles

Cited by

References

    1. Antonelli A, Ferrari SM, Corrado A, Di Domenicantonio A, Fallahi P. Autoimmune thyroid disorders. Autoimmun. Rev. 2015;14:174–180. doi: 10.1016/j.autrev.2014.10.016. - DOI - PubMed
    1. Walsh JP. Managing thyroid disease in general practice. Med. J. Aust. 2016;205:179–184. doi: 10.5694/mja16.00545. - DOI - PubMed
    1. Hwangbo Y, Park YJ. Genome-wide association studies of autoimmune thyroid diseases, thyroid function, and thyroid cancer. Endocrinol. Metab. 2018;33:175–184,. doi: 10.3803/EnM.2018.33.2.175. - DOI - PMC - PubMed
    1. Saevarsdottir S, et al. FLT3 stop mutation increases FLT3 ligand level and risk of autoimmune thyroid disease. Nature. 2020;584:619–623. doi: 10.1038/s41586-020-2436-0. - DOI - PubMed
    1. Cooper JD, et al. Seven newly identified loci for autoimmune thyroid disease. Hum. Mol. Genet. 2012;21:5202–5208. doi: 10.1093/hmg/dds357. - DOI - PMC - PubMed