. 2024 Jul 9;15(1):5563.
doi: 10.1038/s41467-024-49339-1.

Structured connectivity in the output of the cerebellar cortex

Affiliations

Structured connectivity in the output of the cerebellar cortex

Kim M Gruver et al. Nat Commun. .

Abstract

The spatial organization of a neuronal circuit is critically important for its function since the location of neurons is often associated with function. In the cerebellum, the major output of the cerebellar cortex are synapses made from Purkinje cells onto neurons in the cerebellar nuclei, yet little has been known about the spatial organization of these synapses. We explored this question using whole-cell electrophysiology and optogenetics in acute sagittal cerebellar slices to produce spatial connectivity maps of cerebellar cortical output in mice. We observed non-random connectivity where Purkinje cell inputs clustered in cerebellar transverse zones: while many nuclear neurons received inputs from a single zone, several multi-zonal connectivity motifs were also observed. Single neurons receiving input from all four zones were overrepresented in our data. These findings reveal that the output of the cerebellar cortex is spatially structured and represents a locus for multimodal integration in the cerebellum.


Conflict of interest statement

The authors declare no competing interests.

Figures

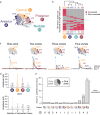
Fig. 1
Fig. 1. Cerebellar nuclear (CN) neurons receive both single- and multi-lobule input.
a Left, cartoon of a transgenic mouse showing location of 200 µm-thick acute slice. Right, Purkinje cells express Channelrhodopsin-2 (ChR2) fused with enhanced yellow fluorescent protein (EYFP), and project to CN neurons. b ChR2-EYFP (green) in Purkinje cells. c Expansion of box in b shows ChR2-EYFP expression is restricted to Purkinje cell puncta (green) in the CN, while CN neurons express NeuN (blue). d Stimulation protocol. Lightning bolts indicate a single 3 ms flash of 470 nm light focused on stimulation location. Middle, CN neurons were patch-clamped while Purkinje cell axons in each location (left, base of individual cerebellar lobules, which blue lobule highlighting stimulated lobule; right, axonal terminals) were stimulated. Bottom, the evoked IPSC was recorded following stimulation. Gray traces represent individual IPSCs, black traces indicate average. Blue rectangles indicate onset and duration of light pulse. Lobule average IPSC: 91.18 ± 10.53 pA; axonal terminals average IPSC: 340.82 ± 35.34 pA. e Connectivity map representing Purkinje cell – CN connectivity from cell shown in d. f Representation of hypotheses of Purkinje cell convergence on CN neurons. Top, Purkinje cells originating from a single lobule converge on a CN neuron (hypothesis #1); bottom, Purkinje cells originating from multiple lobules converge on a CN neuron (hypothesis #2). g Connectivity maps (top) and average evoked IPSCs (bottom) from CN neurons receiving input from 1 (left), 2 (middle), or 3 (right) lobules. h Percentage of cells connected to n lobules. i Average IPSC amplitude per cell with n connected lobules. j Sum of IPSC amplitudes per cell with n connected lobules. IPSC amplitudes compared using two-tailed non-parametric multiple comparison Mann–Whitney U test. 1 lobule vs. 4 lobules: P = 0.009; 1 lobule vs. 5 lobules: P = 0.003; 2 lobules vs. 5 lobules: P = 0.03. *P < 0.05, **P < 0.01. Unlabeled comparisons = not significantly different. n = 41 cells with functional connections out of 75 cells. Source data are provided as a Source Data file.
Fig. 2
Fig. 2. Purkinje cell—CN neuron connectivity is not random.
a Cartoon of cerebellar lobules (roman numerals) and zones (circles). b Heatmap representing lobule inputs (columns) to individual CN neurons (rows) displaying connected lobules (red) and unconnected lobules (gray). Dendrogram of lobules created with unsupervised hierarchical clustering (top) using the Hamming distances between lobules’ connectivity patterns with the unweighted average linkage reveals inputs cluster along functional zones (delineated by color, bottom). c Connectivity maps (top) and evoked IPSCs (bottom) from four CN neurons receiving input from one (left), two (middle left), three (middle right), and four (right) zones. Roman numerals beside traces indicate responsive lobule. d Top, average IPSC amplitude for each zone is not statistically different from other zones. Bottom, average IPSC amplitude per cell based on number of connected zones. e Comparison of the actual vs. predicted occurrence of cells with each zone combination found in our dataset. Dotted line represents equal occurrence of predicted and actual combinations. One-tailed P values represent the difference between the actual and predicted occurrence as determined using a binomial distribution test, with multiple hypothesis corrections performed using False Discovery Rate testing. Four zone over overrepresentation: P = 0.009. Inset shows proportion of CN neurons receiving input from one zone or multiple zones. IPSC amplitudes compared using non-parametric multiple comparison Mann–Whitney U test. **P < 0.01. Unlabeled comparisons = not significantly different. n = 41 cells with functional connections out of 75 cells Source data are provided as a Source Data file.
Fig. 3
Fig. 3. CN neurons with different input connectivity patterns are morphologically similar.
a Top, reconstruction of CN neurons from two-photon stack. Circle denotes cell receives input from the anterior (“A”) zone. Bottom, representative traces of spontaneous firing from CN neurons receiving input from the “A,” “C,” “N,” or “ACPN,” zones, respectively, obtained before breaking through into whole-cell configuration. For each trace, 100 pA y axis is indicated in corresponding color. bg Soma area, Sholl radius, branch index, primary dendrite quantity, total dendrite length, and firing rate for cells with different connectivity patterns, groups with <3 reconstructed cells were excluded. Morphological properties compared across connectivity patterns using two-tailed non-parametric multiple comparison Mann–Whitney U test. Unlabeled comparisons = not significantly different. n = 24 cells (bf), n = 18 cells (g) out of 75 cells. Source data are provided as a Source Data file.
Fig. 4
Fig. 4. CN neurons receiving input from all four zones are biased along the rostroventral-caudodorsal axis.
a 3-D representation of recorded cells using coordinates from the Allen Mouse Brain Atlas and rendered using Brainrender. b Left, expansion of inset in a depicting position of cells based on connectivity pattern. Right, cells in b, left categorized by number of input zones. c Rendering of fastigial CN depicting the rostroventral-caudodorsal (RV-CD) and rostrodorsal-caudoventral (RD-CV) axes. d Cartoons of two possible organization patterns within the CN, where one type of CN neurons receiving a pattern of Purkinje cell input do not demonstrate topographic organization (left, “Low R2”), and another where CN neurons receiving a particular pattern of Purkinje cell input exhibit topographic organization biased along a particular axis of the nucleus (right, “High R2”). e Top (from left to right), rendering of position in the sagittal plane of CN neurons that responded only to axonal terminal stimulation (No responsive lobules), and CN neurons that received input from one zone, two zones, three zones, and four zones. Bottom, same as in e, top, but showing the plotted points for each CN neuron in the rostral-caudal and ventral-dorsal axes. Dotted lines and R2 values in each graph represent the line of best fit for the neurons in each category. f Bootstrap analysis was used to assess the significance of observed R2 fits in e, shuffling data for 50,000 iterations to produce a large distribution of R2 values. Only the n Zones = 4 group has an R2 value that fell within lowest 5% of bootstrap values (one-tailed, P = 0.048, not corrected for multiple comparisons). Red dotted line indicates P = 0.05. gh Same as ef but along the mediolateral and ventral-dorsal axes. *P < 0.05. Unlabeled comparisons = not significantly different. n = 75 cells. C: caudal, D: dorsal, M: medial, R: rostral, V: ventral. Source data are provided as a Source Data file.
Fig. 5
Fig. 5. Purkinje cell puncta from different zones terminate in close proximity in the CN.
a Cartoon representing intracranial injections of fluorescent viruses into different areas of the cerebellar vermis. b Cartoon representing Purkinje cells labeled with virus injections depicted in c representative image of cerebellum with viruses expressed in different zones at 20x magnification. d Expansion of nucleus in c showing that Purkinje cells from different lobules target different areas of the CN, 20x magnification. e Expansion of numbered boxes in d showing Purkinje cell puncta from different zones in apposition to individual CN neurons, 63x magnification. f Cumulative probability of nearest neighbor distance of Purkinje cell puncta from different zones. Dashed lines: average soma diameter (blue, 17.5 microns) and dendrite length (red, 100.5 microns). Shaded rectangles: 95% confidence interval of nearest neighbor puncta across animals. N = 6 animals. Source data are provided as a Source Data file.
Fig. 6
Fig. 6. Small inputs from a single lobule are sufficient to alter CN output.
a Stimulation protocol. b Top, representative traces of spontaneous firing from a CN neuron during lobule stimulation before breaking into whole-cell configuration. Blue line with arrowhead indicates onset and duration of light pulse. Bottom, blue lines indicate duration of inter-spike interval (ISI) immediately following stimulation. c Voltage-clamp traces during stimulation from cell in b after breaking through to whole-cell configuration. d Top, ISI ratio calculated by dividing the ISI duration after stimulation with the average ISI duration per cell per trial. Bottom, for example trace from a cell with an ISI ratio of 1.57. e ISI ratios per cell for responsive lobules: 1.52 ± 0.17; non-responsive lobules: 1.04 ± 0.02. f ISI ratio vs. IPSC amplitude per cell, Pearson’s R2 correlation coefficient. Shaded area depicts 95% confidence interval of the ISI ratio of non-responsive lobules (≥1). Unlabeled comparisons = not significantly different. n = 3 cells out of 75 cells. Source data are provided as a Source Data file.

References

    1. King M, Hernandez-Castillo CR, Poldrack RA, Ivry RB, Diedrichsen J. Functional boundaries in the human cerebellum revealed by a multi-domain task battery. Nat. Neurosci. 2019;22:1371–1378. doi: 10.1038/s41593-019-0436-x. - DOI - PMC - PubMed
    1. Larivière R, et al. Sacs knockout mice present pathophysiological defects underlying autosomal recessive spastic ataxia of Charlevoix-saguenay. Hum. Mol. Genet. 2015;24:727–739. doi: 10.1093/hmg/ddu491. - DOI - PMC - PubMed
    1. Stoodley CJ, et al. Altered cerebellar connectivity in autism and cerebellar-mediated rescue of autism-related behaviors in mice. Nat. Neurosci. 2017;20:1744–1751. doi: 10.1038/s41593-017-0004-1. - DOI - PMC - PubMed
    1. Kelly E, et al. Regulation of autism-relevant behaviors by cerebellar–prefrontal cortical circuits. Nat. Neurosci. 2020;23:1102–1110. doi: 10.1038/s41593-020-0665-z. - DOI - PMC - PubMed
    1. Person AL, Raman IM. Purkinje neuron synchrony elicits time-locked spiking in the cerebellar nuclei. Nature. 2012;481:502–505. doi: 10.1038/nature10732. - DOI - PMC - PubMed

LinkOut - more resources