. 2024 Jul 9;15(1):5736.
doi: 10.1038/s41467-024-50045-1.

Self-powered triboelectric-responsive microneedles with controllable release of optogenetically engineered extracellular vesicles for intervertebral disc degeneration repair

Affiliations

Self-powered triboelectric-responsive microneedles with controllable release of optogenetically engineered extracellular vesicles for intervertebral disc degeneration repair

Weifeng Zhang et al. Nat Commun. .

Abstract

Excessive exercise is an etiological factor of intervertebral disc degeneration (IVDD). Engineered extracellular vesicles (EVs) exhibit excellent therapeutic potential for disease-modifying treatments. Herein, we fabricate an exercise self-powered triboelectric-responsive microneedle (MN) assay with the sustainable release of optogenetically engineered EVs for IVDD repair. Mechanically, exercise promotes cytosolic DNA sensing-mediated inflammatory activation in senescent nucleus pulposus (NP) cells (the master cell population for IVD homeostasis maintenance), which accelerates IVDD. TREX1 serves as a crucial nuclease, and disassembly of TRAM1-TREX1 complex disrupts the subcellular localization of TREX1, triggering TREX1-dependent genomic DNA damage during NP cell senescence. Optogenetically engineered EVs deliver TRAM1 protein into senescent NP cells, which effectively reconstructs the elimination function of TREX1. Triboelectric nanogenerator (TENG) harvests mechanical energy and triggers the controllable release of engineered EVs. Notably, an optogenetically engineered EV-based targeting treatment strategy is used for the treatment of IVDD, showing promising clinical potential for the treatment of degeneration-associated disorders.


Conflict of interest statement

The authors declare no competing interests.

Figures

Fig. 1
Fig. 1. Self-powered triboelectric-responsive MNs with controllable release of EXPLOR engineered EV for IVDD repair.
A Self-powered triboelectric-responsive EXPLOR engineered EV release for biologically targeted IVDD treatment via optically reversible protein-protein interactions. B EXPLOR engineered EV-delivered TRAM1 protein increased TRAM1-TREX1 complex assembly, blocking TREX1 nuclear localization and promoting TREX1 anchoring in the ER, which exhibited protective effects for cytosolic damaged DNA elimination, inhibited cGAS-STING axis activation-mediated inflammatory response and alleviated the progression of IVDD. C Schematic of EXPLOR engineered EV loading and release of triboelectric-responsive MNs using the electrochemical characteristics of polypyrrole (PPy). Polytetrafluoroethylene (PTFE) and indium tin oxide-polyester (ITO-PET) acted as two dissimilar frictional layers. Polylactic acid (PLA) and the Aurum (Au) layer acted as triboelectric-responsive MNs for controllable release of EXPLOR engineered EVs. D Wearable self-powered triboelectric-responsive MNs for controllable release of EXPLOR engineered EVs. E Electrical output under various motion frequencies ranging from 0.5 to 2.5 Hz, including Voc, Isc, and Qtr (Representative plot of three independent technical experiments).
Fig. 2
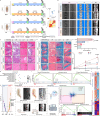
Fig. 2. Exercise accelerated the degenerative process of IVDs from surgical lumbar instability, similar to the clinical degeneration process.
A Schematic workflow for the establishment of a surgically LSI rat model and exercise intervention (n = 5 rats per group) (Created with BioRender.com). B X-ray, µCT, and MR images of the lumbar from rats undergoing sham surgery (Sham) or LSI surgery with (LSI-E) or without exercise intervention (LSI) for 8 weeks. C H&E staining and D SO&FG staining of lumbar 4th–lumbar 5th (L4-L5) IVDs from rats with the indicated treatment. Asterisks showed the large, round cells and cellular chondrogenic proliferation; triangles showed inwards bulging, thickened AF collagen lamellae and dashed lines showed the border between the NP and AF. Bar: 1 mm, 100 μm. E Pfirrmann MRI grading of rat IVDs with the indicated treatment for 8 weeks (n = 5 rats per group). F Histological score of rat IVDs with the indicated treatment for 8 weeks (n = 5 rats per group). G Upregulated inflammation-associated pathways by Gene Oncology (GO) analysis of differentially expressed genes (DEGs) between the LSI-E group and LSI group (n = 3 biological independent samples). H, I Enriched pathways by GSEA (Gene set enrichment analysis) between the LSI-E group and LSI group (n = 3 biological independent samples). J Gene expression heatmaps in the LSI-E and LSI group (n = 3 biological independent samples). K Schematic workflow for RNA sequencing (RNA-seq) of clinical normal and degenerated NP tissue samples and correlation analysis of overlapping DEGs between LSI-E group and LSI group and between degenerated and normal NP samples (n = 3 biological independent samples) (Created with BioRender.com). L Enriched pathways by GSEA in degenerated NP tissues (n = 3 biological independent samples). M Gene expression heatmaps of enriched pathways in normal and degenerated NP tissues (n = 3 biological independent samples). A significant p value was determined by two-tailed ANOVA (F) and Pearson’s correlation analysis (K). Mean ± SD are shown for (F).
Fig. 3
Fig. 3. TREX1 detachment from the ER and translocating to the nucleus were responsible for the elimination dysfunction of TREX1 and aberrant activation of the cytosolic DNA-sensing pathway.
A Upregulated “Cellular senescence” pathways and expression heatmaps between LSI and LSI-E group (n = 3 biological independent samples). B Expression heatmaps of senescence-associated secretory phenotype (SASP) genes from NP cells (n = 4 biological independent experiments). C Senescence-associated β-galactosidase (SA-β-gal) staining and quantitative analysis in NP cells (n = 4 biological independent experiments). D Representative western blotting images of cGAS, STING, and γH2A in NP cells (n = 4 biological independent experiments). E, F Representative DNA electrophoresis images (E) and quantitative analysis (F) of cytosolic DNA fragments in NP cells (n = 4 biological independent experiments). G Representative western blotting images of TREX1 in NP cells (n = 4 biological independent experiments). H, I Representative western blotting images of (H) and quantitative analysis (I) of cytosolic, nuclear, or total TREX1 protein in NP cells (n = 4 biological independent experiments). J Representative IF staining of TREX1 in NP cells, bar: 20 μm (Representative image of three independent technical experiments). K Schematic illustration of Flag-tagged TREX1 wide-type (TREX1-WT), Flag-tagged TREX1 D18N mutant (TREX1-Mut, 18th amino acid residue replaced aspartate with asparagine) and Flag-tagged N-terminus of TREX1 construct lacking a C-terminal ER-associated site (TREX1-NT, the anime-terminus from the 1st to 235th amino acids). L Representative western blotting images of Flag-tagged TREX1 variants and γH2A in NP cells after transfected with vector and Flag-tagged TREX1 variant plasmids (Representative blot of four independent technical experiments). M Quantitative analysis of western blotting results showing γH2A protein expression in NP cells (Quantification of three independent technical experiments). N, O Representative agarose gel electrophoresis images (N) and quantitative analysis (O) of cytosolic DNA fragments in NP cells (Representative blot of four independent technical experiments, and quantification of four independent technical experiments). A significant p value was determined by two-tailed unpaired t test (C, F, I) and two-tailed ANOVA (N, O). Mean ± SD are shown for (C, F, M, O). n.s. not significant.
Fig. 4
Fig. 4. Interactomic analysis revealed that disassembly of the TRAM1-TREX1 complex promoted TREX1 mislocalization and activation of cytosolic DNA-sensing pathway during NP cell senescence.
A Schematic workflow for TREX1 interactomic analysis via Co-IP and LC-MS using a specific anti-TREX1 antibody or control antibody in normal and senescent NP cells (n = 3 biological independent samples) (Created with BioRender.com). B Top 6 enriched KEGG pathways of the differential TREX1 interactome in normal NP cells and red-marked pathways were associated with protein processing in the ER. C Chordal graph of potential proteins in KEGG pathways involved “Protein location in ER” and “Protein processing in ER”. D Endogenous forward and reverse Co-IP assay to detect the interaction of TRAM1 and TREX1 in normal and senescent NP cells (Representative blot of three independent technical experiments). E Representative agarose gel electrophoresis images of DNA fragments from the cytosolic component in P8 NP cells after co-transfection with TRAM1-overexpressing plasmid and different Flag-tagged TREX1 variant plasmids (Representative blot of four independent technical experiments). F Quantitative analysis of cytosolic genomic DNA fragments in P8 NP cells after co-transfection with the TRAM1-overexpressing plasmid and different Flag-tagged TREX1 variant plasmids (Quantification of four independent technical experiments). G Representative IF staining images of TREX1 to show subcellular localization changes of TREX1 after TRAM1 overexpression (Representative image of three independent technical experiments), bar: 20 μm. A significant p value was determined by two-tailed ANOVA (F). Mean ± SD are shown for (F). n.s. not significant.
Fig. 5
Fig. 5. EXPLOR-engineered EVs alleviated the inflammatory senescence phenotype acquisition of NP cells via triboelectric-responsive delivery of TRAM1.
A Schematic workflow for EXPLOR-engineered EVs generation (Created with BioRender.com). B Representative IF staining of EGFP and mCherry in HEK-293T cells co-transfected with CIBN-EGFP-CD9 and CRY2-mCherry-TRAM1 plasmids with or without 460-nm laser stimulation (20 μW/cm2), bar: 20 μm (Representative image of three independent technical experiments). C Representative western blotting images of CRY2-mCherry-TRAM1, CIBN-EGFP-CD9, Alix, TSG, and CD63 from native or transfected cells and EVs (n = 3 biological independent experiments). D Nanoparticle tracking analysis (NTA) and representative transition electron microscope (TEM) images of native and engineered EVs, bar: 100 nm (Representative image of three independent technical experiments). E Representative IF staining of EGFP and mCherry in senescent NP cells after treatment with PBS, native or engineered EVs for 72 h (native EVs were labeled by DiO), bar: 20 μm (Representative image of three independent technical experiments). F Flow cytometry images to analyze the uptake of EVs in senescent NP cells after treatment with PBS, native or engineered EVs for 72 h (native EVs were labeled by PKH26 and DiO) (Representative plot of three independent technical experiments). G, H Representative western blotting images and quantitative analysis of cytosolic and nuclear TREX1 protein in senescent NP cells with the indicated treatments (Representative blot of four independent technical experiments). I Representative agarose gel electrophoresis images of cytosolic DNA fragments in senescent NP cells with the indicated treatments (n = 4 biological independent experiments). J Schematic of the preparation process and EV-release of triboelectric-responsive MNs. K Schematic workflow for senescent NP cells incubated with triboelectric-responsive MNs (Created with BioRender.com). L Representative western blotting images of cytosolic and nuclear TREX1 protein in senescent NP cells with the indicated treatments (Representative blot of three independent technical experiments). M, N Representative agarose gel electrophoresis images (M) and quantitative analysis (N) of cytosolic DNA fragments in senescent NP cells with the indicated treatments (Representative blot of four independent technical experiments). A significant p value was determined by two-tailed unpaired t test (H) and two-tailed ANOVA (N). Mean ± SD are shown for (N, H). n.s. not significant.
Fig. 6
Fig. 6. Self-powered triboelectric-responsive MN system alleviated the senescence-associated degenerative process of IVDs.
A Schematic workflow for the needle puncture-induced degeneration of rat coccygeal IVDs treated with triboelectric-responsive MNs (n = 5 rats per group). B Gross pictures of coccygeal IVD model wearing with different equipments. C Representative X-ray images and EVs in vivo imaging showing the EV release kinetics in coccygeal IVDs at different time points. D Representative µCT images of coccygeal IVDs at different time points. E MR T2-weighted images and Pfirrmann MRI grades of rat IVDs with indicated treatments. F SO&FG staining of rat IVDs with the indicated treatments. G IF staining of PKH26-labeled EVs or mCherry in rat IVDs with the indicated treatments. The arrows indicated the PKH26+ or mCherry+ NP cells. H IHC staining of TRAM1 in rat IVDs with the indicated treatments. The arrows indicated TRAM1+ NP cells. I IF staining of p-STING in rat IVDs with the indicated treatments. J Pfirrmann MRI grades of rat IVDs with indicated treatments. K Histological score of rat IVDs with the indicated treatments. L Quantitative analysis of PKH26+ or mCherry+ NP cell proportions in rat IVDs with the indicated treatments. M Quantitative analysis of the TRAM1+ NP cell proportion in rat IVDs with the indicated treatments. N Quantitative analysis of the fluorescence intensity of p-STING in rat IVDs with the indicated treatments. Representative images of five independent biological replicates, and quantification of five independent biological experiments (JN). A significant p value was determined by two-tailed ANOVA (JN). Mean ± SD are shown for (JN). n.s. not significant.

References

    1. Knezevic, N. N., Candido, K. D., Vlaeyen, J. W. S., Van Zundert, J. & Cohen, S. P. Low back pain. Lancet398, 78–92 (2021). - PubMed
    1. Cieza, A. et al. Global estimates of the need for rehabilitation based on the Global Burden of Disease study 2019: a systematic analysis for the Global Burden of Disease Study 2019. Lancet396, 2006–2017 (2021). - PMC - PubMed
    1. Hartvigsen, J. et al. What low back pain is and why we need to pay attention. Lancet391, 2356–2367 (2018). - PubMed
    1. Francisco, V. et al. A new immunometabolic perspective of intervertebral disc degeneration. Nat. Rev. Rheumatol.18, 47–60 (2022). - PubMed
    1. Andersson, G. B. Epidemiological features of chronic low-back pain. Lancet354, 581–585 (1999). - PubMed

MeSH terms