. 2024 Jul 10;15(1):5777.
doi: 10.1038/s41467-024-50132-3.

Whole exome sequencing analysis identifies genes for alcohol consumption

Affiliations

Whole exome sequencing analysis identifies genes for alcohol consumption

Jujiao Kang et al. Nat Commun. .

Abstract

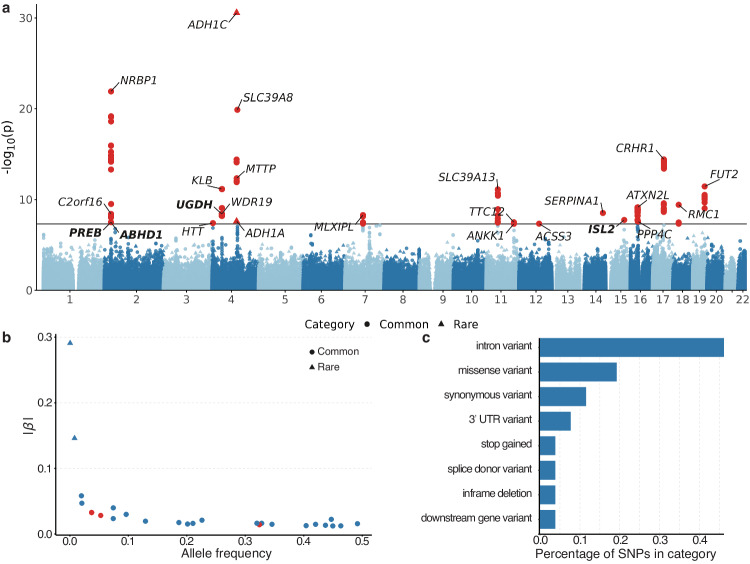
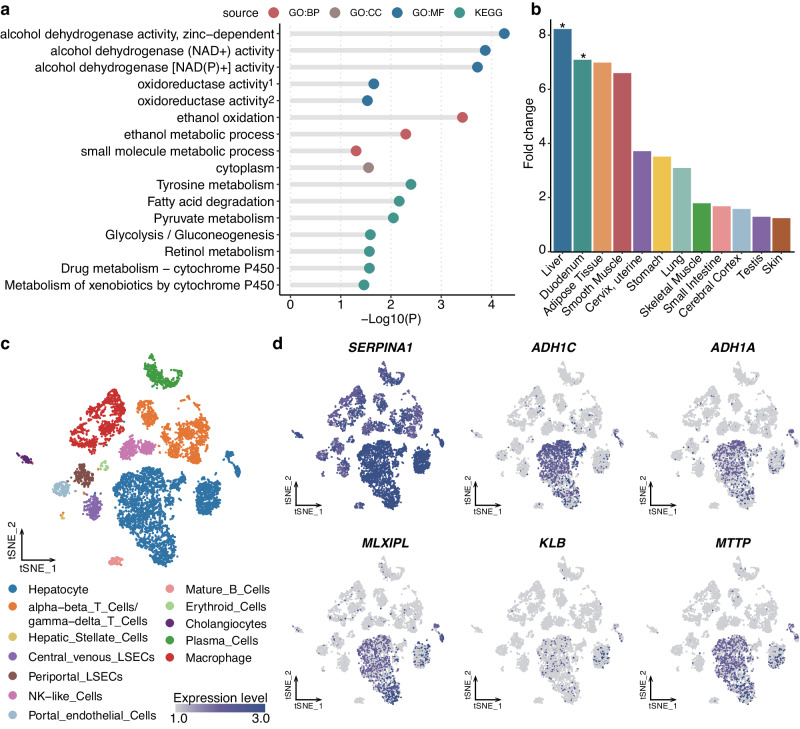
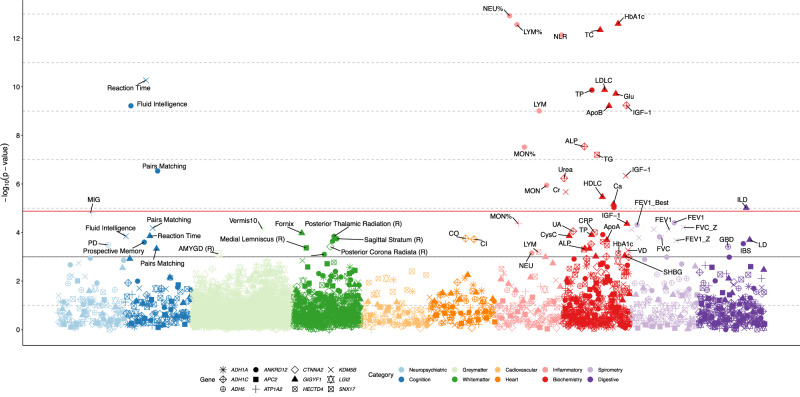
Alcohol consumption is a heritable behavior seriously endangers human health. However, genetic studies on alcohol consumption primarily focuses on common variants, while insights from rare coding variants are lacking. Here we leverage whole exome sequencing data across 304,119 white British individuals from UK Biobank to identify protein-coding variants associated with alcohol consumption. Twenty-five variants are associated with alcohol consumption through single variant analysis and thirteen genes through gene-based analysis, ten of which have not been reported previously. Notably, the two unreported alcohol consumption-related genes GIGYF1 and ANKRD12 show enrichment in brain function-related pathways including glial cell differentiation and are strongly expressed in the cerebellum. Phenome-wide association analyses reveal that alcohol consumption-related genes are associated with brain white matter integrity and risk of digestive and neuropsychiatric diseases. In summary, this study enhances the comprehension of the genetic architecture of alcohol consumption and implies biological mechanisms underlying alcohol-related adverse outcomes.


Conflict of interest statement

The authors declare no competing interests.

Figures

Fig. 1
Fig. 1. Study overview.
The top section outlines the data utilized in the study, including alcohol use, exome sequence data, and health-related phenotypes. The middle section outlines the identification of exome-wide significant genes, involving exome-wide association analysis, replication in the FinnGen cohort, and sensitivity analysis. The bottom-left section outlines biological functions analysis of the identified genes, including GO analysis, tissue expression enrichment analysis, cell-type expression, and lifespan spatio-temporal brain expression trajectory analysis. The bottom-right part focuses on exploring phenome-wide associations of the identified genes.GO Gene Ontology, PCW Post-conception weeks, RPKM Reads per kilobase million; tSNE t–Stochastic Neighbourhood Embedding. ‘image: Flaticon.com’. This cover has been designed using images from Flaticon.com.
Fig. 2
Fig. 2. Single-variant ExWAS of alcohol consumption.
a Manhattan plot showing the results of the common variants from ExWAS of alcohol consumption. SAIGE GENE+ was used to perform single-variant association tests (N = 304,119 biologically independent samples). The chromosomal position of the variant across the 22 chromosomes is represented on the x-axis, while the y-axis displays the -log10-transformed p-value. The significance threshold (P < 5 × 10−8) is denoted by the horizontal black line. Models are corrected for the top ten ancestral principal components, age, and sex. The presented p-values are two-sided and have not been adjusted for multiple testing. Significant variants were marked with red. Independent significant variants were marked with the nearby genes. Genes identified in this study were marked in bold. b Plot of effect size (absolute value) versus allele frequency of 22 previously reported alcohol consumption variants (blue) and 3 previously not reported alcohol consumption variants (red). c Distribution of the functional consequences of independent significant variants.
Fig. 3
Fig. 3. Gene-based ExWAS of alcohol consumption.
a Manhattan plot showing the results of the rare variants (LOF and Missense) from ExWAS of alcohol consumption with three different MAF thresholds in gene-based analysis. The x-axis represents the gene position on 22 chromosomes. The y-axis indicates the -log10-transformed p-value. Shape indicates combinations of different MAF groups and consequence groups, including LOF and Missense. The black horizontal line denotes the exome-wide significance level using Bonferroni correction (P < 2.5× 10−6). The black dashed horizontal line indicates significant associations at an overall FDR < 0.05(P < 1.69 × 10−5). Models are corrected for the top ten ancestral principal components, age, and sex. P-values are two-sided and unadjusted for multiple testing. Significant genes were marked with red. b Burden heritability of alcohol consumption in different groups. The x-axis denotes the different MAF groups (ultra-rare (MAF < 1 × 10−5) and rare (1 × 10−5 ≤ MAF < 1 × 10−2)). The color shows the LOF, Missense, and aggregation of the two groups. The y-axis indicates the burden heritability (h) in percent. Error bars indicate the standard error. c Plot of the effect sizes of burden test of the significant associations. N = 304,119 biologically independent samples were utilized in the analysis. For each gene, the most significant associations were plotted. Data presentation is in the form of β ± s.e. × 1.96. d The carrier percentage for rare LOF and missense variants in the alcohol consumption-related genes. The color of the bar indicates LOF (green) or missense (orange) groups of the variants.
Fig. 4
Fig. 4. Biological function of the alcohol consumption-related genes.
a Results of the functional enrichment analysis. The assessment of functional enrichment for the genes associated with alcohol consumption was assessed using the hypergeometric test. The g:SCS method was used for multiple testing correction. The x-axis indicates -log10 of the adjusted p-value for each term. The y-axis indicates different terms, and each source is marked with different colors. BP Biological process, GO Gene Ontology, MF Molecular function; KEGG, Kyoto Encyclopedia of Genes and Genomes. oxidoreductase activity, oxidoreductase activity, acting on the CH-OH group of donors, NAD or NADP as acceptor; oxidoreductase activity, oxidoreductase activity, acting on CH-OH group of donors. b The bar plot shows the tissue-specific gene enrichment. The x-axis represents various tissue types. The y-axis indicates the fold-change values of the tissue-specific gene enrichment. Tissues with nominal enrichment were marked with *. c The t–Stochastic Neighbourhood Embedding (tSNE) plot shows different cell types within the liver. The cell type is represented by the color of the dots. d The feature plot displaying the expression level of tissue-specific genes in different cell types within the liver. TPM transcripts per million.
Fig. 5
Fig. 5. Functional analysis of the rare-variant genes identified in our study.
a Top 10 genes with the most similar quantitative trait associations to ANKRD12 using exome-sequencing data in the UKB. b Enriched gene sets of ANKRD12 plus the top 10 similar genes of ANKRD12. Fisher’s exact test was performed by Gene-SCOUT. The x-axis indicates the PHRED score (−10×log10(P)), derived from Gene-SCOUT. c Expression of ANKRD12 and GIGYF1 in human tissues from the Human Protein Atlas. Abbreviations: nTPM, normalised transcripts per million. The top 20 tissues are included here; the complete plot is available in Supplementary Fig. 23. d Lifespan spatiotemporal expression trajectory of ANKRD12 in the human brain. Expression is shown in both prenatal and postnatal periods derived from mRNA-seq data of the PsychENCODE study . The x-axis denotes the age, represented in both post-conception weeks (prenatal) and years (postnatal), categorized into eight distinct periods: < 13 post-conception weeks (PCW)), 13-18 PCW, 19-23 PCW, 24-37 PCW, 0-2 years, 3−12 years, 13–19 years, and > 19 years. The y-axis depicts the log2-transformed expression value, given in reads per kilobase million (RPKM). Each brain region’s expression trajectory was visualized through a fitted non-linear LOESS regression line, accompanied by error bands (shaded areas) indicating the 95% confidence interval. e. Lifespan spatiotemporal expression trajectory of GIGYF1 in the human brain. The x-axis denotes the age, represented in both post-conception weeks (prenatal) and years (postnatal). The log2 transformed expression values were represented on the y-axis. Each brain region’s expression trajectory was illustrated through a fitted non-linear LOESS regression line, accompanied by error bands (shaded areas) denoting the 95% confidence interval.
Fig. 6
Fig. 6. Phenotypic associations of the rare-variant genes linked to alcohol consumption.
The x-axis represented various categories encompassing various phenotypes, including 10 neuropsychiatric diseases, 7 cardiovascular diseases, 19 digestive diseases, 10 cognition scores, 9 inflammatory traits, 30 blood biochemistry traits, 214 nervous traits (166 grey matter measures and 48 white matter measures), 8 heart structure measures, and 9 spirometry measures. For each phenotype-gene association, we applied three different maximum MAF cutoffs (0.01%, 0.1% and 1%) and two variant annotations (LOF and LOF+missense). The y-axis indicates the -log10 of the p-value for each association, with p-values adjusted for age, sex, and ten ancestral principal components. The red horizontal line denotes the threshold for significant association (P < 0.05/316/12 = 1.32 × 10−5), and the grey line signifies the threshold for a significant association to a lesser extent (P < 0.001). Presented p-values are two-sided and unadjusted for multiple testing. For each phenotype-gene association, the minimum p-value was plotted. Results for all genes at different variant frequencies and groups are presented in Supplementary Data 23. NEU% Neutrophill Percentage, HbA1c Glycated Haemoglobin (Hba1C), LYM% Lymphocyte Percentage, TC Cholesterol, NLR Neutrophill Lymphocyte Ratio, Reaction Time Mean Time To Correctly Identify Matches, LDLC Ldl Cholesterol, TP Total Protein, Glu Glucose; IGF-1, IGF1; Fluid Intelligence, Fluid Intelligence Score, ApoB Apolipoprotein B, LYM Lymphocyte Count, ALP Alkaline Phosphatase, MON%, Monocyte Percentage; TG, Triglycerides; Pairs Matching, Number Of Incorrect Matches In Round; Urea, Urea; MON, Monocyte Count; Cr, Creatinine, HDLC Hdl Cholesterol, Ca Calcium, ILD Inflammatory Liver Disease, MIG Migraine, FEV1 Forced Expiratory Volume In 1-Second (Fev1), FEV1_Best, Forced Expiratory Volume In 1-Second (Fev1), Best Measure; FVC_Z, Forced Vital Capacity (Fvc) Z-Score, Vermis10 Vermis_10, FEV1_predperc Forced Expiratory Volume In 1-Second (Fev1), Predicted Percentage; UA, Urate; CRP, C-Reactive Protein; Fornix, Fornix; CysC, Cystatin C; Posterior Thalamic Radiation (R), Posterior Thalamic Radiation (R), FVC, Forced Vital Capacity (Fvc); FVC_Best, Forced Vital Capacity (Fvc), Best Measure; CO, Cardiac Output, Sagittal Stratum (R), Sagittal Stratum (R); CI, Cardiac Index; LD, Liver Disease; ApoA, Apolipoprotein A, FEV1_Z Forced Expiratory Volume In 1-Second (Fev1) Z-Score, Posterior Corona Radiata (L), Posterior Corona Radiata (L), IBS Inflammatory Bowel Disease; PD, Parkinson’s Disease; GBD, Gallbladder Disease; Alb, Albumin, VD Vitamin D, NEU Neutrophill Count, AMYGD (R), Volume of right amygdala.

References

    1. Griswold MG, et al. Alcohol use and burden for 195 countries and territories, 1990-2016: a systematic analysis for the Global Burden of Disease Study 2016. Lancet. 2018;392:1015–1035. doi: 10.1016/S0140-6736(18)31310-2. - DOI - PMC - PubMed
    1. Freisthler B, Wolf JP, Hodge AI, Cao Y. Alcohol Use and Harm to Children by Parents and Other Adults. Child Maltreat. 2020;25:277–288. doi: 10.1177/1077559519878514. - DOI - PMC - PubMed
    1. Friesen EL, et al. Hazardous alcohol use and alcohol-related harm in rural and remote communities: a scoping review. Lancet Public Health. 2022;7:e177–e187. doi: 10.1016/S2468-2667(21)00159-6. - DOI - PubMed
    1. Rehm J, et al. The relationship of average volume of alcohol consumption and patterns of drinking to burden of disease: an overview. Addiction. 2003;98:1209–1228. doi: 10.1046/j.1360-0443.2003.00467.x. - DOI - PubMed
    1. Witkiewitz K, Litten RZ, Leggio L. Advances in the science and treatment of alcohol use disorder. Sci. Adv. 2019;5:eaax4043. doi: 10.1126/sciadv.aax4043. - DOI - PMC - PubMed

LinkOut - more resources