

Enhanced carbon dioxide drainage observed in digital rock under intermediate wetting conditions
- PMID: 38982117
- PMCID: PMC11233577
- DOI: 10.1038/s41598-024-65920-6
Enhanced carbon dioxide drainage observed in digital rock under intermediate wetting conditions
Abstract
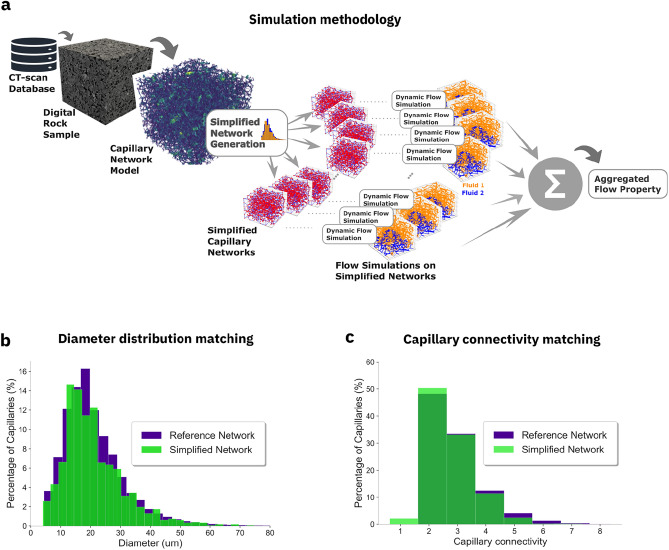
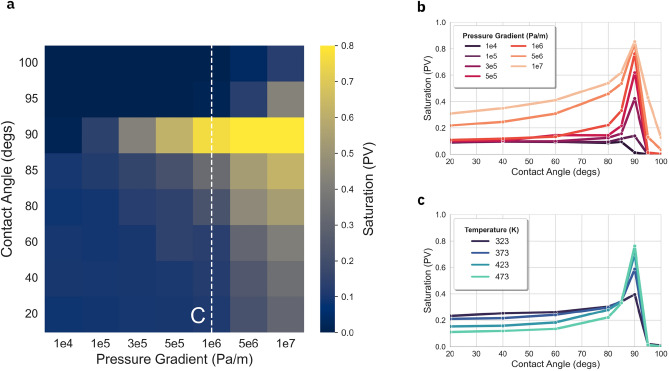
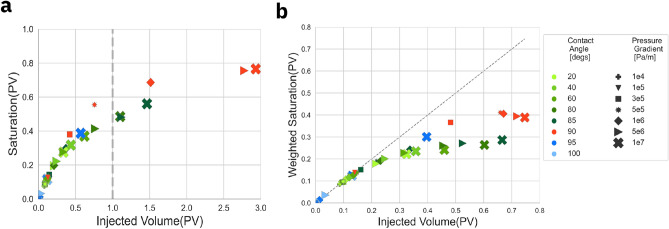
Carbon dioxide (CO ) trapping in capillary networks of reservoir rocks is a pathway to long-term geological storage. At pore scale, CO drainage displacement depends on injection pressure, temperature, and the rock's interaction with the surrounding fluids. Modeling this interaction requires adequate representations of both capillary volume and surface. For the lack of scalable representations, however, the prediction of a rock's CO storage potential has been challenging. Here, we report how to represent a rock's pore space by statistically sampled capillary networks (ssCN) that preserve morphological rock characteristics. We have used the ssCN method to simulate CO drainage within a representative sandstone sample at reservoir pressures and temperatures, exploring intermediate- and CO -wet conditions. This wetting regime is often neglected, despite evidence of plausibility. By raising pressure and temperature we observe increasing CO penetration within the capillary network. For contact angles approaching 90 , the CO saturation exhibits a pronounced maximum reaching 80 of the accessible pore volume. This is about twice as high as the saturation values reported previously. For enabling validation of our results and a broader application of our methodology, we have made available the rock tomography data, the digital rock computational workflows, and the ssCN models used in this study.
© 2024. The Author(s).
Conflict of interest statement
The authors declare no competing interests.
Figures
References
-
- Metz B, Davidson O, De Coninck H, Loos M, Meyer L. IPCC Special Report on Carbon Dioxide Capture and Storage. Cambridge: Cambridge University Press; 2005.
-
- Kramer D. Negative carbon dioxide emissions. Phys. Today. 2020;73:44–51. doi: 10.1063/PT.3.4389. - DOI
-
- Krevor S, et al. Capillary trapping for geologic carbon dioxide storage–from pore scale physics to field scale implications. Int. J. Greenhouse Gas Control. 2015;40:221–237. doi: 10.1016/j.ijggc.2015.04.006. - DOI
-
- Chiquet P, Broseta D, Thibeau S. Wettability alteration of caprock minerals by carbon dioxide. Geofluids. 2007;7:112–122. doi: 10.1111/j.1468-8123.2007.00168.x. - DOI
LinkOut - more resources
Full Text Sources
