. 2024 Jul 9;23(1):141.
doi: 10.1186/s12943-024-02051-6.

A positive feedback loop between PFKP and c-Myc drives head and neck squamous cell carcinoma progression

Affiliations

A positive feedback loop between PFKP and c-Myc drives head and neck squamous cell carcinoma progression

Weiwei Liu et al. Mol Cancer. .

Abstract

Background: The aberrant expression of phosphofructokinase-platelet (PFKP) plays a crucial role in the development of various human cancers by modifying diverse biological functions. However, the precise molecular mechanisms underlying the role of PFKP in head and neck squamous cell carcinoma (HNSCC) are not fully elucidated.

Methods: We assessed the expression levels of PFKP and c-Myc in tumor and adjacent normal tissues from 120 HNSCC patients. A series of in vitro and in vivo experiments were performed to explore the impact of the feedback loop between PFKP and c-Myc on HNSCC progression. Additionally, we explored the therapeutic effects of targeting PFKP and c-Myc in HNSCC using Patient-Derived Organoids (PDO), Cell Line-Derived Xenografts, and Patients-Derived Xenografts.

Results: Our findings indicated that PFKP is frequently upregulated in HNSCC tissues and cell lines, correlating with poor prognosis. Our in vitro and in vivo experiments demonstrate that elevated PFKP facilitates cell proliferation, angiogenesis, and metastasis in HNSCC. Mechanistically, PFKP increases the ERK-mediated stability of c-Myc, thereby driving progression of HNSCC. Moreover, c-Myc stimulates PFKP expression at the transcriptional level, thus forming a positive feedback loop between PFKP and c-Myc. Additionally, our multiple models demonstrate that co-targeting PFKP and c-Myc triggers synergistic anti-tumor effects in HNSCC.

Conclusion: Our study demonstrates the critical role of the PFKP/c-Myc positive feedback loop in driving HNSCC progression and suggests that simultaneously targeting PFKP and c-Myc may be a novel and effective therapeutic strategy for HNSCC.

Keywords: ERK; HNSCC; PFKP; Tumor progression; c-Myc.


Conflict of interest statement

The authors declare no competing interests.

Figures

Fig. 1
Fig. 1
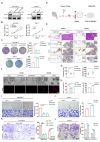
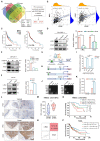
PFKP expression is upregulated in HNSCC and associated with poor prognosis. (A) Expression analysis of PFKP, PFKM, and PFKL in tumor and normal tissues using TCGA-HNSCC. (B) K-M plot for OS of HNSCC patients in TCGA dataset based on PFKP, PFKM and PFKL expression. High (n = 251) and low (n = 250) PFKP, PFKM and PFKL expression were stratified by the median expression level. (C) Representative IHC images illustrating PFKP staining in normal and tumor tissues. Scale bar, 100 μm. (D) Statistical analysis of the IHC results. (E) K-M plot depicting OS in HNSCC patients from our cohort. (F) Western blotting analysis of PFKP protein levels in paired normal and tumor tissues (n = 12). (G) and (H) Gene and protein expression of PFKP in NOK, CAL27, TU177, and LIU-LSC-1 cells, as detected by the qRT-PCR (G) and Western blotting (H). The error bars represent the mean ± SD of triplicate technical replicates. ***P < 0.001
Fig. 2
Fig. 2
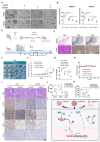
PFKP promotes the proliferation, angiogenesis, migration, and invasion of HNSCC cells. (A) LIU-LSC-1 cells were transduced with a lentivirus expressing shRNAs against PFKP (shPFKP#1 and shPFKP#2) or a scrambled sequence (shSc). TU177 cells were infected with control (vector) lentiviruses or lentiviruses encoding PFKP. The expression of PFKP was assessed by Western blotting. (B) CCK-8 assays were performed to evaluate cell growth rates of the indicated cells. (C) The effects of PFKP inhibition and overexpression on colony-forming ability were detected by colony-formation assays. (D) Schematic outline of the digestion and initial culture conditions of HNSCC organoids. (E) H&E staining and immunostaining for CK13, TP63, and Ki-67 of organoids and control tissue. Scale bars, 100 μm. (F) Representative images of organoid diameter and Ki-67 immunofluorescence intensity after knockdown or overexpression of PFKP. Scale bar, 40 μm. (G) Statistics of tumor organoid diameter (n = 30). (H) Bar graph of the proportion of Ki-67 + cells per organoid (n = 5). (I-J) The effect of PFKP on angiogenesis was determined by a tube formation assay. Representative image (left panels) and quantifications (right panels). Scale bar, 100 μm. (K-L) Transwell assays showed the migration and invasion rates in PFKP-knockdown LIU-LSC-1 cells and PFKP-overexpressing TU177 cells. Scale bar, 100 μm. Error bars indicate mean ± SD of triplicate (unless mentioned otherwise) samples. **P < 0.01; ***P < 0.001
Fig. 3
Fig. 3
The tumor-promoting effects of PFKP in vivo. (A-G) Subcutaneous inoculation of designated cells into nude mice was monitored for tumor growth. (A, D) Tumor images, (B, E) tumor volumes, (C, F) tumor weight, and (G) representative IHC images for PFKP, Ki-67, and CD31 in xenograft tissues. Scale bars, 100 μm. (H-I) the quantitative analysis results for PFKP, CD31 and Ki-67. Error bars indicate mean ± SD. ***P < 0.001. (J-K) Angiogenic effects of PFKP assessed via a CAM assay: Representative images (left panels) and statistical analysis (right panels). Error bars represent mean ± SD (n = 3 per group). ***P < 0.001. (L) The indicated LIU-LSC-1 cells were injected into nude mice. The figure shows lung images and H&E-stained sections from PFKP knockdown and control cell models. (M-O) Lung metastasis data: (M) Number of mice with metastases, (N) Number of lung nodules, (O) Lung weights. (P) Lung images and H&E-stained sections from a model using TU177 cells overexpressing PFKP and controls. (Q-S) Lung metastasis outcomes for PFKP overexpression: (O) Mice with metastases, (R) Lung nodules, (S) Lung weights. Error bars indicate mean ± SD (n = 5 mice/group). *P < 0.05. **P < 0.01; ***P < 0.001
Fig. 4
Fig. 4
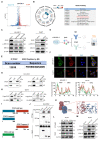
PFKP activates the MAPK/ERK pathway via ERK2. (A) Volcano plots showing differentially expressed genes (DEGs) expression (|log2FC| > 1 and p < 0.05) between shPFKP LIU-LSC-1 cells and the control cells. (B) KEGG pathway analysis showing the top 10 enriched pathways of DEGs. (C) Effect of PFKP depletion or overexpression on p-ERK1/2 and ERK1/2 levels in HNSCC cells by Western blotting. (D) Schematic workflow of the IP-PFKP experiments. (E) IP of PFKP, followed by MS analysis, to identify ERK2 binding to PFKP. (F) Representative immunofluorescence images showing the co-localization of PFKP and ERK2 in HNSCC cells. The intensity profiles of PFKP and ERK2 along the white line were plotted. Scale bars, 10 μm. (G) Co-IP assays reveal the endogenous interaction between PRKP and ERK2 in LIU-LSC-1 cells. (H) TU177 cells were co-transfected with FLAG-PFKP and HA-ERK2 plasmids and subjected to IP for FLAG and HA, respectively. (I) Schematic structure of the PFKP full-length protein and domains. (J) The co-IP assay to assess the interaction between ERK2 and different domains of PFKP. (K) Molecular docking model of ERK2 interacting with domain 2 of PFKP. (L) Co-IP assay to identify the amino acid sites of PFKP binding to ERK2 in TU177 cells with different PFKP mutants. (M) Effect of PFKP mutation on p-ERK and ERK levels in HNSCC cells by Western blotting
Fig. 5
Fig. 5
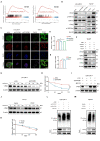
PFKP promotes the ERK-mediated c-Myc stability. (A) GSEA was performed in the TCGA-HNSCC cohort to reveal the association between PFKP and the activation of the HALLMARK_MYC_TARGET pathway. (B) Protein levels of p-ERK1/2, ERK1/2, c-Myc, and p-S62-Myc were analyzed by the Western blotting in LIU-LSC-1 and TU177 cells. (C) Representative immunofluorescence images of LIU-LSC-1 and TU177 cells treated with different treatments as indicated. Scale bars, 40 μm. (D-E) the qRT-PCR was used to detect the mRNA levels of c-Myc in LIU-LSC-1 cells transfected with PFKP shRNA and TU177 cells transfected with overexpressed PFKP, respectively. (F) Protein levels of ERK2, p-ERK1/2, and c-Myc were analyzed by the Western blotting in TU177 cells. (G and H) Effect of protein synthesis inhibitor CHX (20 µM) on c-Myc stability in PFKP-depleted LIU-LSC-1 cells over time. Protein expression of PFKP and c-Myc stability by Western blotting (left) and semi-quantification (right). (I) The Western blotting was preformed to assess the protein levels of c-Myc in knockdown of PFKP with addition of MG132. (J and K) Effect of CHX on c-Myc stability in PFKP-overexpressing TU177 cells. (L and M) c-Myc polyubiquitination was detected by anti-Ub immunoblotting in PFKP shRNAs LIU-LSC-1 cells (L) and LvPFKP TU177 cells (M), respectively
Fig. 6
Fig. 6
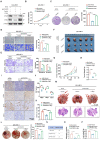
The c-Myc-mediated function of PFKP promotes proliferation, angiogenesis, and metastasis of HNSCC cells. (A) shPFKP LIU-LSC-1 cells were infected with lentiviruses harboring a vector encoding human c-Myc or the empty vector. The cell lysates were subjected to immunoblotting. (B) and (C) Cell proliferation (B) and colony formation (C) assays were carried out using cells as described in (A). Representative images (left) and corresponding quantification (right) of survival colonies are displayed. (D) For tube formation assays, LIU-LSC-1 cells (3.5 × 104) were mixed with conditioned media and incubated for 12 h on Matrigel. Representative micrographs of tube formation assay (left panel). Scale bars, 100 μm. Quantifications of total branching points per microscopic field from three independent experiments were analyzed by WimTube (right panel). (E) Cell migration and invasion abilities of the indicated cells were measured by transwell assays (left panel: representative images; right panel: statistical analysis). Scale bars, 100 μm. (F-K) The indicated cells were inoculated subcutaneously into nude mice, followed by monitoring tumor growth. Tumor images (F), tumor volumes at the indicated times (G), tumor weight (H), representative IHC images of PFKP, c-Myc, CD31, and Ki-67 staining of subcutaneous xenograft tissues (I), and the quantitative analysis results of IHC (J-K). **P < 0.01; ***P < 0.001. Scale bars, 100 μm. (L) The indicated cells were subjected to CAM assays. Representative images (left panel) and statistical analysis (right panel) are shown. (M-P) The indicated LIU-LSC-1 cells were injected into nude mice via the tail vein (n = 5 mice/group). (M) Representative images of lungs (Scale bar, 1 cm) and H&E-stained lung sections (Scale bar, 1 mm) showing metastatic lesions generated from the indicated cells after tail vein injections. (N) The number of metastatic lung nodules. (O) Lung metastatic nodules of all animals. (P) Lung weight of all animals. Error bars represent the mean ± SD of triplicate technical replicates. ***P < 0.001
Fig. 7
Fig. 7
c-Myc stimulates transcription of the PFKP gene (A) Venn diagram of transcription factors (TFs) positively correlated with the PFKP expression levels in TCGA-HNSCC. (B) Pearson’s correlation analysis of PFKP with MYC and CTCF using the TCGA cohort. (C) The K-M analysis on the association between MYC or CTCF mRNA levels and OS in TCGA. (D) LIU-LSC-1 cells expressing siRNAs targeting c-Myc or control. Western blotting and qRT-PCR were used to measure protein and mRNA levels. (E) LIU-LSC-1 cells were treated with 20 µM or 50 µM 10,058-F4 for 24 h. The samples were subjected to Western blotting and qRT-PCR analyses. (F) PFKP expression detected in the cells by Western blotting and qRT-PCR. (G) Schematic of the c-myc-binding site on human PFKP gene. (H) HEK-293T cells co-transfected with the indicated promoter constructs and pGL3-c-Myc or empty pGL3, plus the internal control plasmid pRL-TK. (I) Luciferase activity measured 24 h post-transfection. (J) HIF-1α antibody-immunoprecipitated DNA from these cells was amplified and quantified by qRT-PCR for NBR and PBR regions. (K) The data are plotted as the ratio of immunoprecipitated DNA subtracting nonspecific binding to IgG vs. total input DNA (%). (L) Representative IHC images of c-Myc and PFKP staining of the normal and tumor tissues. Scale bar, 100 μm. (M) H-score statistical analysis of c-Myc and PFKP IHC staining of normal and tumor tissues. (N) Correlation between c-Myc and PFKP expression of tumor tissues. The square in the upper right corner shows the Pearson correlation value between the indicated genes. The scatterplot matrix fitted trend lines for the indicated genes are shown in the square in the lower left corner. (O-P) K-M curves of OS stratified by PFKP and c-Myc in TCGA-HNSCC (O) and our cohort (P). Error bars represent the mean ± SD of triplicates. *P < 0.05, **P < 0.01, ***P < 0.001
Fig. 8
Fig. 8
The co-treatment of both PFKP inhibition and 10,058-F4 has inhibitory effect on growth in PDO and PDX models. (A) Effects of sh-PFKP and 10,058-F4 on the viability of PDO cells (scale bar, 40 μm). (B) Measurement of the growth of PDO in response to knocking down PFKP and 10,058-F4. ***P < 0.001. (C-I) Effects of 10,058-F4 combined with PFKP siRNAs on LIU-LSC-1 xenograft tumor growth. (C) Schematic illustration of experimental design and timeline. (D) IHC staining of PFKP and c-Myc in paracancerous and HNSCC tissues (scale bar, 100 μm). Tumor images (E), tumor volume (F), tumor weight (G), and body weight (H) are shown. **P < 0.01, ***P < 0.001. (I) Representative IHC images of PFKP, c-Myc, Ki-67, and CD31 staining for indication of the PDX tumors (scale bar, 100 μm). (J-K) the quantitative analysis results for PFKP, c-Myc, CD31 and Ki-67. Error bars indicate mean ± SD. ***P < 0.001. (L) Schematic diagram illustrating the feedback loop formed by PFKP and c-Myc that promotes HNSCC proliferation, angiogenesis, and metastasis. Schematic was developed with BioRender (www.biorender.com)

References

    1. Ferlay J, Colombet M, Soerjomataram I, Mathers C, Parkin DM, Piñeros M, Znaor A, Bray F. Estimating the global cancer incidence and mortality in 2018: GLOBOCAN sources and methods. Int J Cancer. 2019;144:1941–53. doi: 10.1002/ijc.31937. - DOI - PubMed
    1. Sung H, Ferlay J, Siegel RL, Laversanne M, Soerjomataram I, Jemal A, Bray F. Global Cancer statistics 2020: GLOBOCAN estimates of incidence and Mortality Worldwide for 36 cancers in 185 countries. CA Cancer J Clin. 2021;71:209–49. doi: 10.3322/caac.21660. - DOI - PubMed
    1. Cramer JD, Burtness B, Le QT, Ferris RL. The changing therapeutic landscape of head and neck cancer. Nat Rev Clin Oncol. 2019;16:669–83. doi: 10.1038/s41571-019-0227-z. - DOI - PubMed
    1. Johnson DE, Burtness B, Leemans CR, Lui VWY, Bauman JE, Grandis JR. Head and neck squamous cell carcinoma. Nat Rev Dis Primers. 2020;6:92. doi: 10.1038/s41572-020-00224-3. - DOI - PMC - PubMed
    1. Gu Z, Yao Y, Yang G, Zhu G, Tian Z, Wang R, Wu Q, Wang Y, Wu Y, Chen L, et al. Pharmacogenomic landscape of head and neck squamous cell carcinoma informs precision oncology therapy. Sci Transl Med. 2022;14:eabo5987. doi: 10.1126/scitranslmed.abo5987. - DOI - PubMed

MeSH terms