

Deciphering the molecular landscape of rheumatoid arthritis offers new insights into the stratified treatment for the condition
- PMID: 38983856
- PMCID: PMC11232074
- DOI: 10.3389/fimmu.2024.1391848
Deciphering the molecular landscape of rheumatoid arthritis offers new insights into the stratified treatment for the condition
Abstract
Background: For Rheumatoid Arthritis (RA), a long-term chronic illness, it is essential to identify and describe patient subtypes with comparable goal status and molecular biomarkers. This study aims to develop and validate a new subtyping scheme that integrates genome-scale transcriptomic profiles of RA peripheral blood genes, providing a fresh perspective for stratified treatments.
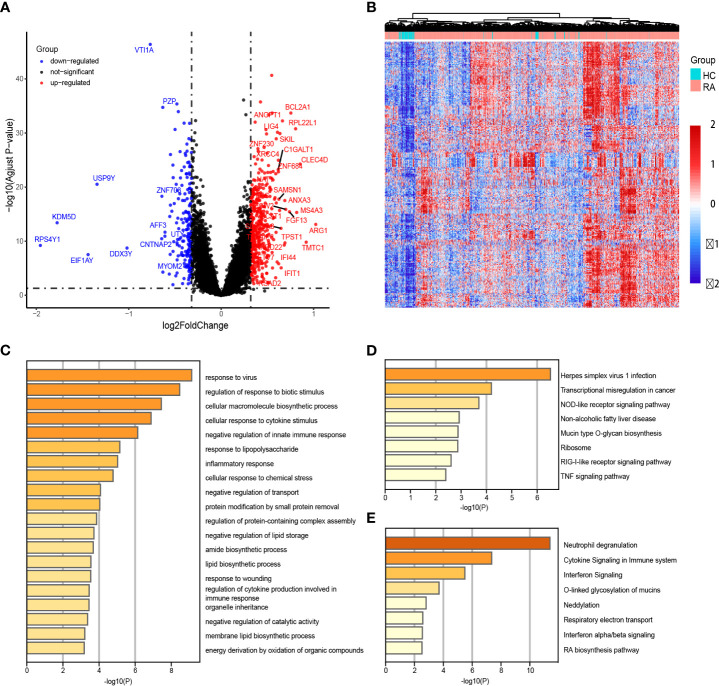
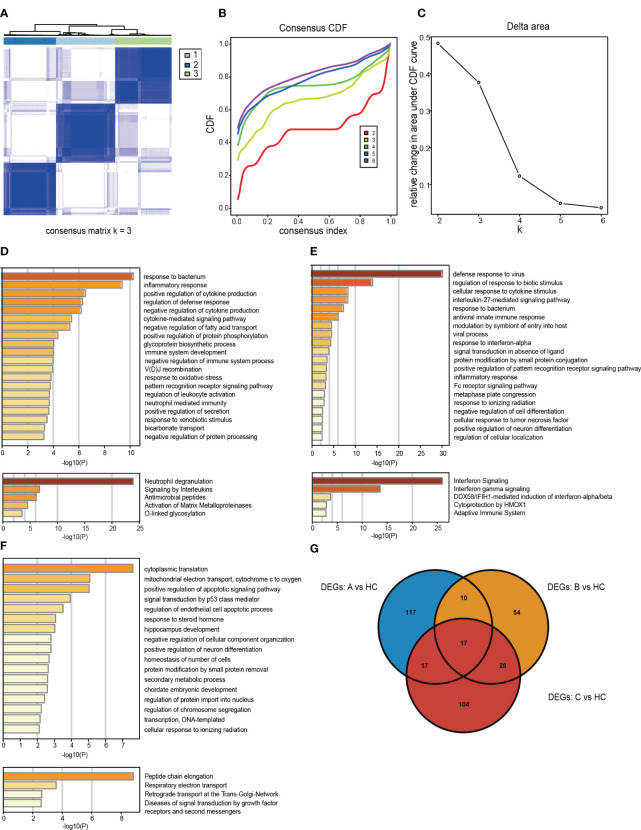
Methods: We utilized independent microarray datasets of RA peripheral blood mononuclear cells (PBMCs). Up-regulated differentially expressed genes (DEGs) were subjected to functional enrichment analysis. Unsupervised cluster analysis was then employed to identify RA peripheral blood gene expression-driven subtypes. We defined three distinct clustering subtypes based on the identified 404 up-regulated DEGs.
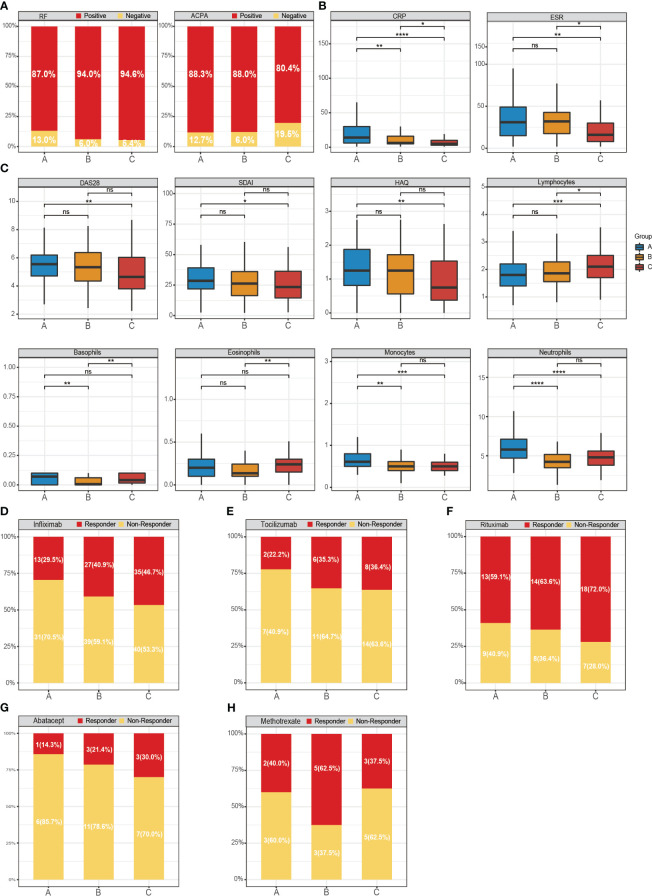
Results: Subtype A, named NE-driving, was enriched in pathways related to neutrophil activation and responses to bacteria. Subtype B, termed interferon-driving (IFN-driving), exhibited abundant B cells and showed increased expression of transcripts involved in IFN signaling and defense responses to viruses. In Subtype C, an enrichment of CD8+ T-cells was found, ultimately defining it as CD8+ T-cells-driving. The RA subtyping scheme was validated using the XGBoost machine learning algorithm. We also evaluated the therapeutic outcomes of biological disease-modifying anti-rheumatic drugs.
Conclusions: The findings provide valuable insights for deep stratification, enabling the design of molecular diagnosis and serving as a reference for stratified therapy in RA patients in the future.
Keywords: gene expression profiles; machine learning; rheumatoid arthritis; stratification; unsupervised clustering.
Copyright © 2024 Chang, Feng, Hao, Zhang, Zhao, Li, Zhao, Han, He and Wang.
Conflict of interest statement
The authors declare that the research was conducted in the absence of any commercial or financial relationships that could be construed as a potential conflict of interest.
Figures


Similar articles
-
Deep stratification by transcriptome molecular characters for precision treatment of patients with systemic lupus erythematosus.Rheumatology (Oxford). 2023 Jul 5;62(7):2574-2584. doi: 10.1093/rheumatology/keac625. Rheumatology (Oxford). 2023. PMID: 36308437
-
Dynamics of Type I and Type II Interferon Signature Determines Responsiveness to Anti-TNF Therapy in Rheumatoid Arthritis.Front Immunol. 2022 Jun 6;13:901437. doi: 10.3389/fimmu.2022.901437. eCollection 2022. Front Immunol. 2022. PMID: 35734167 Free PMC article.
-
Identification of novel biomarkers and candidate small molecule drugs in rheumatoid arthritis and osteoarthritis based on bioinformatics analysis of high-throughput data.Biosci Rep. 2020 Dec 23;40(12):BSR20193823. doi: 10.1042/BSR20193823. Biosci Rep. 2020. PMID: 33325525 Free PMC article.
-
Secretory Phenotype in Peripheral Blood Mononuclear Cells of Elderly Patients with Rheumatoid Arthritis.Rejuvenation Res. 2024 Aug;27(4):122-130. doi: 10.1089/rej.2024.0008. Epub 2024 Jun 26. Rejuvenation Res. 2024. PMID: 38814828
-
Transcriptomic insights into the mechanism of action of telomere-related biomarkers in rheumatoid arthritis.Front Immunol. 2025 May 22;16:1585895. doi: 10.3389/fimmu.2025.1585895. eCollection 2025. Front Immunol. 2025. PMID: 40475761 Free PMC article.
Cited by
-
Identification and experimental validation of Alzheimer's disease hub genes via bioinformatics and machine learning.J Alzheimers Dis Rep. 2025 Jul 15;9:25424823251356300. doi: 10.1177/25424823251356300. eCollection 2025 Jan-Dec. J Alzheimers Dis Rep. 2025. PMID: 40678591 Free PMC article.
References
-
- Evnouchidou I, Birtley J, Seregin S, Papakyriakou A, Zervoudi E, Samiotaki M, et al. . A common single nucleotide polymorphism in endoplasmic reticulum aminopeptidase 2 induces a specificity switch that leads to altered antigen processing. J Immunol. (2012) 189:2383–92. doi: 10.4049/jimmunol.1200918 - DOI - PMC - PubMed
MeSH terms
Substances
LinkOut - more resources
Full Text Sources
Medical
Research Materials