. 2024 Jun 25:15:1422369.
doi: 10.3389/fphar.2024.1422369. eCollection 2024.

NDRG1 acts as an oncogene in triple-negative breast cancer and its loss sensitizes cells to mitochondrial iron chelation

Affiliations

NDRG1 acts as an oncogene in triple-negative breast cancer and its loss sensitizes cells to mitochondrial iron chelation

Sukanya B Jadhav et al. Front Pharmacol. .

Abstract

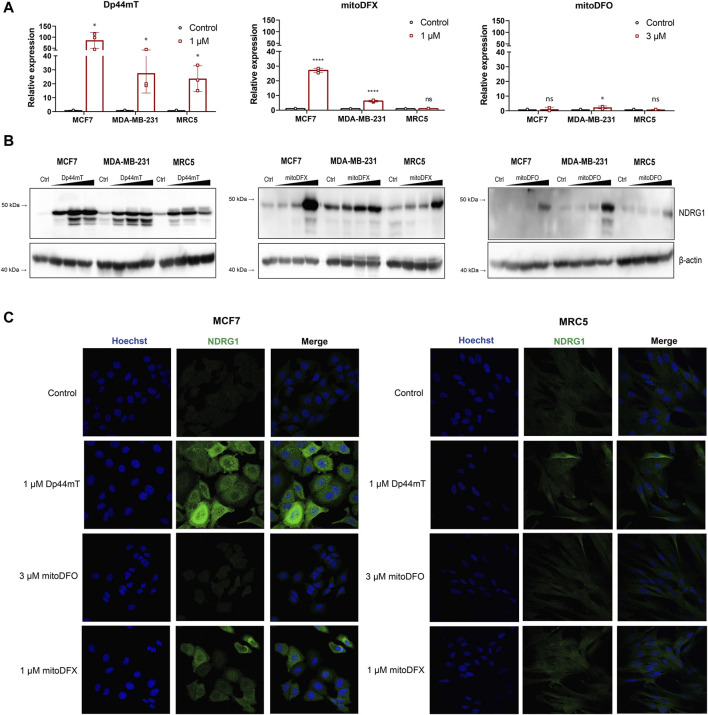
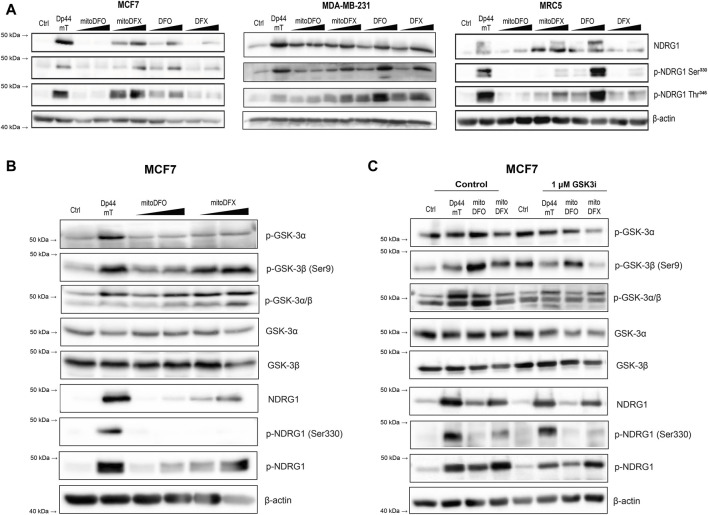
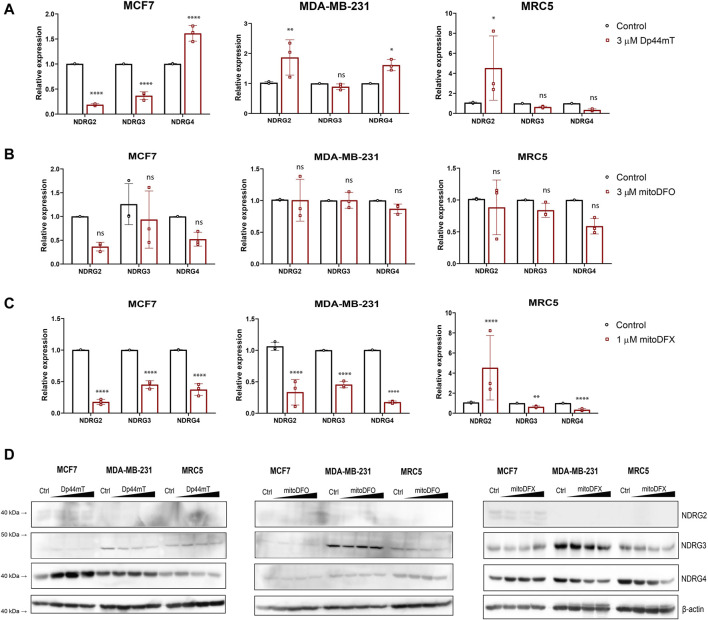
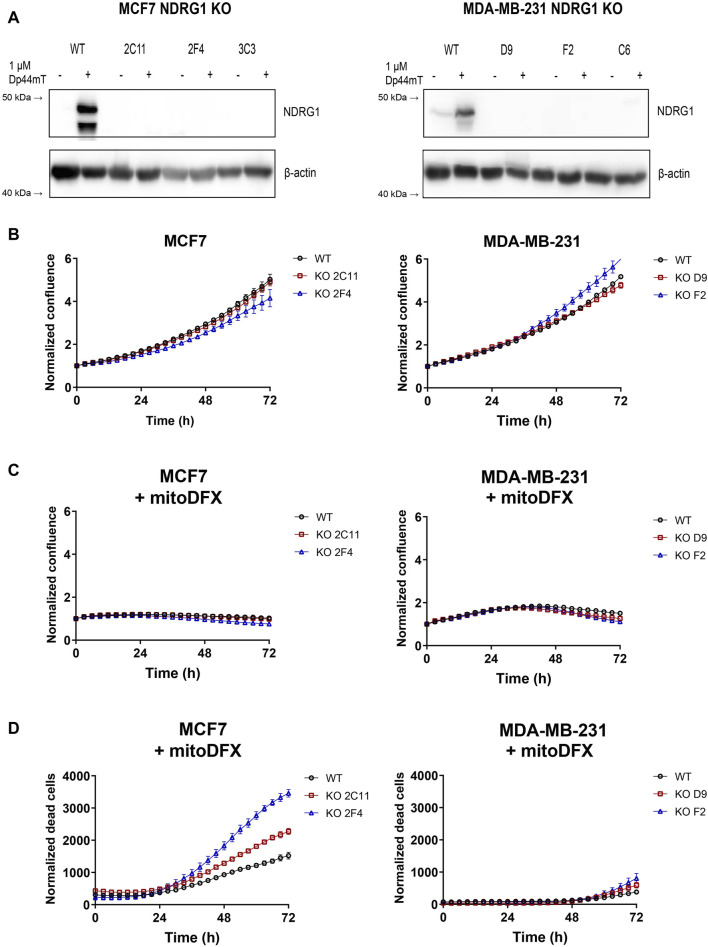
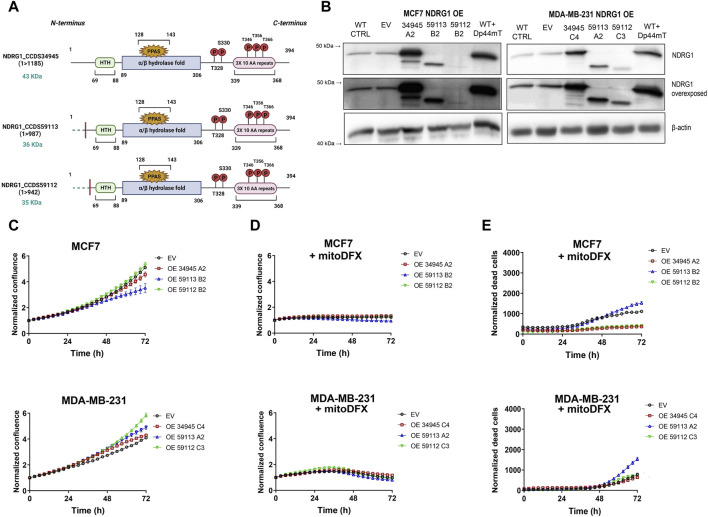
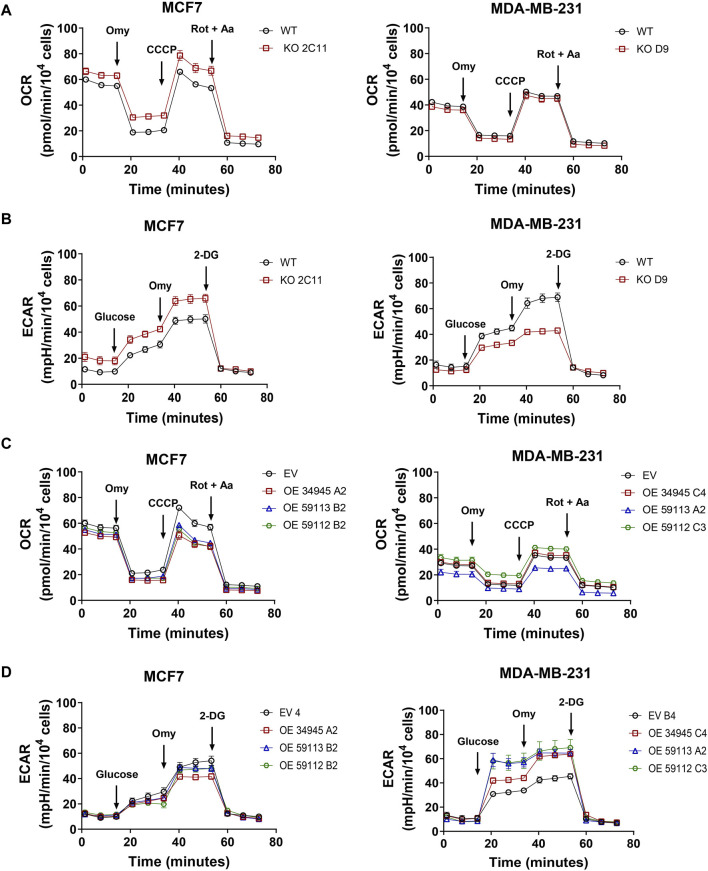
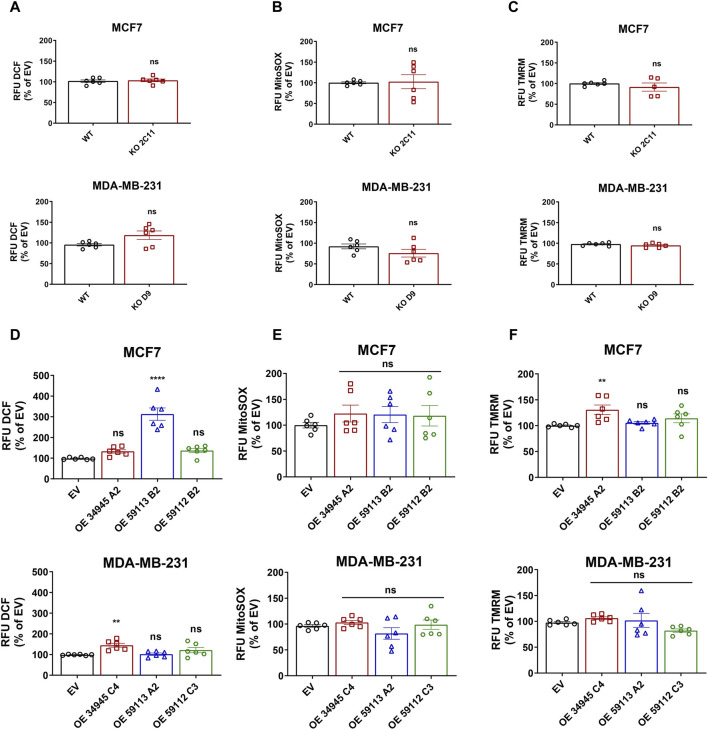
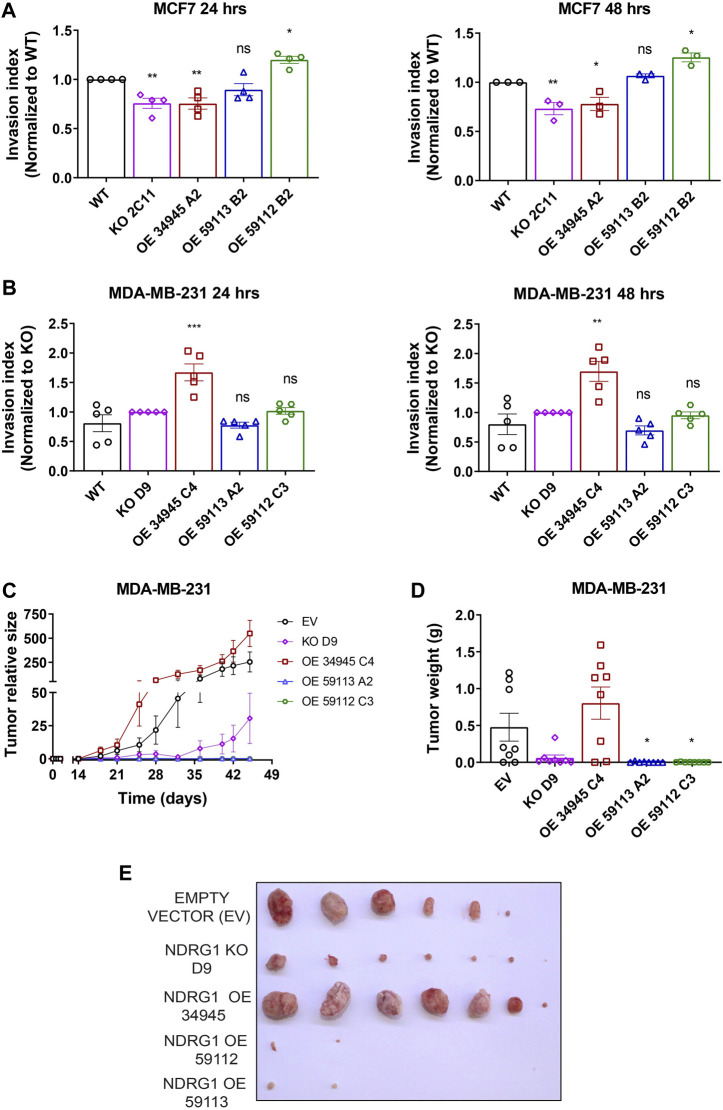
Multiple studies indicate that iron chelators enhance their anti-cancer properties by inducing NDRG1, a known tumor and metastasis suppressor. However, the exact role of NDRG1 remains controversial, as newer studies have shown that NDRG1 can also act as an oncogene. Our group recently introduced mitochondrially targeted iron chelators deferoxamine (mitoDFO) and deferasirox (mitoDFX) as effective anti-cancer agents. In this study, we evaluated the ability of these modified chelators to induce NDRG1 and the role of NDRG1 in breast cancer. We demonstrated that both compounds specifically increase NDRG1 without inducing other NDRG family members. We have documented that the effect of mitochondrially targeted chelators is at least partially mediated by GSK3α/β, leading to phosphorylation of NDRG1 at Thr346 and to a lesser extent on Ser330. Loss of NDRG1 increases cell death induced by mitoDFX. Notably, MDA-MB-231 cells lacking NDRG1 exhibit reduced extracellular acidification rate and grow slower than parental cells, while the opposite is true for ER+ MCF7 cells. Moreover, overexpression of full-length NDRG1 and the N-terminally truncated isoform (59112) significantly reduced sensitivity towards mitoDFX in ER+ cells. Furthermore, cells overexpressing full-length NDRG1 exhibited a significantly accelerated tumor formation, while its N-terminally truncated isoforms showed significantly impaired capacity to form tumors. Thus, overexpression of full-length NDRG1 promotes tumor growth in highly aggressive triple-negative breast cancer.

Keywords: GSK3α/β; NDRG1; breast cancer; mitoDFO; mitoDFX; mitochondrial iron chelation; oncogene; tumor suppressor.


Conflict of interest statement

The authors declare that the research was conducted in the absence of any commercial or financial relationships that could be construed as a potential conflict of interest. The author(s) declared that they were an editorial board member of Frontiers, at the time of submission. This had no impact on the peer review process and the final decision.

Figures

FIGURE 1
FIGURE 1
Induction of NDRG1 expression after 24 h exposure to the iron chelator Dp44mT and the mitochondrially targeted iron chelators, mitoDFX and mitoDFO. (A) The expression of NDRG1 in MCF7, MDA-MB-231 and MRC5 cells treated with iron chelators (Dp44mT, mitoDFX and mitoDFO) was analyzed using qPCR. NDRG1 expression was normalized to the human ribosomal large protein P0 gene (RPLP0). Data are shown as the relative expression of NDRG1 from three independent experiments with at least three replicates each. (B) Western blot images of NDRG1 protein levels were detected in MCF7, MDA-MB-231 and MRC5 cells treated with increasing concentrations of Dp44mT (300 nM, 1 μM and 3 µM), mitoDFX (100 nM, 300 nM and 1 µM) and mitoDFO (300 nM, 1 μM and 3 µM) for 24 h. The Western blot images represent the mean of at least three independent experiments. (C) Representative confocal immunofluorescence images were obtained from MCF7 and MDA-MB-231 treated with Dp44mT, mitoDFO and mitoDFX for 24 h and incubated with NDRG1 antibody (Green). Nuclei were stained with Hoechst 33342 (Blue). Scale bars = 20 µm. p values were calculated by multiple unpaired t-test. *p < 0.05 versus control and ****p < 0.00001.
FIGURE 2
FIGURE 2
Induction of NDRG1 phosphorylation at Ser330 and Thr346 after treatment with both conventional and mitochondrially targeted iron chelators observed in breast cancer cells. (A) MCF7, MDA-MB-231 and MRC5 cells treated with iron chelators: Dp44mT (1 µM), mitoDFO (1 μM and 3 µM), mitoDFX (1 μM and 3 µM), and their parental compounds: DFO (3 μM and 100 µM), DFX (3 μM and 30 µM) for 24 h. NDRG1 phosphorylation at Ser330 and Thr346 was detected using specific antibodies, as shown in the figure. (B) Western blot images of malignant MCF7 breast cancer cells treated with or without Dp44mT (5 µM), mitoDFO (1 and 3 µM) and mitoDFX (1 and 3 µM) to detect proteins using the antibodies listed in the figure. (C) Western blot images of malignant MCF7 breast cancer cells treated with or without Dp44mT (5 µM), mitoDFO (3 µM) and mitoDFX (3 µM) or a GSK3-inhibitor (1 µM) with proteins detected using the antibodies listed in the figure. The Western blot images represent the mean of at least three independent experiments.
FIGURE 3
FIGURE 3
Effects of iron chelators on other members of the NDRG family. (A–C) mRNA levels of NDRG2-4 in breast cancer cells with or without Dp44mt or mitochondrially targeted iron chelators (mitoDFX and mitoDFO) were examined using qPCR and normalized to the human ribosomal large protein P0 gene (RPLP0). (D) Western blot images of malignant (MCF7 and MDA-MB-231) breast cancer cells and non-malignant (MRC5) cells treated with or without Dp44mT (300 nM, 1 and 3 µM), mitoDFO (300 nM, 1 and 3 µM) and mitoDFX (100 nM, 300 nM and 1 µM) against different family members of NDRG. The Western blot images represent the mean of at least three independent experiments. p values were calculated by multiple unpaired t-test. *p < 0.05 versus control, **p < 0.001 and ****p < 0.00001.
FIGURE 4
FIGURE 4
NDRG1 KO affects the basal growth and response of breast cancers to mitoDFX. (A) Western blot images of NDRG1 in MCF7 and MDA-MB-231 NDRG1 knockout (KO) clones exposed to 1 µM Dp44mT for 24 h to verify successful generation of KO clones. The Dp44mT iron chelator is used as a positive control that induces NDRG1 levels. (B) Proliferation curves for MCF7 and MDA-MB-231 wild-type (WT) and KO cells under basal conditions. (C) Proliferation curves for MCF7 and MDA-MB-231 WT and KO cells treated for 72 h with 30 nM and 1 µM mitoDFX respectively. The growth curves were monitored using a real-time Incucyte® Sartorius microscope. (D) Cell death was measured using Sytox green dye (0.5 µM). (B–D) Data are shown as normalized confluence/time zero for proliferation and normalized dead counts/phase for cell death measurement. All values represent the mean ± SEM of three independent experiments with at least three replicates each.
FIGURE 5
FIGURE 5
NDRG1 overexpression (OE) affects the basal growth and response of breast cancer cells to mitoDFX. (A) Schematic representation of NDRG1 overexpressing isoforms: [full-length (34,945) and two truncated forms (59,113, 59,112)]. (B) Western blot images for NDRG1 in MCF7 and MDA-MB-231 NDRG1 OE clones exposed to 1 µM Dp44mT for 24 h to verify successful generation of OE clones (EV represents empty vector). The Dp44mT iron chelator was used as a positive control that induces NDRG1 levels. (C) Proliferation curves for MCF7 and MDA-MB-231 EV and OE clones under basal conditions. The growth curves were monitored using a real-time Incucyte® Sartorius microscope. (D–E) Proliferation and cell death curves for MCF7 and MDA-MB-231 EV and OE clones treated with 30 nM and 1 µM mitoDFX respectively. The growth curves were monitored using a real-time Incucyte® Sartorius microscope, and cell death was measured using Sytox green dye (0.5 µM). Data are shown as normalized confluence/time zero for proliferation and normalized dead counts/phase for cell death measurement. All values represent the mean ± SEM of three independent experiments with at least three replicates each.
FIGURE 6
FIGURE 6
NDRG1 changes cell metabolism in breast cancer cells. (A) Profile of oxygen consumption rate (OCR) in MCF7 and MDA-MB-231 wild-type (WT) and NDRG1 KO clones. (B) Glycolysis stress test measuring the extracellular acidification rate (ECAR) in MCF7 and MDA-MB-231 WT and KO clones. (C) Profile of OCR in MCF7 and MDA-MB-231 empty vector (EV) and NDRG1 overexpressing clones (OE). (D) Glycolysis stress test measuring ECAR in MCF7 and MDA-MB-231 EV and NDRG1 OE clones. OCR was evaluated before and after the addition of oligomycin (Omy, CV inhibitor), CCCP (an uncoupler of OXPHOS), and rotenone plus antimycin A (Rot + AA, CI and CIII inhibitor, respectively). For ECAR, cells were exposed to glucose, oligomycin (Omy) and 2-deoxyglucose (2-DG). All values represent the mean ± SEM of at least three independent experiments with two or more replicates each.
FIGURE 7
FIGURE 7
Effect of NDRG1 on ROS levels and mitochondrial membrane potential in NDRG1 KO and OE clones of breast cancer origin. Quantification of DCF-DA fluorescence (cellular ROS; (A)), MitoSOX fluorescence (mitochondrial superoxide; (B)), and TMRM fluorescence (mitochondrial membrane potential; (C)) in MCF7 and MDA-MB-231 wild-type (WT) and NDRG1 knockout (KO) clones. Quantification of DCF-DA fluorescence (cellular ROS; (D)), MitoSOX fluorescence (mitochondrial superoxide; (E)), and TMRM fluorescence (mitochondrial membrane potential; (F)) in MCF7 and MDA-MB-231 WT and NDRG1 OE clones. All values represent the mean ± SEM of at least three independent experiments with two or more replicates each. p values were calculated by one-way ANOVA. *p < 0.05 versus control, **p < 0.001, ***p < 0.0001 and ****p < 0.00001.
FIGURE 8
FIGURE 8
NDRG1 promotes cancer cells invasion in vitro and induces tumor growth in triple-negative breast cancer cells in vivo. (A, B) Quantification of invasion index of MCF7 and MDA-MB-231 cells with their respective NDRG1 knockout (KO) and overexpressing clones (OE). The invasion index was calculated as the ratio of the area after 24 or 48 h to the initial area (0 h), relative to wild-type (WT) for MCF7 and KO for MDA-MB-231 cells. Data are represented as the mean ± SEM of three independent experiments with at least six replicates each. (C, D) Tumor growth curves, tumor weight, and photograph of tumors after dissection of athymic nude mice injected subcutaneously with MDA-MB-231 empty vector (EV), NDRG1 KO and OE clones (34,945, 59,112 and 59,113). p values were calculated by one-way ANOVA. *p < 0.05, **p < 0.001, ***p < 0.0001 versus control.

Similar articles

Cited by

References

    1. Bandyopadhyay S., Pai S. K., Hirota S., Hosobe S., Takano Y., Saito K., et al. (2004). Role of the putative tumor metastasis suppressor gene Drg-1 in breast cancer progression. Oncogene 23 (33), 5675–5681. 10.1038/sj.onc.1207734 - DOI - PubMed
    1. Basuli D., Tesfay L., Deng Z., Paul B., Yamamoto Y., Ning G., et al. (2017). Iron addiction: a novel therapeutic target in ovarian cancer. Oncogene 36 (29), 4089–4099. 10.1038/onc.2017.11 - DOI - PMC - PubMed
    1. Boukalova S., Stursa J., Werner L., Ezrova Z., Cerny J., Bezawork-Geleta A., et al. (2016). Mitochondrial targeting of metformin enhances its activity against pancreatic cancer. Mol. Cancer Ther. 15 (12), 2875–2886. 10.1158/1535-7163.MCT-15-1021 - DOI - PubMed
    1. Chekmarev J., Azad M. G., Richardson D. R. (2021). The oncogenic signaling disruptor, NDRG1: molecular and cellular mechanisms of activity. Cells 10 (9), 2382. 10.3390/cells10092382 - DOI - PMC - PubMed
    1. Chen Z., Zhang D., Yue F., Zheng M., Kovacevic Z., Richardson D. R. (2012). The iron chelators Dp44mT and DFO inhibit TGF-β-induced epithelial-mesenchymal transition via up-regulation of N-Myc downstream-regulated gene 1 (NDRG1). J. Biol. Chem. 287 (21), 17016–17028. 10.1074/jbc.M112.350470 - DOI - PMC - PubMed

LinkOut - more resources