. 2024 Mar 27;9(5):607-627.
doi: 10.1016/j.jacbts.2024.01.010. eCollection 2024 May.

Thrombospondin-1 Drives Cardiac Remodeling in Chronic Kidney Disease

Affiliations

Thrombospondin-1 Drives Cardiac Remodeling in Chronic Kidney Disease

Sohel M Julovi et al. JACC Basic Transl Sci. .

Abstract

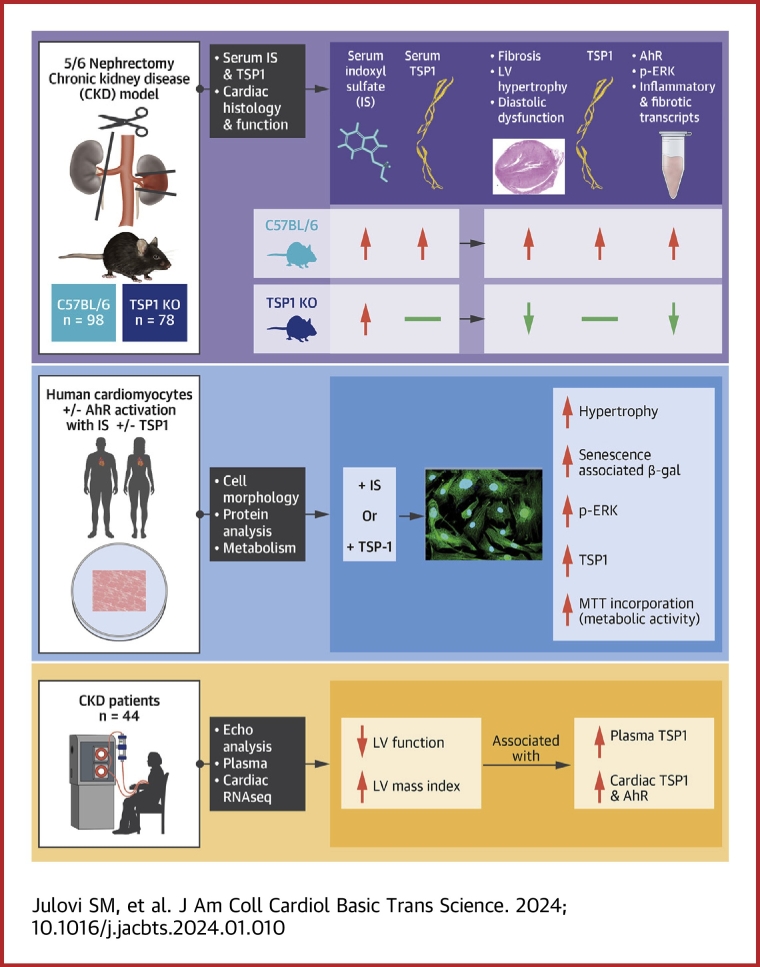
Patients with chronic kidney disease (CKD) face a high risk of cardiovascular disease. Previous studies reported that endogenous thrombospondin 1 (TSP1) involves right ventricular remodeling and dysfunction. Here we show that a murine model of CKD increased myocardial TSP1 expression and produced left ventricular hypertrophy, fibrosis, and dysfunction. TSP1 knockout mice were protected from these features. In vitro, indoxyl sulfate is driving deleterious changes in cardiomyocyte through the TSP1. In patients with CKD, TSP1 and aryl hydrocarbon receptor were both differentially expressed in the myocardium. Our findings summon large clinical studies to confirm the translational role of TSP1 in patients with CKD.

Keywords: aryl hydrocarbon receptor; cardiac fibrosis; chronic kidney disease; left ventricular hypertrophy; thrombospondin 1.


Conflict of interest statement

This work was supported by a National Health Medical Research Council grant (GNT2007991) to awarded to Dr Rogers, a National Heart Foundation Vanguard Grant (106035) to Drs Rogers and Julovi, and a Westmead Medical Research Foundation grant to Dr Julovi. All other authors have reported that they have no relationships relevant to the contents of this paper to disclose.PerspectivesCOMPETENCY IN MEDICAL KNOWLEDGE: Patients with CKD continue to experience dramatically reduced life expectancy owing to concomitant CVD, termed CRS. Despite a consensus definition, there has been minimal progress in our understanding of the pathophysiology and no specific therapeutic interventions that improve outcomes. Here we demonstrate that the uremic toxin IS is driving deleterious changes in cardiomyocyte phenotype through the matrix protein TSP1. These findings provide a potential therapeutic target for CRS. TRANSLATIONAL OUTLOOK: Patients with HFpEF are vulnerable to the development of renal dysfunction during treatment for decompensation, and renal-associated mortality is higher in patients with HFpEF. We have identified a novel pathway that drives uremic toxin-induced changes in cardiac pathology through the protein TSP1. Our mechanistic data lend support for testing monoclonal antibodies or peptidic inhibitors that block the actions of TSP1 (and therefore IS), limit development of LVH, and potentially improve survival in CRS.

Figures

None
Graphical abstract
Figure 1
Figure 1
Development of CKD in WT and TSP1KO Mice Wild-type (WT) and thrombospondin-1 knockout (TSP1KO) mice were subjected to sham surgery or 5/6-nephrectomy (5/6Nx). (A) Percentage of kidney excised following 5/6Nx at 2, 6, and 12 weeks (n = 7-13). (B) Fold change in body weight over 12 weeks (n = 6-21). Serum urea (C) and serum creatinine (D) at 2, 6, and 12 weeks (n = 6-14), and (E) urine volume and urinary/plasma creatinine ratios (uCr/pCr) at 10 weeks (n = 5-15). (F) Detection of superoxide and H2O2 moieties in WT and TSP1KO kidney homogenates (n = 4-6). (G) Representative hematoxylin and eosin–stained kidney histology (bar = 50 μm). (H) Expression of plasma TSP1 by Western blotting in sham-operated and 5/6Nx mice. The band density of the protein is normalized with Coomassie brilliant blue (CBB) and combined densitometries are shown (n = 3-5). (I) Serum indoxyl sulfate at week 12 was detected by enzyme-linked immunosorbent assay (n = 3-6). All data are mean ± SD. ∗P < 0.05, ∗∗P < 0.01, and ∗∗∗P < 0.001 by 2-way analysis of variance with Tukey post hoc test (A to F [at each time point], I), and the representing graph (H) was analyzed by unpaired Student's t-test. AUC = area under the curve; CKD = chronic kidney disease.
Figure 2
Figure 2
CKD in Mice Induces TSP1-dependent LVH (A) Representative left ventricle hematoxylin and eosin–stained histology (bars = 1 mm [top panel] and 50 μm [bottom panel]) and (B) cross-sectional surface area of individual cardiomyocytes. Measurements are from randomly chosen cells (n = 310 WT-sham, 279 WT-5/6Nx, 298 TSP1KO-sham, 214 TSP1KO-Nx) from 4 mice. Regions of interest at the margin of images or incomplete regions of interest were excluded from the counting. (C) Representative left ventricular picrosirius red staining with accompanying histogram of staining area from 5 independent fields of view (n = 6) (bars = 2.5 mm [top], 250 μm [middle], and 25 μm [bottom]). (D) Left ventricular messenger RNA (mRNA) expression of fibrosis markers collagen 1, fibronectin (Fn), α-smooth muscle actin (SMA), and TGF-β by quantitative polymerase chain reaction, normalized to HPRT1 with WT sham-operated left ventricle set as the referent control (n = 6-7). (E) Representative left ventricular immunohistochemical staining for TSP1 (bar = 2.5 mm) with high magnification areas (bars = 50 μm): (i) injured area, (ii) interstitial space, and (iii) cardiomyocytes. (F) Left ventricular mRNA expression of TSP1 by quantitative polymerase chain reaction, normalized to HPRT1 with WT sham-operated left ventricle set as the referent control (n = 5-8). (G) Left ventricular homogenates were analyzed for TSP1 expression by Western blotting. Band density was normalized with vinculin and combined densitometries are shown (n = 6). All data are mean ± SD; ∗P < 0.05, ∗∗P < 0.01, and ∗∗∗P < 0.001 by 2-way analysis of variance with Tukey post hoc test (A to D) or unpaired Student’s t-test (G). HPRT1 = hypoxanthine phosphoribosyltransferase 1; LVH = left ventricular hypertrophy; other abbreviations as in Figure 1.
Figure 3
Figure 3
CKD in Mice Promotes Cardiac Hypertrophy and Senescence via TSP1 Systolic and diastolic blood pressure (BP) using tail-cuff plethysmography over 12 weeks in WT or TSP1KO mice following 5/6Nx or sham operation (n = 20-23). (B) Representative images of left ventricle echocardiography and measurement of ejection fraction (EF) at 12 weeks (n = 5-8). (C) Four apical view echocardiography analysis. E/A ratio of early mitral flow velocity (E) and late diastolic transmitral flow velocity (A), isovolumic relaxation time (IVRT), and E/e′ ratio of early mitral flow velocity (E) and diastolic septal mitral annulus velocity (e′) (n = 4). (D) Lung weight normalized by the tibial length (n = 4). Mice left ventricular homogenates were analyzed by Western blotting for expression of (E) α-actinin, and (F) senescence markers tumor protein p53 (p53). Band density was normalized with vinculin and combined densitometries were shown (n = 6). (G) Left ventricular messenger RNA expression of senescence-associated secretory phenotype cytokines interleukin (IL)-6, IL-1β, TNF-α, and CCL2 by quantitative polymerase chain reaction, normalized to HPRT1 with WT sham-operated left ventricle set as the referent control (n = 6-9). All data are mean ± SD; ∗P < 0.05, ∗∗P < 0.01, and ∗∗∗P < 0.001 by 2-way analysis of variance with Tukey post hoc test. a.u. = arbitrary units; other abbreviations as in Figure 1.
Figure 4
Figure 4
CKD in Mice Promotes Cardiac Oxidative Stress, Inflammation, and MAPK Up-Regulation via TSP1 Measurement of (A) superoxide and H2O2 (n = 4) in left ventricular tissue, and (B) serum alkaline phosphatase (ALP) (n = 7-12). (C) Expression of phosphorylated extracellular regulated kinase (pERK), and vinculin by Western blotting in the left ventricle from WT or TSP1KO hearts following 5/6Nx or sham operation (n = 6). Band density was normalized with vinculin. (D,E) Human cardiomyocyte cells at ∼70% confluence in 6-well plates were treated with indoxyl sulfate (IS) (10 μmol/L) (D, n = 4) and TSP1 (2.2 nmol/L) (E, n = 5) for 24 hours. pERK and total ERK were measured by Western blotting in whole-cell lysates. β-actin was used as an internal control. (F) Human cardiomyocyte cells were pretreated treated with immunoglobulin G1 (IgG1) (1 μg/mL) or anti-TSP1 antibody (αTSP1Ab) (1 μg/mL) for 2 hours and then treated with IS (10 μmol/L) for 24 hours. pERK and total ERK were measured by Western blotting in whole-cell lysates. β-actin was used as an internal control (n = 5). (G) Human cardiomyocyte cells were pretreated with control (CTL) siRNA (50 nmol/L) or TSP1small interfering RNA (siRNA) (50 nmol/L) for 48 hours and then treated with IS (10 μmol/L) for 24 hours. pERK and total ERK were measured by Western blotting in whole-cell lysates. β-actin was used as an internal control (n = 5). Band density was normalized with total ERK. Graphs are mean ± SD; ∗P < 0.05, ∗∗P < 0.01, and ∗∗∗P < 0.001 by 1-way analysis of variance (F to H) and 2-way analysis of variance with Tukey Post hoc test (A to C, F, G) or unpaired Student’s t-test (D, E). CTRL = control; MAPK = mitogen activated protein kinase; other abbreviations as in Figure 1.
Figure 5
Figure 5
Myocardial Activation of AhR Is Up-Regulated in CRS (A) Representative left ventricle immunohistochemical staining for aryl hydrocarbon receptor (AhR) (bar = 2.5 mm) with high magnification areas (bars = 50 μm), with the accompanying histogram of mean AhR scoring (n = 6). (B) Human cardiomyocyte cells at ∼70% confluence in 6-well plates were treated with IS (10 μmol/L) or TSP1 (2.2 nmol/L) for 24 hours. AhR was measured by Western blotting in whole-cell lysates. β-actin was used as an internal control (n = 3). (C) Human cardiomyocyte cells were pretreated with CTL (50 nmol/L) or TSP1 siRNA (50 nmol/L) for 48 hours and then treated with IS for 24 hours. AhR was measured by Western blotting in whole-cell lysates. β-actin was used as an internal control (n = 3). Band density was normalized with β-actin. All data are mean ± SD; ∗P < 0.05, ∗∗P < 0.01, and ∗∗∗P < 0.001 by 2-way analysis of variance with Tukey post hoc test (A) or 1-way analysis of variance with Sidak multiple comparisons test (B, C). CRS = cardiorenal syndrome; other abbreviations as in Figures 1 and 4.
Figure 6
Figure 6
IS Induces Cardiomyocyte Hypertrophy That Is Dependent on TSP1 (A) Human cardiomyocytes were treated with IS at 0 μmol/L (n = 3), 1 μmol/L (n = 3), 10 μmol/L (n = 7), 100 μmol/L (n = 4), and 500 μmol/L (n = 4) for 24 hours. TSP1 and vinculin were measured by Western blotting in whole-cell lysates. Band density was normalized with vinculin. (B) Human cardiomyocytes were transfected with CTL or TSP1 siRNA (50 nmol/L), or treated with isotype control IgG1 or αTSP1Ab antibody (1 μg/mL), incubated with IS (10 μmol/L), then probed for TSP1 protein or TSP1 mRNA expression (C). (D) Human cardiomyocytes were treated with increasing doses of IS and probed for α-actinin. (E) Human cardiomyocytes were transfected with CTL or αTSP1 siRNA (50 nmol/L) or treated with IgG1 or αTSP1Ab (1 μg/mL), incubated with IS (10 μmol/L), then probed for α-actinin. Band density was normalized with β-actin. Representative Western blots and combined densitometry are shown (n = 3-7). (F) Human cardiomyocyte surface area after treatment with TSP1 (2.2 nmol/L) or IS (10 μmol/L) for 48 hours, following transfection with CTL or TSP1 siRNA (50 nmol/L) for 48 hours. Cells were stained for α-actinin (green) and 4′,6-diamidino-2-phenylindole (blue) (original magnification 40×; bar = 50 μm). Measurements are from 233 to 259 randomly chosen cells from 4 independent experiments. (G) Human cardiomyocytes were treated with TSP1 (2.2 nmol/L) and IS (10 μmol/L) for 24 hours and were probed for atrial natriuretic peptide (ANP) and brain natriuretic peptide (BNP) mRNA (n = 4-6). All data are mean ± SD; ∗P < 0.05, ∗∗P < 0.01, and ∗∗∗P < 0.001 by 1-way analysis of variance with Sidak multiple comparisons test. RU = relative units; other abbreviations as in Figures 1, 2, and 4.
Figure 7
Figure 7
IS induces HCM SASP That Is Dependent on TSP1 Incorporation of 3-(4,5-dimethylthiazol-2-yl)-2,5-diphenyl-2H-tetrazolium bromide (MTT) in human cardiomyocytes (HCMs) following incubation with (A) IS (1, 10, 100, and 500 μmol/L), (B) TSP1 (2.2 nmol/L), or (C) IS (10 μmol/L) following transfection with CTL or TSP1 siRNA (50 nmol/L) (n = 3-6). HCM senescence-associated β-galactosidase (SA-β-gal) activity following (D) IS (1, 10, and 100 μmol/L), (E) TSP1 (2.2 nmol/L), or (F) IS pretreated with CTL or TSP1 siRNA (50 nmol/L) (n = 5-6). (G) SA-β-gal staining following incubation with TSP1 (2.2 nmol/L) (n = 5), IS (10 μmol/L) (n = 5), IgG1 antibody (1 μg/mL) (n = 4) or αTSP1Ab (1 μg/mL) (n = 3). Measurements are from 5 randomly chosen images from independent experiments (bar = 200 μm). (H) Transcript expression of IL-6, IL-1, TNF, and CCL2 from HCMs treated with IS, CTL antibody or αTSP1Ab (n = 3 independent experiments, normalized to 18S ribosome). All data are mean ± SD; ∗P < 0.05, ∗∗P < 0.01, and ∗∗∗P < 0.001 by 1-way analysis of variance with Sidak multiple comparisons test (A, C, D, F to H) or Student’s t-test (B, E). SASP = senescence-associated secretory phenotype; other abbreviations as in Figure 1, Figure 2, Figure 3, Figure 4.
Figure 8
Figure 8
TSP1 and AhR Expression Is Up-Regulated in Diseased Human Hearts (A) Linear regression analysis of plasma TSP1 levels and percentage of EF or left ventricular (LV) mass index in patients with chronic kidney disease. (B) Range of TSP1 and AhR gene expression in explanted hearts from healthy patients compared to those with cardiorenal syndrome. Data are expressed as median with 25th and 75th percentiles (box plot); ∗∗∗P < 0.001 by Wilcoxon rank-sum test. (C) Volcano plot of differentially expressed genes from RNA-sequencing (RNA-seq)-analyzed explanted hearts from healthy patients or those with cardiorenal syndrome. (D) Kyoto Encyclopedia of Genes and Genomes pathway of differentially expressed genes. CAMS = cell-cell adhesion molecules; ECM = extracellular matrix; FC = fold change; IGA = immunoglobulin A; NS = not significant; TCA = citric acid cycle; other abbreviations as in Figures 1 and Figure 3, Figure 4, Figure 5.

References

    1. Jha V., Garcia-Garcia G., Iseki K., et al. Chronic kidney disease: global dimension and perspectives. Lancet. 2013;382(9888):260–272. - PubMed
    1. Vanholder R., Massy Z., Argiles A., et al. Chronic kidney disease as cause of cardiovascular morbidity and mortality. Nephrol Dial Transplant. 2005;20(6):1048–1056. - PubMed
    1. Rangaswami J., Bhalla V., Blair J.E.A., et al. Cardiorenal syndrome: classification, pathophysiology, diagnosis, and treatment strategies: a scientific statement from the American Heart Association. Circulation. 2019;139(16):e840–e878. - PubMed
    1. Taveira Gomes T., Santos Araujo C., Valente F., et al. Cardiorenal syndrome and death risk in patients with heart failure or chronic kidney disease: an unmet cardiorenal need? Eur Heart J. 2021;42(suppl 1):819.
    1. Deo R., Fyr C.L., Fried L.F., et al. Health ABC study Kidney dysfunction and fatal cardiovascular disease—an association independent of atherosclerotic events: results from the Health, Aging, and Body Composition (Health ABC) study. Am Heart J. 2008;155(1):62–68. - PubMed

LinkOut - more resources