. 2024 Jun 10;10(12):e32770.
doi: 10.1016/j.heliyon.2024.e32770. eCollection 2024 Jun 30.

Impact of the gut microbiome on response and toxicity to chemotherapy in advanced esophageal cancer

Affiliations

Impact of the gut microbiome on response and toxicity to chemotherapy in advanced esophageal cancer

Ningning Li et al. Heliyon. .

Abstract

Objective: To identify the gut bacteria associated with chemotherapeutic outcomes, t characterized the gut microbiota in patients with esophageal squamous cell carcinoma (ESCC) in this prospective study.

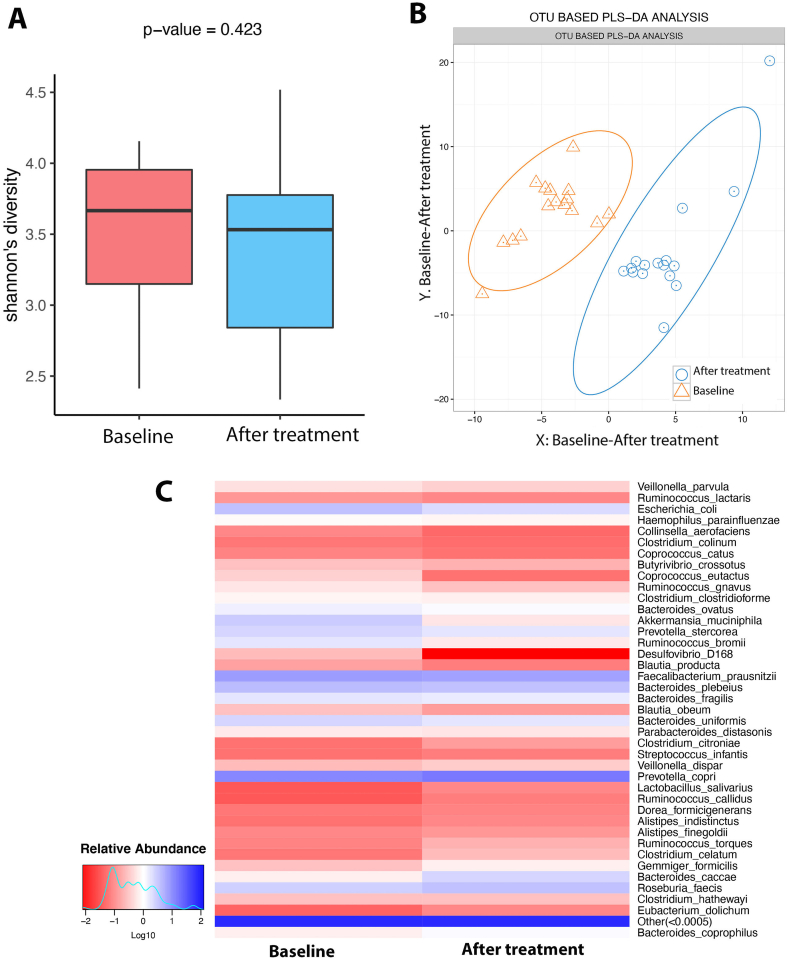
Design: Thirty-one patients with ESCC were enrolled. Chemotherapy was performed with paclitaxel and cisplatin (TP). Fecal samples were collected before and after treatment and analyzed using 16S rRNA sequencing.

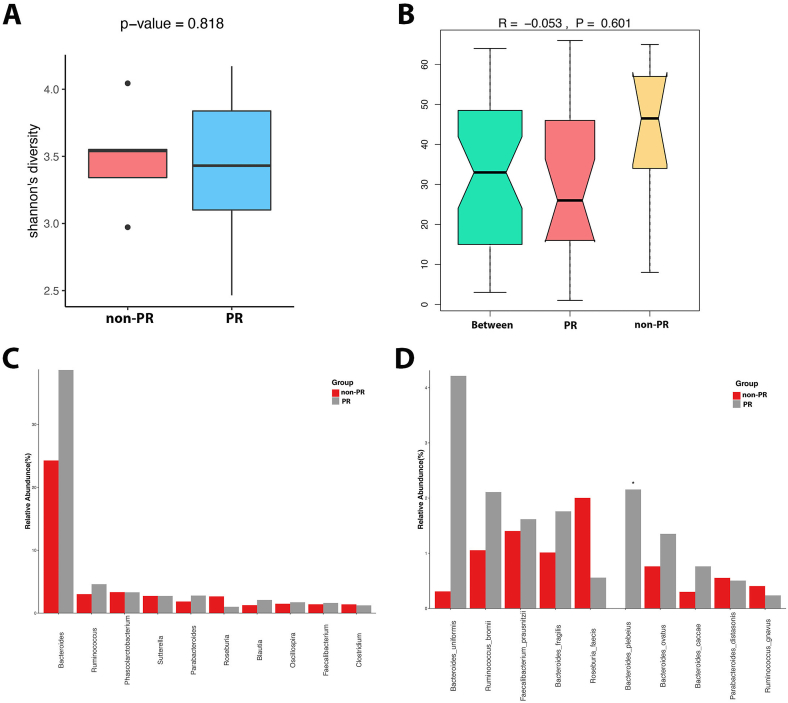
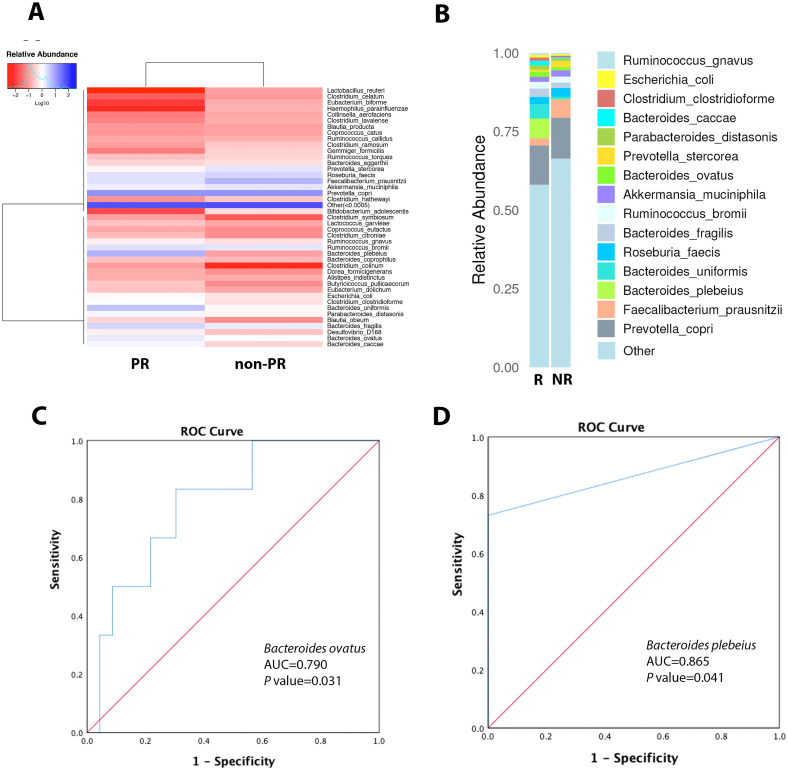
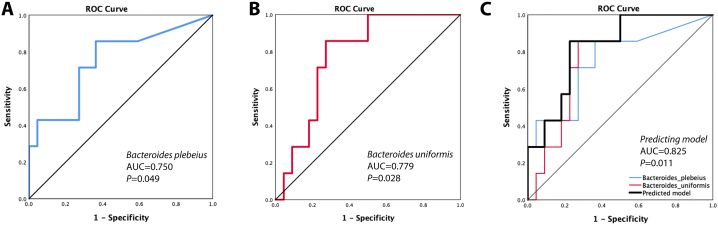
Results: The species with differences in baseline abundance between partial response (PR) and non-PR groups was identified as Bacteroides plebeius (P = 0.043). The baseline abundance of B. plebeius was higher in the responder (R, PR + stable disease (SD)) group (P = 0.045) than in the non-responder (NR). The abundance of B. ovatus was identified as a predictor for distinguishing patients with PR from those without PR (sensitivity, 83.3 %; specificity, 69.6 %). The abundance of B. plebeius was positively associated with the response to PR + SD (R) in predicting responders in the receiver operating characteristic (ROC) curve analysis (area under the ROC curve = 0.865, P = 0.041). The abundance of B. plebeius and B.uniform was a predictor of grade (G) 3-4 chemotherapy toxicities. The sensitivity and specificity of the established multi-analyte microbial predictive model demonstrated a better predictive ability than a single parameter (B. uniform or B. plebeius).

Conclusion: The abundance of gut microbiota B. plebeius and B. ovatus are associated with the efficacy of TP chemotherapy in patients with ESCC. The abundance of B. plebeius and B.uniform may related to the toxicity of TP chemotherapy.

Keywords: Chemotherapy; Efficacy; Esophageal squamous cell carcinoma; Gut microbiota; Toxicity.


Conflict of interest statement

The authors declare that they have no known competing financial interests or personal relationships that could have appeared to influence the work reported in this paper.

Figures

Fig. 1
Fig. 1
Analysis of fecal microbiota between baseline and after treatment samples in patients with esophageal squamous cell carcinoma. (A) Shannon index of alpha diversity. (B) Partial least squares discriminant analysis plot of unweighted Unifrac distances. (C) Relative abundance of the main species in the feces.
Fig. 2
Fig. 2
Analysis of fecal microbiota between the partial response (PR) and non-PR patients with esophageal squamous cell carcinoma. (A) Shannon index of alpha diversity. (B) Partial least squares discriminant analysis plot of unweighted Unifrac distances of the top 10 species with the highest abundance in baseline fecal samples at the genus level (C) and the species level (D).
Fig. 3
Fig. 3
(A) Relative abundance of the main species in the baseline feces between the partial response (PR) and non-PR groups. (B) Relative abundance of the main species in the baseline feces between the responder (R) and non-responder (NR) groups. (C) Receiver operating characteristic (ROC) curve of Bacteroides ovatus for discriminating PR from non-PR (n = 31, area under the curve [AUC] = 0.790, 95 % confidence interval 0.602–0.977, P = 0.031). (D) ROC curve of Bacteroides plebeius for discriminating the response of the R group from those of the NR group (n = 31, AUC = 0.865, 95 % confidence interval 0.723–0.999, P = 0.041).
Fig. 4
Fig. 4
ROC curve discriminating grade 3–4 toxicities vs. grade 1–2 toxicities after chemotherapy. (A) Performance of Bacteroides plebeius in classifying different grades of toxicity (n = 31, AUC = 0.750, 95 % confidence interval 0.529–0.971, P = 0.049). (B) Performance of Bacteroides uniform in classifying different grades of toxicity (n = 31, AUC = 0.779, 95 % confidence interval 0.609–0.949, P = 0.028). (C) Performance of Bacteroides plebeius, Bacteroides uniform, and predicted model (n = 31, AUC = 0.825, 95 % confidence interval 0.664–0.986, P = 0.011) in classifying grade 3–4 toxicities vs. grade 1–2 chemotherapeutic toxicities.
Supplementary Fig. 1
(A)The alpha diversity of the baseline fecal microbiota of the patients with locally advanced and distant metastases ESCC using Shannon index (P = 0.37). (B) The ANOSIM analysis of the composition of bacteria community between local advanced cancer and metastatic ESCC cases (R = −0.05, P = 0.992). (C) The abundance of the top 10 taxa were not significant different between patients with different cancer stages.

Similar articles

Cited by

References

    1. Siegel R.L., Miller K.D., Jemal A. Cancer statistics, 2017. CA A Cancer J. Clin. 2017;67(1):7–30. doi: 10.3322/caac.21387. - DOI - PubMed
    1. Cao W., Chen H.D., Yu Y.W., N Li N., Chen W.Q. Changing profiles of cancer burden worldwide and in China: a secondary analysis of the global cancer statistics 2020. Chin. Med. J. 2021;134(7):783–791. doi: 10.1097/CM9.0000000000001474. - DOI - PMC - PubMed
    1. Song M., Garrett W.S., Chan A.T. Nutrients, foods, and colorectal cancer prevention. Gastroenterology. 2015;148(6):1244–1260. e16. doi: 10.1053/j.gastro.2014.12.035. - DOI - PMC - PubMed
    1. Li Ningning, Gao Liwei, Ge Yuping, Lin Zhao, Bai Chunmei, Wang Yingyi. Prognostic and predictive significance of circulating biomarkers in patients with advanced upper gastrointestinal cancer undergoing systemic chemotherapy. Front. Oncol. 2023;13 doi: 10.3389/fonc.2023.1195848. eCollection. - DOI - PMC - PubMed
    1. Sender R., Fuchs S., Milo R. Revised estimates for the number of human and bacteria cells in the body. PLoS Biol. 2016;14(8) doi: 10.1371/journal.pbio.1002533. - DOI - PMC - PubMed

LinkOut - more resources