. 2024 Sep;11(34):e2310227.
doi: 10.1002/advs.202310227. Epub 2024 Jul 10.

Protosappanin A Protects DOX-Induced Myocardial Injury and Cardiac Dysfunction by Targeting ACSL4/FTH1 Axis-Dependent Ferroptosis

Affiliations

Protosappanin A Protects DOX-Induced Myocardial Injury and Cardiac Dysfunction by Targeting ACSL4/FTH1 Axis-Dependent Ferroptosis

Jingxuan Cui et al. Adv Sci (Weinh). 2024 Sep.

Abstract

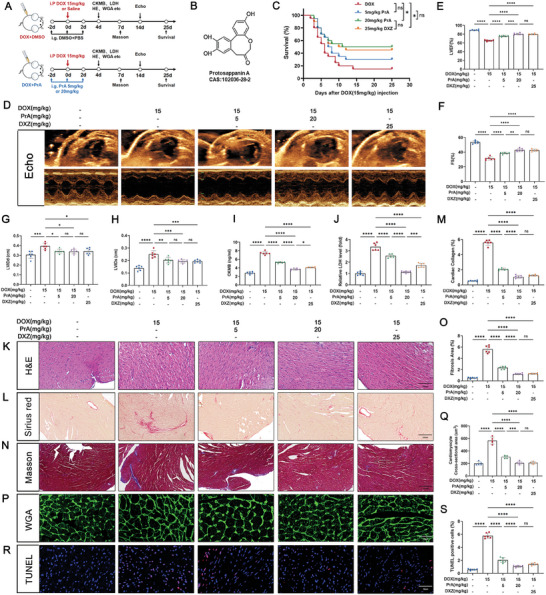
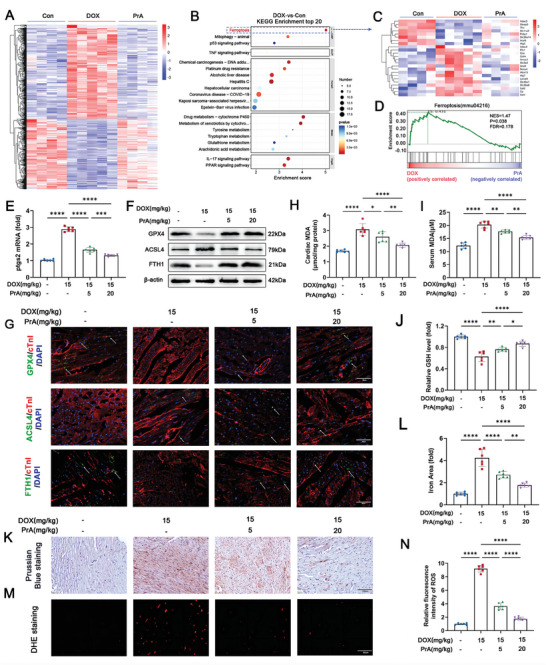
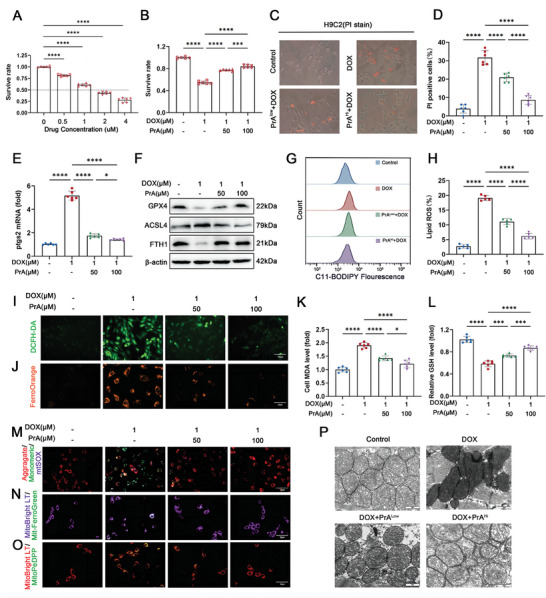
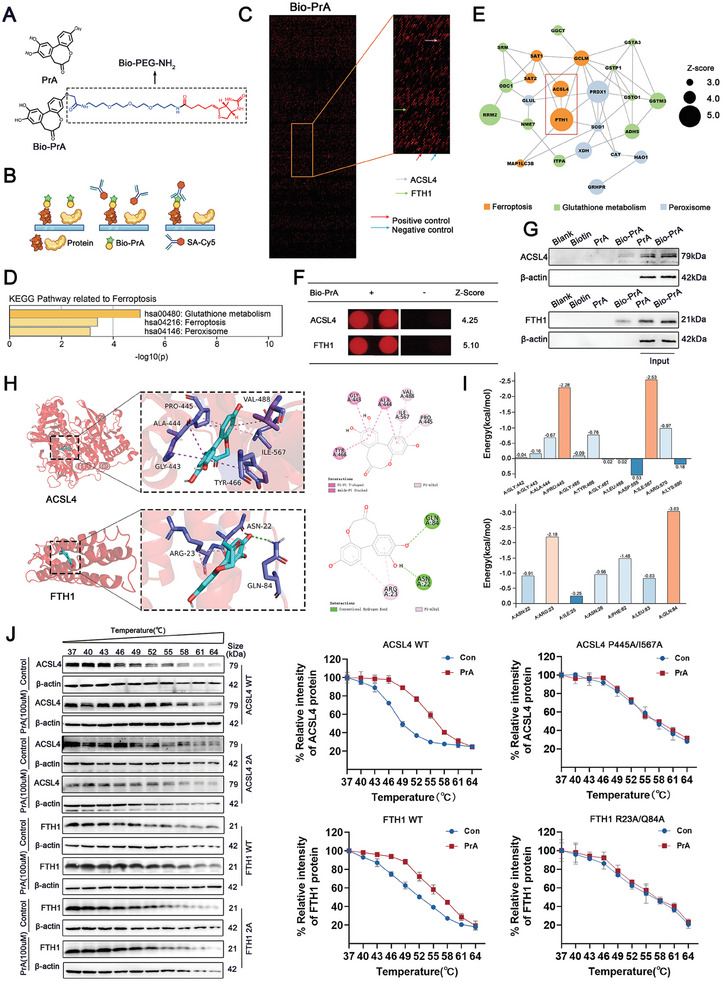
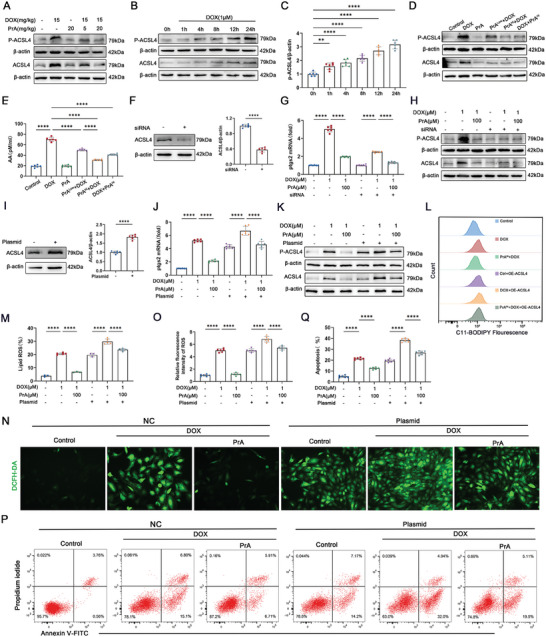
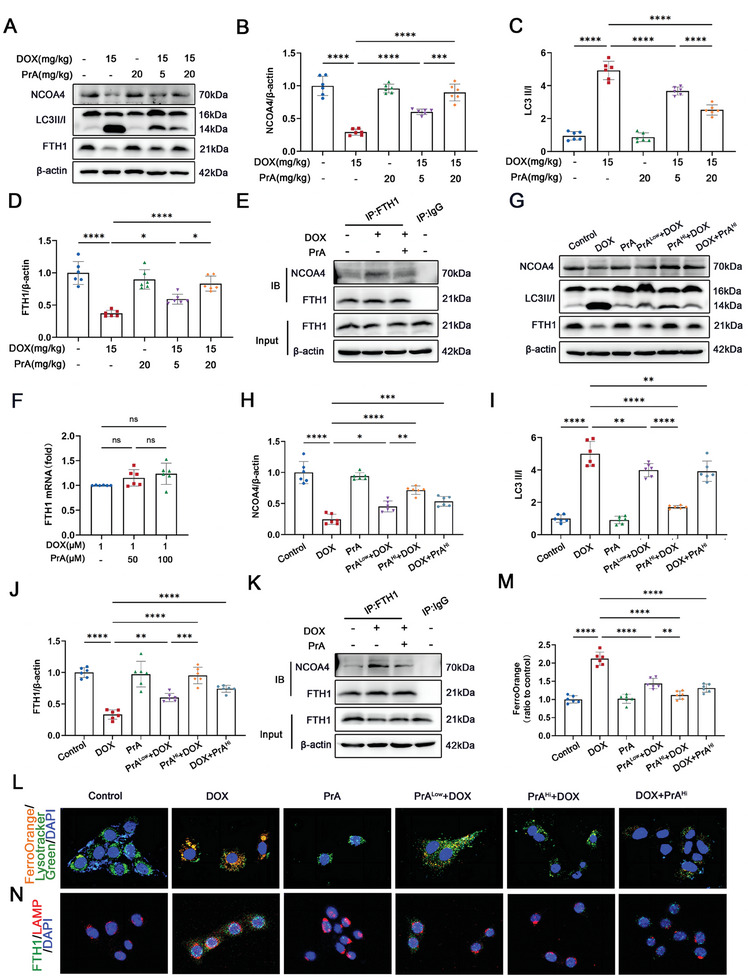
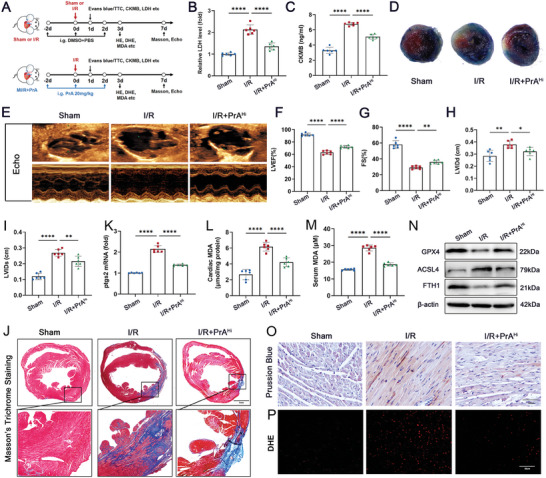
Doxorubicin (DOX) is an effective anticancer agent, but its clinical utility is constrained by dose-dependent cardiotoxicity, partly due to cardiomyocyte ferroptosis. However, the progress of developing cardioprotective medications to counteract ferroptosis has encountered obstacles. Protosappanin A (PrA), an anti-inflammatory compound derived from hematoxylin, shows potential against DOX-induced cardiomyopathy (DIC). Here, it is reported that PrA alleviates myocardial damage and dysfunction by reducing DOX-induced ferroptosis and maintaining mitochondrial homeostasis. Subsequently, the molecular target of PrA through proteome microarray, molecular docking, and dynamics simulation is identified. Mechanistically, PrA physically binds with ferroptosis-related proteins acyl-CoA synthetase long-chain family member 4 (ACSL4) and ferritin heavy chain 1 (FTH1), ultimately inhibiting ACSL4 phosphorylation and subsequent phospholipid peroxidation, while also preventing FTH1 autophagic degradation and subsequent release of ferrous ions (Fe2+) release. Given the critical role of ferroptosis in the pathogenesis of ischemia-reperfusion (IR) injury, this further investigation posits that PrA can confer a protective effect against IR-induced cardiac damage by inhibiting ferroptosis. Overall, a novel pharmacological inhibitor is unveiled that targets ferroptosis and uncover a dual-regulated mechanism for cardiomyocyte ferroptosis in DIC, highlighting additional therapeutic options for chemodrug-induced cardiotoxicity and ferroptosis-triggered disorders.

Keywords: doxorubicin‐induced cardiomyopathy; ferroptosis; molecular targeted therapy; myocardial injury; protosappanin A.


Conflict of interest statement

The authors declare no conflict of interest.

Figures

Figure 1
Figure 1
PrA alleviates DOX‐induced cardiac injury. A) Schematic diagram of animal experiment process. Briefly, mice were treated with PrA (5 or 20 mg kg−1, i.g.), DXZ (an iron chelating agent, 25 mg kg−1, i.p.) or DMSO with PBS on day 0, day 2, and day 4, followed by DOX (20 mg kg−1, i.p.) on day 2, while mice were injected with saline only as a control treatment on day 2. B) The chemical structure of the PrA. C) Kaplan‐Meier survival curves of mice in each group (n = 20 per group). D) Representative echocardiographic images showing the cardiac function of mice in each group. E–H) Quantitative analysis of LVEF, FS, LVIDd, and LVIDs (n = 6 per group). I,J) Serum CK‐MB (fivefold dilution) and LDH levels were measured in each group (n = 6 per group). K) Representative images of H&E staining (n = 6 per group, scale bar = 100 µm). L,M) Representative images and quantitative analysis of Sirius red staining (n = 6 per group, scale bar = 100 µm). N,O) Representative images and quantitative analysis of Masson's trichrome staining (n = 6 per group, scale bar = 100 µm). P) Representative images and Q) quantitative analysis of WGA staining (n = 6 per group, scale bar = 20 µm). R) Representative images and S) quantitative analysis of TUNEL staining (n = 6 per group, scale bar = 20 µm). The data presented in panel J was normalized. Summary data are presented as the mean ± SEM. Statistical significance was calculated using C) the log‐rank (Mantel‐Cox) test and E–J,K,M,O, Q,S) one‐way ANOVA with Tukey's multiple comparisons test. *p < 0.05, **p < 0.01, ***p < 0.001, ****p < 0.0001. Abbreviations: CK‐MB, creatine kinase‐MB; DMSO, dimethylsulfoxide; DOX, doxorubicin; DXZ, dexrazoxane; FS, left ventricular fractional shortening; i.g., intragastric; i.p., intraperitoneal; LDH, lactate dehydrogenase; LVEF, left ventricular ejection fraction; LVIDd, left ventricular internal dimension in diastole; LVIDs, left ventricular internal dimension in systole; PBS, phosphate buffer saline; PrA, protosappanin A.
Figure 2
Figure 2
PrA ameliorates DOX‐induced ferroptosis in heart tissue. A–D) RNA‐seq analysis reveals the DEGs in murine hearts from three groups: control (n = 4 per group), DOX (15 mg kg−1, i.p.; n = 5 per group), and DOX + PrA (20 mg kg−1, i.g.; n = 4 per group), as mentioned in Figure 1A. A) Heat map representing the significantly regulated genes detected in RNA‐seq analysis of murine heart tissue. Gene expressions were normalized with row Z‐score. B) KEGG pathway enrichment analysis in DOX‐treated murine heart compared with control murine heart. C) Heat map representing the ferroptosis‐related genes detected in RNA‐seq analysis of murine heart tissue. Gene expressions were normalized with row Z‐score. D) GSEA of regulated genes in DOX with PrA‐treated murine heart compared with DOX‐treated murine heart. E–N) Mice were randomly divided into four groups (n = 6 per group): control, DOX, DOX+PrA (5 mg kg−1), and DOX+PrA (20 mg kg−1). E) Relative mRNA levels of Ptgs2 in murine hearts. F) Cardiac protein expression of GPX4, ACSL4, and FTH1 were measured by immunoblotting. G) Representative images of cofluorescent immunohistochemistry staining for cTnT with GPX4 (green), ACSL4 (green), and FTH1 (green) in mice; the white arrows indicated positive areas. H) Cardiac MDA, I) serum MDA, and J) cardiac GSH levels were measured. K) Representative images and L) % area of Prussian blue staining with DAB enhancement (scale bar:100 µm). M,N) Representative images and quantifying fluorescent immunohistochemistry staining for DHE (scale bar: 20 µm). E,J,L,N) Some of the data was normalized. Summary data are presented as the mean ± SEM. Statistical significance was calculated using one‐way ANOVA with Tukey's multiple comparisons test. *p < 0.05, **p < 0.01, ***p < 0.001, ****p < 0.0001. Abbreviations: DOX, doxorubicin; i.p., intraperitoneal; i.g., intragastric; PrA, protosappanin A.
Figure 3
Figure 3
PrA protects H9c2 cells against DOX‐triggered iron accumulation, ROS production, lipid peroxidation and alleviates mitochondrial dysfunction. A) The effect in different concentrations of DOX‐induced cell death for 24 h, cell viability was detected by CCK8 assay (n  = 6 per group). B) The protective effect of PrA treatment on DOX‐induced cell death in cultured H9c2 cells under control conditions, in the presence of DOX (1 × 10⁻⁶ m, 24 h) or PrA (50 × 10−6 m or 100 × 10−6 m, 30 h), cell viability was detected by CCK8 assay (n  = 6 per group). H9c2 cells were pretreated with PrA in different concentrations for 6 h and then stimulated with 1 × 10−6 m DOX for 24 h. DMSO was used as vehicle control. Whole cells were used for the following assay. C) Representative images of PI staining and D) the percentage of PI‐positive cells (black and white: phase contract; red: PI staining, scale bar  =  100 µm, n = 6 per group). E) Relative mRNA levels of Ptgs2 (n = 6 per group). F) Protein expression of GPX4, ACSL4, and FTH1 was measured by immunoblotting (n = 6 per group). G,H) Lipid ROS generation and quantitative analysis were captured by C11‐BODIPY staining coupled with flow cytometry (n = 5 per group). I) Representative DCFH‐DA staining image (green, scale bar = 100 µm). J) Representative fluorescent images of cytoplasmic Fe2+ stained with FerroOrange (orange, scale bar = 20 µm). Quantitative analysis of K) MDA level and L) GSH level (n = 6 per group). M) JC‐1 staining assessed membrane potential and mtSOX Deep Red staining detected mitochondrial superoxide level (red, aggregates; green, monomersscale; purple, mtSOX Deep Red; scale bar = 20 µm). N) Representative fluorescent images of mitochondrial iron using Mito‐FerroGreen (MFG) in H9c2 cells. MitoBright LT Deep Red stains the mitochondria (green, MFG; purple, MitoBright LT Deep Red; scale bars: 20 µm). O) Representative fluorescent images of mitochondrial LPs using MitoPeDPP in H9c2 cells. MitoBright LT Deep Red stains the mitochondria (green, MitoPeDPP; red, MitoBright LT Deep Red; scale bar = 20 µm). P) Electron microscopy of mitochondria in mice hearts (scale bar =  2 µm). A,B,E,K,L) Some of the data was normalized. Summary data are presented as the mean ± SEM. Statistical significance was determined using A) multiple unpaired 2‐tailed Student t‐tests and B,D,E,H,K–L) one‐way ANOVA with Tukey's multiple comparisons tests. *p < 0.05, **p < 0.01, ***p < 0.001, ****p < 0.0001. Abbreviations: DMSO, dimethylsulfoxide; DOX, doxorubicin; PrA, protosappanin A; ROS, reactive oxygen species.
Figure 4
Figure 4
Identification of PrA‐binding proteins on human proteome microarrays. A) Chemical structure of PrA and Bio‐PrA. B) Schematic of the procedure for identifying PrA‐binding proteins using microarrays fabricated with recombinant human proteins. C) Representative image of protein array showing positive (red arrow) and negative control (blue arrow) spots, as well as spots for ACSL4 (purple arrow) and FTH1 (green arrow). D) KEGG pathway of PrA‐binding proteins related to ferroptosis. E) Protein–protein interaction (PPI) network of PrA‐binding proteins related to ferroptosis (circle size represents Z‐score value, orange: the pathway of ferroptosis, green: the pathway of glutathione metabolism, blue: the pathway of peroxisome. Z‐scores were defined as the binding affinity of the target proteins to PrA). F) Magnified image of Bio‐PrA binding to ACSL4 and FTH1 spot on the protein array. Z‐score is shown. G) Biotin alone was used as a control. Bio‐PrA was added to streptavidin‐agarose beads and incubated. Lysates prepared from H9c2 cells were added to the streptavidin‐agarose beads with Bio‐Cel, and the eluent was collected for Western Blot analysis. Total lysates were used as an input control. H) Molecular docking performed the binding pose details between PrA and ACSL4 or FTH1. The figure shows that PrA forms π–π conjugated bonds with ACSL4 Gly‐443, Ala‐444, Tyr‐466, and π–alkyl bonds with ACSL4 Pro‐445, Val‐488, Ile‐567, while PrA forms π–alkyl bonds with FTH1 Arg‐23, and conventional hydrogen bonds with FTH1 Asn‐22, Gln‐84. I) Histograms of the per‐residue energy contributions of key residues involved in Protosappanin A combining with ACSL4 (top panel) and FTH1 (bottom panel). J) Cellular thermal shift assay between PrA and ACSL4 or FTH1. HEK‐293 cells were transfected with plasmids of pcDNA3.1‐3×Flag‐h‐ACSL4 (P445A, I567A) −3×Flag‐zsgreen‐puro or pcDNA3.1‐3×Flag‐h‐FTH1/FTH1 (R23A, Q84A)−3×Flag‐zsgreen‐puro. The curve was fitted using GraphPad Prism 9.0 (n = 3 per group). Abbreviations: PrA, protosappanin A.
Figure 5
Figure 5
PrA blocks DOX‐induced ACSL4 activation in cardiomyocytes and reduces ROS production and lipid peroxidation. A) Western blot analysis of ACSL4 and p‐ACSL4 (Thr 328) in hearts from control mice and DOX‐treated (20 mg kg−1, i.p.) mice with or without PrA (5 or 20 mg kg−1, i.g.). B,C) H9c2 cells were exposed to 1 × 10−6 m DOX for different durations. The total proteins were extracted and measured for ACSL4 and p‐ACSL4 (Thr 328) levels (n = 6 per group). D,E) H9c2 cells were pretreated with PrA in different concentrations for 6 h and then stimulated with 1 × 10−6 m DOX for 24 h, or H9c2 cells were challenged with 1 × 10⁻⁶ m DOX for 24 h and then treated with 100 × 10−6 m PrA for 6 h. DMSO was used as vehicle control. Whole‐cell lysates were used for the follow‐up experiment (n = 6 per group). D) Western blot was used to determine the levels of ACSL4 and ACSL4 Thr 328 phosphorylation. E) ELISA quantified cellular supernatant AA levels. F–H) H9c2 cells were transfected with siRNA against ACSL4 and negative control siRNA (as the control group). F) Western blot was used to detect knockdown efficiency. Quantification is shown on the right (n = 6 per group). G) Relative mRNA levels of Ptgs2 following ACSL4 knockdown (n = 6 per group). H) Western blot analysis of ACSL4 and p‐ACSL4 (Thr 328) following ACSL4 knockdown. I–Q) H9c2 cells were transfected with cDNA plasmids encoding ACSL4 or empty vector (negative control, NC). I) Western blot was used to determine ACSL4 expression. Quantification is shown on the right (n = 6 per group). J) Effect of ACSL4 overexpression on Ptgs2 levels induction by DOX (n = 6 per group). K) Western blot analysis of ACSL4 and p‐ACSL4 (Thr 328) following ACSL4 overexpression (n = 6 per group). L,M) Lipid ROS generation and quantitative analysis of ACSL4‐overexpressing H9c2 cells by C11‐BODIPY staining coupled with flow cytometry (n = 5 per group). N,O) Representative DCFH‐DA staining images and quantitative analysis of fluorescence intensity for ACSL4‐overexpressing H9c2 cells (green, scale bar: 100 µm, n = 6 per group). P,Q) Flow cytometry and quantitative analysis of Annexin V‐APC and PI in ACSL4‐overexpressing H9c2 cells (n = 6 per group). C,F,G,I,J,O) Some of the data was normalized. Summary data are presented as the mean ± SEM. Statistical significance was determined using one‐way ANOVA with D,F,I,L,N,P) Tukey's multiple comparisons tests and E,H) multiple unpaired 2‐tailed Student t‐tests. *p < 0.05, **p < 0.01, ***p < 0.001, ****p < 0.0001. Abbreviations: DOX, doxorubicin; i.p., intraperitoneal; i.g., intragastric; PrA, protosappanin A.
Figure 6
Figure 6
PrA inhibits FTH1's autophagic degradation in lysosome. A–D) Western blot and quantitative analysis of cardiac NCOA4, LC3 II/I and FTH1 protein levels in control mice and mice treated with DOX with or without PrA (n = 6 per group). E) NCOA4‐FTH1 interactions were analyzed by coimmunoprecipitation in control mice and mice treated with DOX with or without PrA (n = 3 per group). F) Relative mRNA levels of FTH1 were measured in control H9c2 cells and cells treated with PrA in different concentrations for 6 h and then stimulated with 1 × 10−6 m DOX for 24 h (n = 6 per group). G) Western blot analysis of NCOA4, LC3 II/I and FTH1 in control H9c2 cells and cells pretreated with PrA in different concentrations for 6 h and then stimulated with 1 × 10−6 m DOX or 24 h or H9c2 cells were challenged with 1 × 10⁻⁶ m DOX for 24 h and then treated with 100 × 10−6 m PrA for 6 h. H–J) Quantitative analysis of the protein levels of H) NCOA4, I) LC3 II/I, and J) FTH1 in panel G (n = 6 per group). K) NCOA4‐FTH1 interactions were analyzed by coimmunoprecipitation in control H9c2 cells and cells treated with DOX with or without PrA (n = 3 per group). L,M) Representative confocal images and quantitative analysis of FerroOrange co‐localized with LysoTracker Green in H9c2 cells (orange: FerroOrange, green: LysoTracker Green, blue: DAPI, scale bars:20 µm, n = 6 per group). N) Representative immunofluorescence imaging of FTH1in H9c2 cells. (green: FTH1, red: LAMP, blue: DAPI, scale bars: 20 µm). B–D,F,H–J,M) Some of the data was normalized. Summary data are presented as the mean ± SEM. Statistical significance was determined using one‐way ANOVA with Tukey's multiple comparisons test. *p < 0.05, **p < 0.01, ***p < 0.001, ****p < 0.0001. Abbreviations: DOX, doxorubicin; PrA, protosappanin A; SEM, standard error of mean.
Figure 7
Figure 7
PrA ameliorates ischemia/reperfusion (I/R)‐induced cardiac injury and ferroptosis. A) Schematic diagram of animal experiment process. Time points in the image are representative. B) Serum LDH and C) CK‐MB (fivefold dilution) levels were measured in mice 24 h after sham or I/R surgery, treated with or without PrA (20 mg kg−1 i.g.) (n = 6 per group). D) Evans blue/triphenyltetrazolium chloride (TTC) staining of heart sections in mice 24 h after sham or I/R surgery, treated with or without PrA (20 mg kg−1 i.g.) (scale bars:100 µm). E–I) Representative echocardiographic images from mice 7 d after sham or I/R surgery, treated with or without PrA (20 mg kg−1 i.g.). F–I) Quantitative analysis of LVEF, FS, LVIDd, and LVIDs (n = 6 per group). J) Representative images of Masson's trichrome staining in mice 7 d after sham or I/R surgery, treated with or without PrA (20 mg kg−1 i.g.) (scale bars:1 mm, n = 6 per group). K) Relative mRNA levels of Ptgs2 (n = 6 per group). Quantitative analysis of L) cardiac MDA and (M) serum MDA (n = 6 per group). N) Western blots of cardiac GPX4, ACSL4, and FTH1 (n = 6 per group). O,P) Representative images of Prussian blue iron staining with DAB enhancement (O, scale bar:100 µm) and fluorescent immunohistochemistry staining for DHE (P, scale bar: 20 µm). B,K) Some of the data was normalized. Summary data are presented as the mean ± SEM. Statistical significance was determined using one‐way ANOVA with Tukey's multiple comparisons test. *p < 0.05, **p < 0.01, ***p < 0.001, ****p < 0.0001. Abbreviations: CK‐MB,  creatine kinase‐MB; LDH, lactate dehydrogenase; i.g., intragastric; PrA, protosappanin A.

References

    1. Rayson D., Richel D., Chia S., Jackisch C., van der Vegt S., Suter T., Ann. Oncol. 2008, 19, 1530. - PubMed
    1. Raber I., Asnani A., Cardiovasc. Res. 2019, 115, 915. - PubMed
    1. Lyon A. R., Lopez‐Fernandez T., Couch L. S., Asteggiano R., Aznar M. C., Bergler‐Klein J., Boriani G., Cardinale D., Cordoba R., Cosyns B., Cutter D. J., de Azambuja E., de Boer R. A., Dent S. F., Farmakis D., Gevaert S. A., Gorog D. A., Herrmann J., Lenihan D., Moslehi J., Moura B., Salinger S. S., Stephens R., Suter T. M., Szmit S., Tamargo J., Thavendiranathan P., Tocchetti C. G., van der Meer P., van der Pal H. J. H., et al., Eur. Heart J. 2022, 43, 4229. - PubMed
    1. Dixon S. J., Lemberg K. M., Lamprecht M. R., Skouta R., Zaitsev E. M., Gleason C. E., Patel D. N., Bauer A. J., Cantley A. M., Yang W. S., Morrison B. 3rd, Stockwell B. R., Cell. 2012, 149, 1060. - PMC - PubMed
    1. Li J., Cao F., Yin H. L., Huang Z. J., Lin Z. T., Mao N., Sun B., Wang G., Cell Death Dis. 2020, 11, 88. - PMC - PubMed

LinkOut - more resources