. 2024 Jul 1;151(13):dev202310.
doi: 10.1242/dev.202310. Epub 2024 Jul 10.

Mechanical forces remodel the cardiac extracellular matrix during zebrafish development

Affiliations

Mechanical forces remodel the cardiac extracellular matrix during zebrafish development

Alessandra Gentile et al. Development. .

Abstract

The cardiac extracellular matrix (cECM) is fundamental for organ morphogenesis and maturation, during which time it undergoes remodeling, yet little is known about whether mechanical forces generated by the heartbeat regulate this remodeling process. Using zebrafish as a model and focusing on stages when cardiac valves and trabeculae form, we found that altering cardiac contraction impairs cECM remodeling. Longitudinal volumetric quantifications in wild-type animals revealed region-specific dynamics: cECM volume decreases in the atrium but not in the ventricle or atrioventricular canal. Reducing cardiac contraction resulted in opposite effects on the ventricular and atrial ECM, whereas increasing the heart rate affected the ventricular ECM but had no effect on the atrial ECM, together indicating that mechanical forces regulate the cECM in a chamber-specific manner. Among the ECM remodelers highly expressed during cardiac morphogenesis, we found one that was upregulated in non-contractile hearts, namely tissue inhibitor of matrix metalloproteinase 2 (timp2). Loss- and gain-of-function analyses of timp2 revealed its crucial role in cECM remodeling. Altogether, our results indicate that mechanical forces control cECM remodeling in part through timp2 downregulation.

Keywords: Biomechanical forces; Cardiac ECM remodeling; Cardiac development; Zebrafish cardiogenesis.


Conflict of interest statement

Competing interests The authors declare no competing or financial interests.

Figures
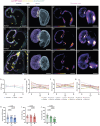
Fig. 1.
Fig. 1.
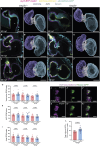
cECM remodeling during cardiac morphogenesis. (A-C‴) cECM dynamics in the same animal from 50 to 98 hpf. Single-plane images (A-C) and 3D surface renderings (A′-C′) of confocal images, as well as single-plane (A″-C″) and maximum intensity projection (A‴-C‴) thickness maps of wild-type hearts at 50, 74 and 98 hpf. Color brightness in the thickness maps (A″-C‴) correlates with tissue/ECM thickness. White indicates higher tissue/ECM thickness, and purple indicates lower tissue/ECM thickness. Tg(myl7:BFP-CAAX) expression marks the myocardial chambers, Tg(kdrl:nls-mCherry) expression marks the endocardial chambers, and Tg(ubb:ssNcan-GFP) expression labels hyaluronic acid, which is present in the cardiac ECM. (D-J) Quantification of the cECM index (percentage of the ECM volume relative to the total cardiac tissue volume) in the ventricle (D,E,H), the AVC (D,F,I) and the atrium (D,G,J) from 50 to 98 hpf. Between 50 and 98 hpf, the cECM index remains constant in the ventricle and AVC and progressively decreases in the atrium. n=14 (D-J); plot values represent mean±s.d. (D,H-J); P-values determined by one-way ANOVA followed by multiple comparisons with Dunn test (H-J). Scale bars: 30 µm. A, atrium; AVC, atrioventricular canal; V, ventricle.
Fig. 2.
Fig. 2.
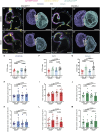
Mechanical forces regulate cECM dynamics in a region-specific manner. (A-F′) Wild-type hearts before (50 hpf; A,A′,C,C′,E,E′) and after (74 hpf; B,B′,D,D′,F,F′) 24-h treatments with DMSO control (A-B′), IBMX (C-D′) or BDM (E-F′). Single-plane images are shown in A-F and 3D surface renderings in A′-F′. Images before and after treatment were taken of the same animals. (G-I) cECM index of IBMX- or BDM-treated hearts compared with DMSO-treated hearts at 74 hpf. A reduction of the ventricular ECM index was observed in IBMX- and BDM-treated hearts (G). For the AVC (H) and atrial (I) ECM indices, increases were observed in BDM-treated hearts, whereas no changes were observed in IBMX-treated hearts (H,I). n=7 for DMSO, 8 for IBMX, and 7 for BDM (G-I); plot values represent mean±s.d.; P-values determined by one-way ANOVA followed by multiple comparisons with Dunn test. Scale bars: 30 µm. A, atrium; AVC, atrioventricular canal; V, ventricle.
Fig. 3.
Fig. 3.
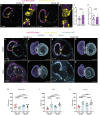
timp2b expression is upregulated in hearts contracting at a reduced rate. (A-C) Relative mRNA levels of timp2b, timp2a, mmp2, mmp14a and mmp14b from extracted hearts of tnnt2a morphants and uninjected controls at 50 (A), 74 (B) and 98 hpf (C). (D) Relative mRNA levels of timp2b, timp2a, mmp2, mmp14a and mmp14b from extracted hearts of 74 hpf zebrafish treated for 24 h with BDM or DMSO. (E) Relative timp2b mRNA levels from extracted hearts of 74 hpf zebrafish treated for 24 h with Tricaine or DMSO. (F) Relative timp2b mRNA levels from extracted hearts of 50, 74 and 98 hpf zebrafish treated for 24 h with IBMX or DMSO. timp2b expression is significantly upregulated upon reduced cardiac contraction (tnnt2a morpholino, BDM and Tricaine treatments), but remains unaffected upon increased heart rate (IBMX treatment). n=4 biological replicates, 25 hearts each. Plot values represent mean±s.d.; P-values determined by Mann–Whitney U test. FC, fold change. See Table S6 for Ct values.
Fig. 4.
Fig. 4.
timp2b mutant hearts exhibit increased cECM thickness in the atrial side of the AVC. (A-F′) Single-plane images and 3D surface renderings of timp2b+/+ (A-C′) and timp2b−/− (D-F′) sibling hearts at 50, 74 and 98 hpf. cECM thickness is increased in the atrial side of the AVC (white arrowheads in D-F) in timp2b−/− hearts compared with timp2b+/+ sibling hearts. (G-I) Quantification of the ventricular, AVC and atrial ECM indices at 50, 74 and 98 hpf. (J-K″) Single-plane images of AV valves from 74 hpf timp2b−/− and timp2b+/+ sibling larvae. Valve EdCs are labeled by Tg(TCF:nls-mCherry) and Tg(Hhexin:GFP) expression. (L) Quantification of the total number of Tg(Hhexin:GFP)+; Tg(TCF:nls-mCherry)+ cells at 74 hpf shows an increased number of valve cells in timp2b−/− compared with timp2b+/+ sibling larvae. n=13 for timp2b+/+ and 15 for timp2b−/− (G-I); n=11 for timp2b+/+ and 15 for timp2b−/− (L). Plot values represent mean±s.d.; P-values determined by one-way ANOVA followed by multiple comparisons with Dunn test (G-I) and by unpaired two-tailed Student's t-test (L). Scale bars: 30 µm (A-F′); 20 µm (J-K″). A, atrium; AVC, atrioventricular canal; V, ventricle.
Fig. 5.
Fig. 5.
Mechanical forces regulate cECM organization at least in part through timp2b. (A-D′) 74 hpf timp2b+/+ and timp2b−/− sibling hearts following treatment with DMSO and BDM starting at 50 hpf. Single-plane images and 3D surface renderings of 74 hpf timp2b+/+ (A,A′,C,C′) and timp2b−/− (B,B′,D,D′) sibling hearts following treatment with DMSO (A-B′) or BDM (C-D′) starting at 50 hpf. (E-G) Quantification of ventricular (E), AVC (F) and atrial (G) ECM indices of 74 hpf timp2b+/+ and timp2b−/− sibling hearts following treatment with BDM compared with DMSO controls starting at 50 hpf. BDM-induced reduction of the cECM index in timp2b+/+ ventricles is not apparent in timp2b−/− ventricles (E), indicating that timp2b expression is needed for the mechanical force-induced loss of the ventricular cECM index. cECM index in the AVC (F) and atrium (G) is still significantly higher when BDM treatment was used instead of DMSO treatment on timp2b+/+ and timp2b−/− siblings. (H-J) Quantification of the ventricular (H), AVC (I) and atrial (J) volumes. (K-M) Quantification of the ventricular (K), AVC (L) and atrial (M) lumen volumes. n=11 for DMSO, timp2b+/+; 8 for BDM, timp2b+/+; 11 for DMSO, timp2b−/−; and 10 for BDM, timp2b−/−. Plot values represent mean±s.d.; P-values determined by one-way ANOVA followed by multiple comparisons with Dunn test. Scale bars: 30 µm. A, atrium; AVC, atrioventricular canal; V, ventricle.
Fig. 6.
Fig. 6.
timp2 overexpression leads to enlarged cardiac valves and increased AVC and atrial ECM index. (A-B′) Single-plane images and close-up of AV valves of 74 hpf control (A,A′) and timp2b-overexpressing [Tg(fli1a:Gal4); Tg(UAS:timp2b-p2a-GFP); B,B′] hearts. There is noticeable enlargement of the valve observed in timp2b-overexpressing hearts (B′) compared with control (A′). (C,C′) Quantification of 3D valve tissue volumes in control and timp2b-overexpressing larvae at 74 hpf. When timp2b is overexpressed in EdCs, a significantly increased valve tissue volume is observed in the superior leaflet, but not in the inferior leaflet. (D-G′) Single-plane images and 3D surface renderings of 74 hpf control (D,D′,F,F′) and timp2b-overexpressing (E,E′,G,G′) hearts treated with DMSO (D-E′) or BDM (F-G′) starting at 50 hpf. Upon BDM treatment, timp2b overexpression leads to severe cardiac defects (G,G′) that appear worse than those in BDM-treated control larvae (F,F′). (H-J) Quantification of cECM index of 74 hpf control and timp2b-overexpressing hearts treated with DMSO or BDM starting at 50 hpf. Increased AVC (I) and atrial (J) cECM index is observed in timp2b-overexpressing hearts treated with DMSO. n=7 for timp2b+/+ and 7 for timp2bOE (C,C′); 8 for DMSO, timp2b+/+; 7 for BDM, timp2b+/+; 8 for DMSO, timp2bOE; and 6 for BDM, timp2bOE. Plot values represent mean±s.d.; P-values determined by unpaired two tailed Student's t-test (C,C′) or one-way ANOVA followed by multiple comparisons with Dunn test (H-J). Scale bars: 20 µm (A,B); 10 µm (A′,B′); 30 µm (D-G′). A, atrium; AVC, atrioventricular canal; V, ventricle.

References

    1. Bartman, T., Walsh, E. C., Wen, K. K., McKane, M., Ren, J., Alexander, J., Rubenstein, P. A. and Stainier, D. Y. R. (2004). Early myocardial function affects endocardial cushion development in zebrafish. PLoS Biol. 2, E129. 10.1371/journal.pbio.0020129 - DOI - PMC - PubMed
    1. Bornhorst, D., Xia, P., Nakajima, H., Dingare, C., Herzog, W., Lecaudey, V., Mochizuki, N., Heisenberg, C. P., Yelon, D. and Abdelilah-Seyfried, S. (2019). Biomechanical signaling within the developing zebrafish heart attunes endocardial growth to myocardial chamber dimensions. Nat. Commun. 10, 4113. 10.1038/s41467-019-12068-x - DOI - PMC - PubMed
    1. Chi, N. C., Shaw, R. M., De Val, S., Kang, G., Jan, L. Y., Black, B. L. and Stainier, D. Y. R. (2008). Foxn4 directly regulates tbx2b expression and atrioventricular canal formation. Genes Dev. 22, 734-739. 10.1101/gad.1629408 - DOI - PMC - PubMed
    1. Chiquet-Ehrismann, R., Tannheimer, M., Koch, M., Brunner, A., Spring, J., Martin, D., Baumgartner, S. and Chiquet, M. (1994). Tenascin-C expression by fibroblasts is elevated in stressed collagen gels. J. Cell Biol. 127, 2093-2101. 10.1083/jcb.127.6.2093 - DOI - PMC - PubMed
    1. Collins, M. M. and Stainier, D. Y. R. (2016). Organ function as a modulator of organ formation: lessons from zebrafish. Curr. Top. Dev. Biol. 117, 417-433. 10.1016/bs.ctdb.2015.10.017 - DOI - PubMed

MeSH terms

Substances

LinkOut - more resources