

doi: 10.1002/ctm2.1688.
Salbutamol repurposing ameliorates neuromuscular junction defects and muscle atrophy in Col6a1-/- mouse model of collagen VI-related myopathies
Affiliations
- PMID: 38984773
- PMCID: PMC11234414
- DOI: 10.1002/ctm2.1688
Item in Clipboard
Salbutamol repurposing ameliorates neuromuscular junction defects and muscle atrophy in Col6a1-/- mouse model of collagen VI-related myopathies
Clin Transl Med.
2024 Jul.
No abstract available
Conflict of interest statement
The authors declare no conflicts of interest.
Figures
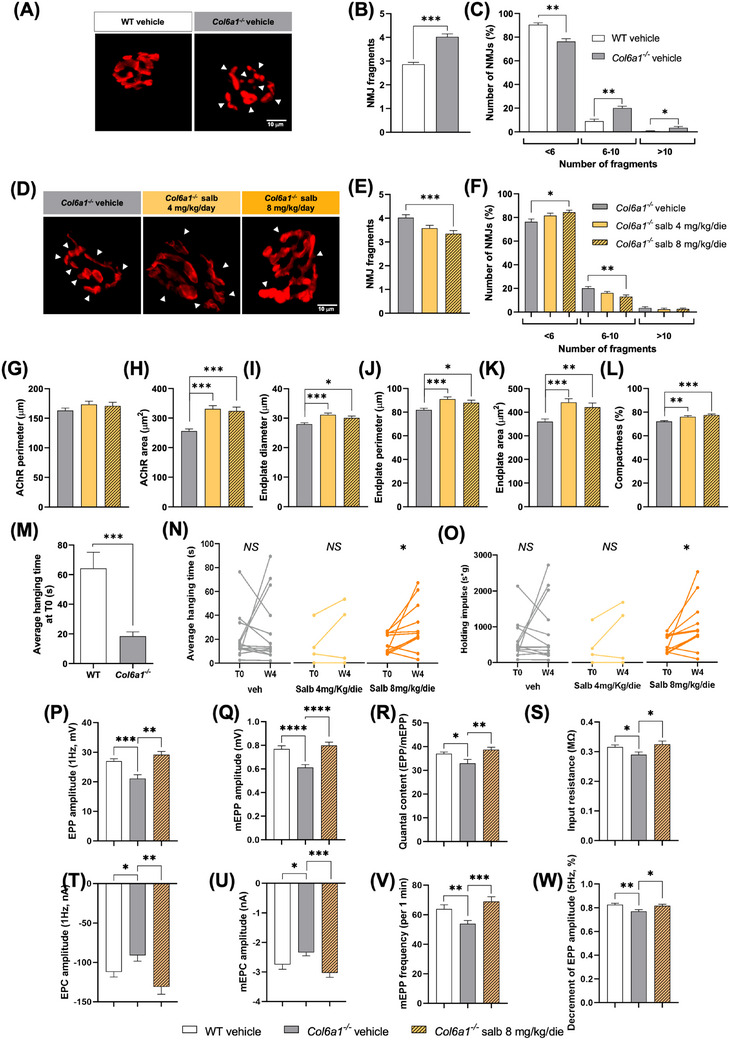
Salbutamol treatment ameliorates neuromuscular junction (NMJ) fragmentation, promotes NMJ remodelling and induces NMJ functional improvement in Col6a1−/−
mice. (A) Whole‐mount hemidiaphragms preparations of vehicle‐treated WT and Col6a1−
/− mice, stained with 555‐BTX. White arrowheads indicate AChR cluster fragments. Scale bar, 10 µm. (B) Quantification of the average number of fragments per NMJ in vehicle‐treated WT versus Col6a1−
/− mice. Data are shown as mean ± s.e.m. (***p < .001; Mann–Whitney test; n = 546–604 NMJs from 5 to 7 mice, each group). (C) Percentage of total NMJs displaying the number of fragments reported in the x‐axis in vehicle‐treated WT versus Col6a1−
/− mice. Data are shown as mean ± s.e.m. (*p < .05; **p < .01; Mann–Whitney test; n = 5–7 mice, each group). (D) Whole‐mount hemidiaphragm preparations of vehicle‐ and salbutamol‐treated Col6a1−
/− mice, stained with 555‐BTX to highlight AChR cluster fragmentation (white arrowheads). Scale bar, 10 µm. (E) Quantification of the average number of fragments per NMJ in vehicle‐ versus salbutamol‐treated Col6a1−
/− mice. Data are shown as mean ± s.e.m. (***p < .001; Kruskal–Wallis test with Dunn's post hoc test for multiple comparisons; n = 352–604 NMJs from 4 to 7 mice, each group). (F) Percentage of total NMJs displaying the number of fragments reported in the x‐axis in vehicle‐ versus salbutamol‐treated Col6a1−
/− mice. Data are shown as mean ± s.e.m. (*p < .05; **p < .01; Kruskal–Wallis test with Dunn's post hoc test for multiple comparisons; n = 4–7 mice, each group). (G–L) Quantitative analysis of postsynaptic parameters in diaphragm muscles of vehicle‐ and salbutamol‐treated Col6a1−
/− mice, showing AChR perimeter (G) and area (H), and endplate diameter (I), perimeter (J), area (K) and compactness (L). Data are shown as mean ± s.e.m. (*p < .05, **p < .01; ***p < .001; Kruskal–Wallis test with Dunn's post hoc test for multiple comparison; n = 96–147 NMJs from 4 to 7 mice, each group). (M) Average hanging time of WT and Col6a1−
/− mice subjected to the four‐limb hanging test at T0 (before treatment). Data are shown as mean ± s.e.m. (***p < .001; Mann–Whitney test; n = 28–30 mice, each group). (N, O) Individual four‐limb hanging performances of Col6a1−
/− mice before (T0) and after (W4) 4‐week‐long treatment with vehicle or salbutamol. The average hanging time (N) and the holding impulse (O) are shown as outcome measures (*p < .05; NS, not significant; two‐tailed paired t‐test for parametric data and Wilcoxon matched pairs signed rank test for non‐parametric data; n = 5–15 mice, each group). (P–W) Quantitative analysis of electrophysiological parameters measured in ex vivo diaphragm preparations of vehicle‐treated WT mice, vehicle‐treated Col6a1−
/− mice and 8 mg/kg/die salbutamol‐treated Col6a1−
/− mice, showing nerve‐evoked endplate potentials (EPP) (P) and miniature endplate potentials (mEPP) (Q) amplitudes, quantal content (R), input resistance (S), endplate currents (EPC) (T), miniature endplate currents (mEPC) (U), frequency of mEPP (V), and EPP amplitude decrement at 5 Hz (W). Error bars indicate s.e.m. (*p < .05; **p < .01; ***p < .001; unpaired two‐tailed Student's t‐test; n = 8 mice, each group). AChR, acetylcholine receptor; Salb, salbutamol; veh, vehicle; WT, wild type.
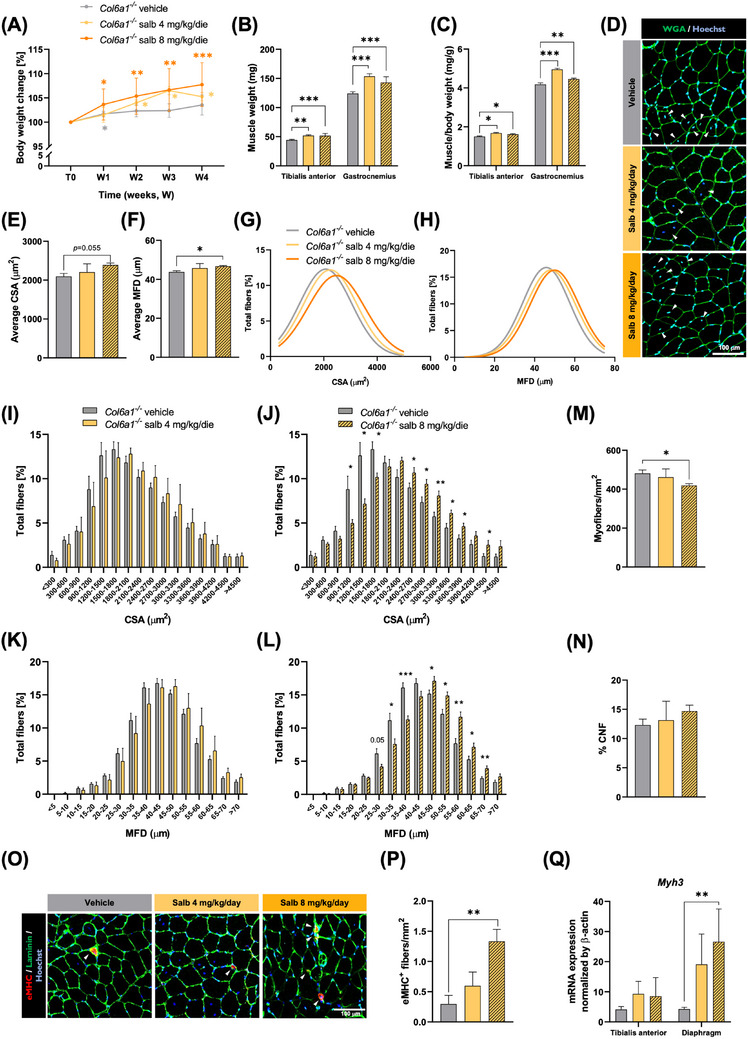
Salbutamol remodels skeletal muscle in Col6a1−
/− mice. (A) Growth curve showing changes in body weight over the 4 weeks of treatment (W1–W4) in vehicle‐ and salbutamol‐treated Col6a1
−/− mice. The values registered at each time point are expressed as a percentage of the value measured before treatment (T0). Data are shown as mean ± s.e.m. (*p < .05; **p < .01; ***p < .001, compared to T0 within the same group; 2‐way analysis of variance (ANOVA) test with Dunnet's post hoc test for multiple comparisons; n = 4–13 mice, each group). (B, C) Absolute (B) and normalised (C) weight of tibialis anterior (TA) and gastrocnemius muscles of vehicle‐ and salbutamol‐treated Col6a1−/‐
mice. Data are shown as mean ± s.e.m. (*p < .05; **p < .01; ***p < .001; Kruskal–Wallis test with Dunn's post hoc test for multiple comparisons for non‐parametric data or one‐way ANOVA test with Dunnett's post hoc test for multiple comparisons for parametric data; n = 8–32 muscles, each group). (D) Representative fluorescence microscopy images of cross‐sections of TA muscle from vehicle‐ and salbutamol‐treated Col6a1−/‐
mice, stained with fluorophore‐conjugated wheat germ agglutinin (WGA, green) and Hoechst (blue). Arrowheads point at centrally located nuclei. Scale bar, 100 µm. (E, F) Quantification of myofibre cross‐sectional area (CSA) (E) and minimum Feret's diameter (MFD) (F) in vehicle‐ and salbutamol‐treated Col6a1−/−
mice. Data are shown as mean ± s.e.m. (*p < .05; one‐way ANOVA test with Dunnett's post hoc test for multiple comparisons; n = 3–8 mice, each group). (G, H) Graphical representation of CSA (G) and MFD (H) distribution among myofibres. The curves were fitted to data using non‐linear regression (Gaussian). (I–L) Comparison of CSA (I, J) and MFD (K, L) distribution among myofibres between vehicle‐treated and low‐dose (I, K) or high‐dose (J, L) salbutamol‐treated Col6a1−/−
muscles. Data are shown as mean ± s.e.m. (*p < .05; **p < .01; ***p < .001; multiple unpaired two‐tailed Student's t‐tests; n = 3–8 mice, each group). (M) Quantification of myofibre density, calculated as the number of myofibres per total area, in vehicle‐ and salbutamol‐treated Col6a1−/−
mice. Data are shown as mean ± s.e.m. (*p < .05; one‐way ANOVA test with Dunnett's post hoc test for multiple comparisons; n = 3–8 mice, each group). (N) Quantification of the percentage of centrally nucleated fibres (CNF) per muscle section in vehicle‐ and salbutamol‐treated Col6a1−/−
mice. Data are shown as mean ± s.e.m. (one‐way ANOVA with Dunnet's post hoc test for multiple comparisons; n = 3–8 mice, each group). (O) Representative confocal micrographs of TA cross‐sections from vehicle‐ and salbutamol‐treated Col6a1−/−
mice, stained with Hoechst (blue) and antibodies for embryonic myosin heavy chain (eMHC, red) and laminin (green). White arrowheads indicate eMHC‐positive myofibres. Scale bar, 100 µm. (P) Quantification of eMHC‐positive myofibres per area unit (in mm2), based on confocal micrographs as in (O). Data are shown as mean ± s.e.m. (**p < .01; one‐way ANOVA test with Dunnett's post hoc test for multiple comparisons; n = 3–6 mice, each group). (Q) Real‐time quantitative polymerase chain reaction (RT‐qPCR) analysis of myosin heavy chain 3 (Myh3) transcript levels in TA and diaphragm muscles of vehicle‐ and salbutamol‐treated Col6a1−/−
mice. Data are shown as mean ± s.e.m. (**p < .01; one‐way ANOVA test with Dunnett's post hoc test for multiple comparisons; n = 4–9 mice, each group). Salb, salbutamol.
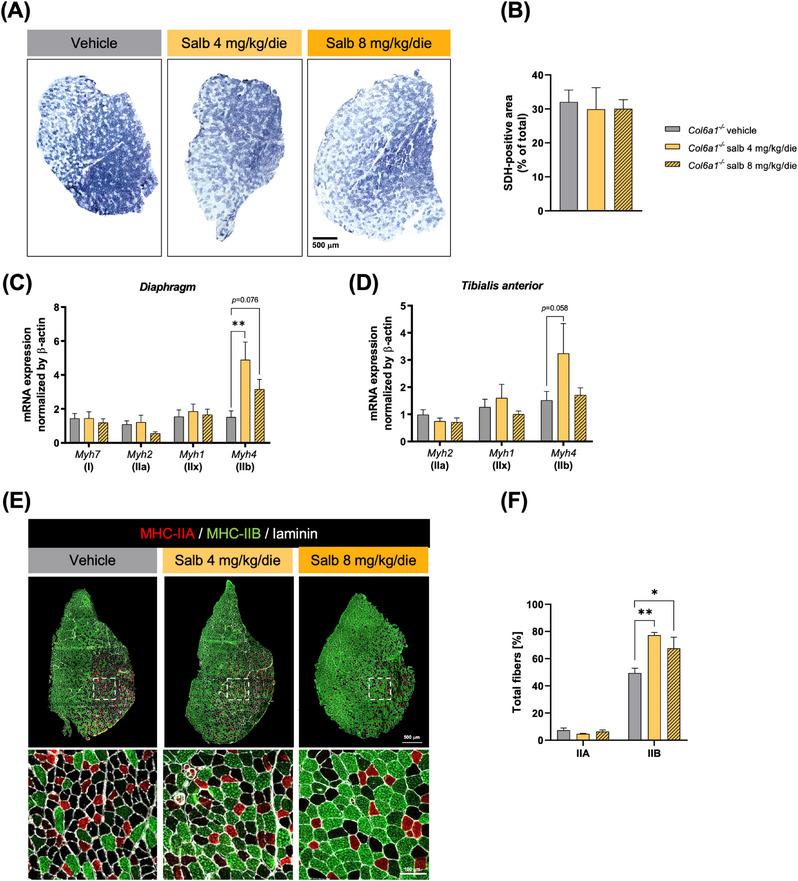
Salbutamol modifies muscle fibre composition in Col6a1
−
/
− mice. (A) Representative reconstruction of optical micrographs of TA cross‐sections from vehicle‐ and salbutamol‐treated Col6a1−/
− mice, following histochemical succinate dehydrogenase (SDH) staining. SDH‐positive fibres are stained in dark blue, whereas SDH‐negative fibres are stained in light blue. Scale bar, 500 µm. (B) Quantification of SDH‐positive area, determined by SDH staining as in (A). Data are shown as mean ± s.e.m. (Kruskal–Wallis test with Dunn's post hoc test for multiple comparisons; n = 3–6 mice, each group). (C, D) RT‐qPCR quantification of the levels of transcripts for different myosin heavy chain (MHC) isoforms in the diaphragm (C) and TA (D) muscles of vehicle‐ and salbutamol‐treated Col6a1−/‐
mice. Data are shown as mean ± s.e.m. (**p < .01; one‐way ANOVA test with Dunnett's post hoc test for multiple comparisons; n = 4–9 mice, each group). (E) Representative merged fluorescence microscopy images of whole TA cross‐sections from vehicle‐ and salbutamol‐treated Col6a1−/−
mice, stained with antibodies against MHC‐IIA (red), MHC‐IIB (green) and laminin (white). Dotted white squares highlight the areas shown at higher magnification in the bottom panels. Scale bars, 500 µm (top panels) or 100 µm (bottom panels). (F) Quantification of the percentages of type IIA and type IIB fibres, based on immunofluorescent images as in (E). Data are shown as mean ± s.e.m. (*p < .05; **p < .01; one‐way ANOVA test with Dunnett's post hoc test for multiple comparisons; n = 3–5 mice, each group). Salb, salbutamol.
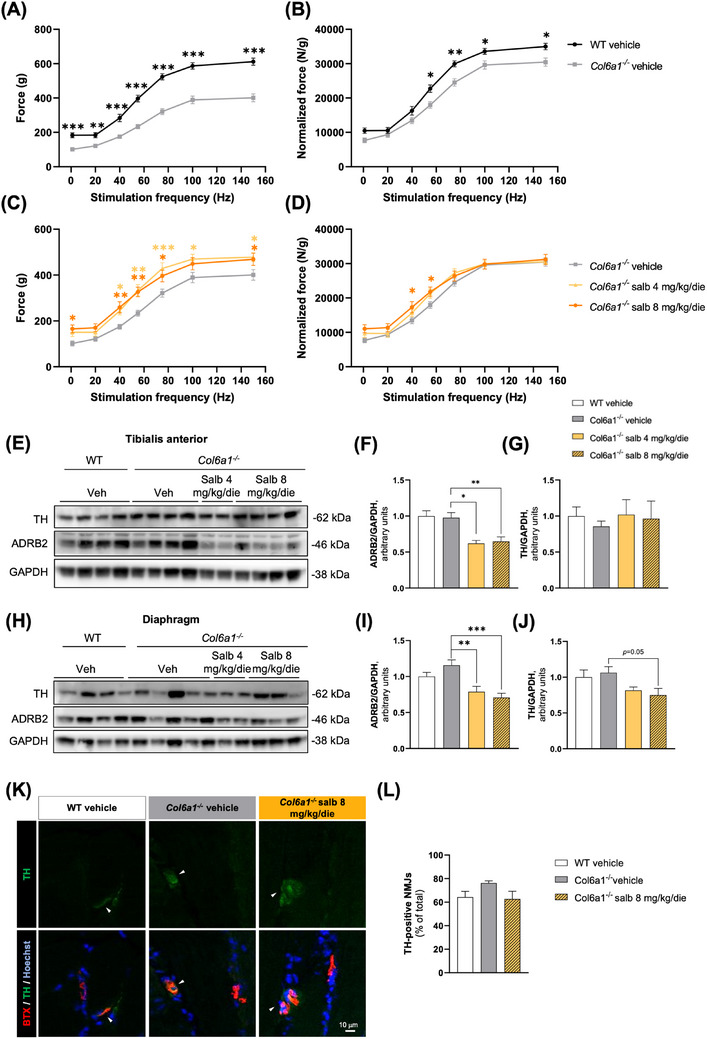
One‐month salbutamol treatment ameliorates muscle force in Col6a1−/−
mice and leads to ADRB2 downregulation. (A, B) Absolute (A) and normalised (B) in vivo force measurements of gastrocnemius muscle from vehicle‐treated WT and Col6a1−
/
−
mice. Whole curves of stepwise stimulation frequencies are shown. Tetanus was reached at a stimulation frequency of 100 Hz. Data are shown as mean ± s.e.m. (*p < .05; **p < .01; ***p < .001, comparing vehicle treatment in different genotypes at each stimulation frequency; multiple unpaired t‐tests with Holm–Sidak method to correct for multiple comparisons; n = 12–16 limbs, each group). (C, D) Absolute (C) and normalised (D) in vivo force measurements of gastrocnemius muscle from vehicle‐treated and salbutamol‐treated Col6a1−
/
−
mice. Whole curves of stepwise stimulation frequencies are shown. Tetanus was reached at a stimulation frequency of 100 Hz. Data are shown as mean ± s.e.m. (*p < .05; **p < .01; ***p < .001, comparing salbutamol treatment to vehicle treatment within the same genotype, at each stimulation frequency; two‐way ANOVA with Dunnett's post hoc test for pairwise comparisons; n = 8–12 limbs, each group). (E) Representative western blot for ADRB2 and TH in total protein extracts of TA muscle from vehicle‐treated WT mice and vehicle‐ and salbutamol‐treated Col6a1−/−
mice. Glyceraldehyde‐3‐phosphate dehydrogenase (GAPDH) was used as a loading control. (F) Densitometric quantification of ADRB2 levels normalised to GAPDH levels, determined by three independent western blot experiments as in (E). Data are shown as mean ± s.e.m. (*p < .05; **p < .01; one‐way ANOVA with Dunnett's post hoc test for multiple comparisons; n = 4–9 mice, each group). (G) Densitometric quantification of TH levels normalised to GAPDH levels, determined by two independent western blot experiments as in (E). Data are shown as mean ± s.e.m. (one‐way ANOVA with Dunnett's post hoc test for multiple comparisons; n = 4–9 mice, each group). (H) Representative western blot for ADRB2 and TH in total protein extracts of diaphragm muscle from vehicle‐treated WT mice and vehicle‐ and salbutamol‐treated Col6a1−
/‐ mice. GAPDH was used as a loading control. (I) Densitometric quantification of ADRB2 levels normalised to GAPDH levels, determined by two independent western blot experiments as in (G). Data are shown as mean ± s.e.m. (**p < .01; one‐way ANOVA with Dunnett's post hoc test for multiple comparisons; n = 4–9 mice, each group). (J) Densitometric quantification of TH levels normalised to GAPDH levels, determined by two independent western blot experiments as in (G). Data are shown as mean ± s.e.m. (one‐way ANOVA with Dunnett's post hoc test for multiple comparisons; n = 4–9 mice, each group). (K) Representative fluorescence microscopy images of longitudinal sections of gastrocnemius muscles from vehicle‐treated WT and vehicle‐ and high‐dose salbutamol‐treated Col6a1−/−
mice, stained with an antibody against TH (green), 555‐BTX (red) and Hoechst. Scale bar, 10 µm. (L) Quantification of the percentages of NMJs showing TH staining according to (K). Data are shown as mean ± s.e.m. (Kruskal–Wallis test with Dunn's post hoc test for multiple comparisons; n = 3 mice, each group). More than 50 NMJs were analyzed for each sample. ADRB2, adrenergic receptor β2; Salb, salbutamol; TH, tyrosine hydroxylase; Veh, vehicle; WT, wild type.
References
Publication types
MeSH terms
Substances
Grants and funding
- #22360/AFM Telethon
- University of Padova
- GGP19229/Telethon Foundation
- P2022Y2A3L/Italian Ministry of Education, University and Research
- P20227YB93/Italian Ministry of Education, University and Research
- 201742SBXA/Italian Ministry of Education, University and Research
- HA3309/3-1/German Research Council
- HA3309/6-1/German Research Council
- HA3309/7-1/German Research Council
- National Center for Gene Therapy and Drugs Based on RNA Technology
- National Recovery and Resilience Plan (NRRP)
- Strengthening research structures for supporting the creation of National Centres, national R&D leaders on some Key Enabling Technologies
- Project CN00000041/European Union - Next Generation EU
- CUP B93D21010860004/European Union - Next Generation EU
LinkOut - more resources
Full Text Sources