. 2024 Aug 1;4(8):1919-1932.
doi: 10.1158/2767-9764.CRC-24-0027.

Tumor-Intrinsic Activity of Chromobox 2 Remodels the Tumor Microenvironment in High-grade Serous Carcinoma

Affiliations

Tumor-Intrinsic Activity of Chromobox 2 Remodels the Tumor Microenvironment in High-grade Serous Carcinoma

Ritsuko Iwanaga et al. Cancer Res Commun. .

Abstract

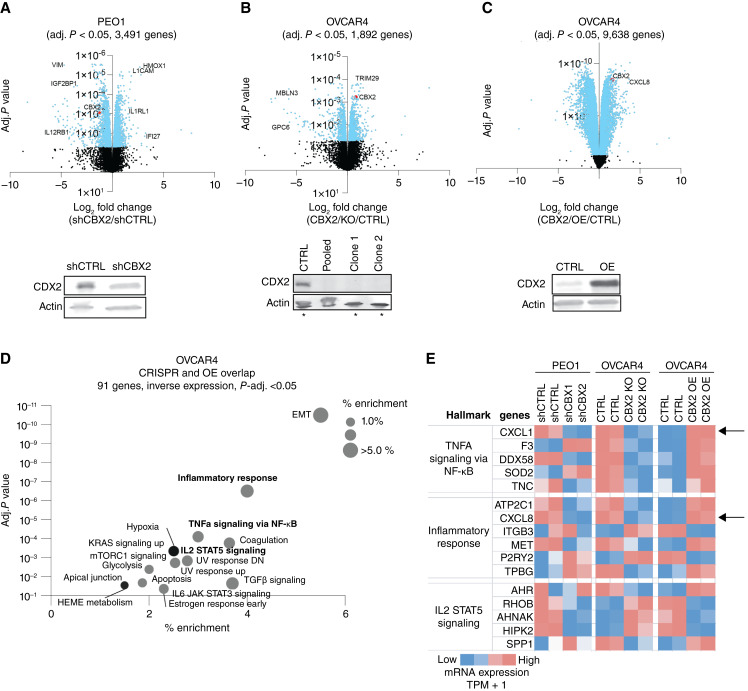
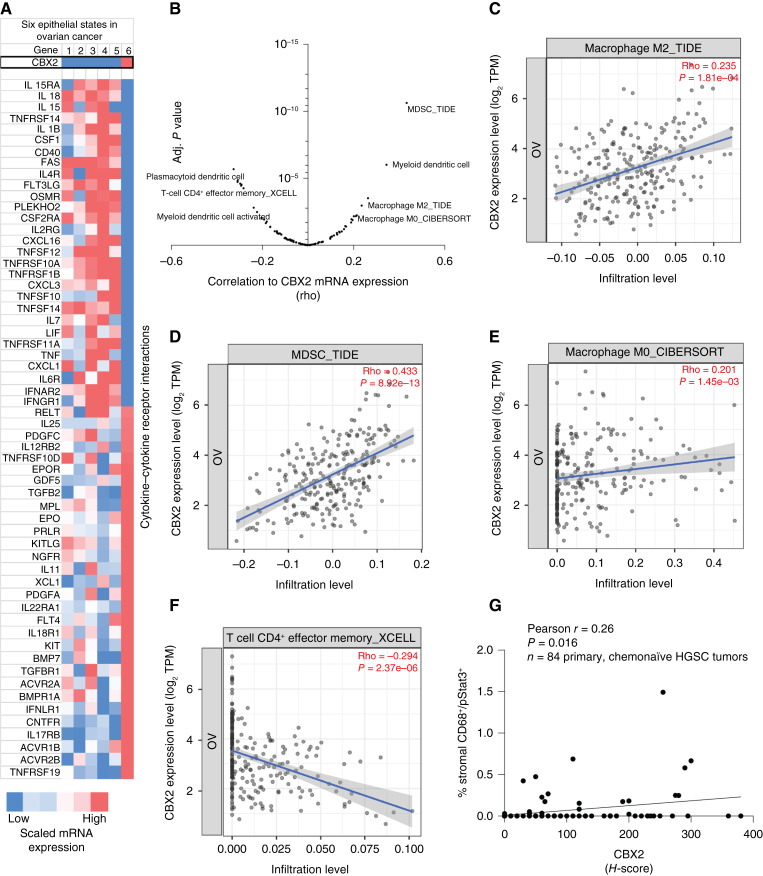
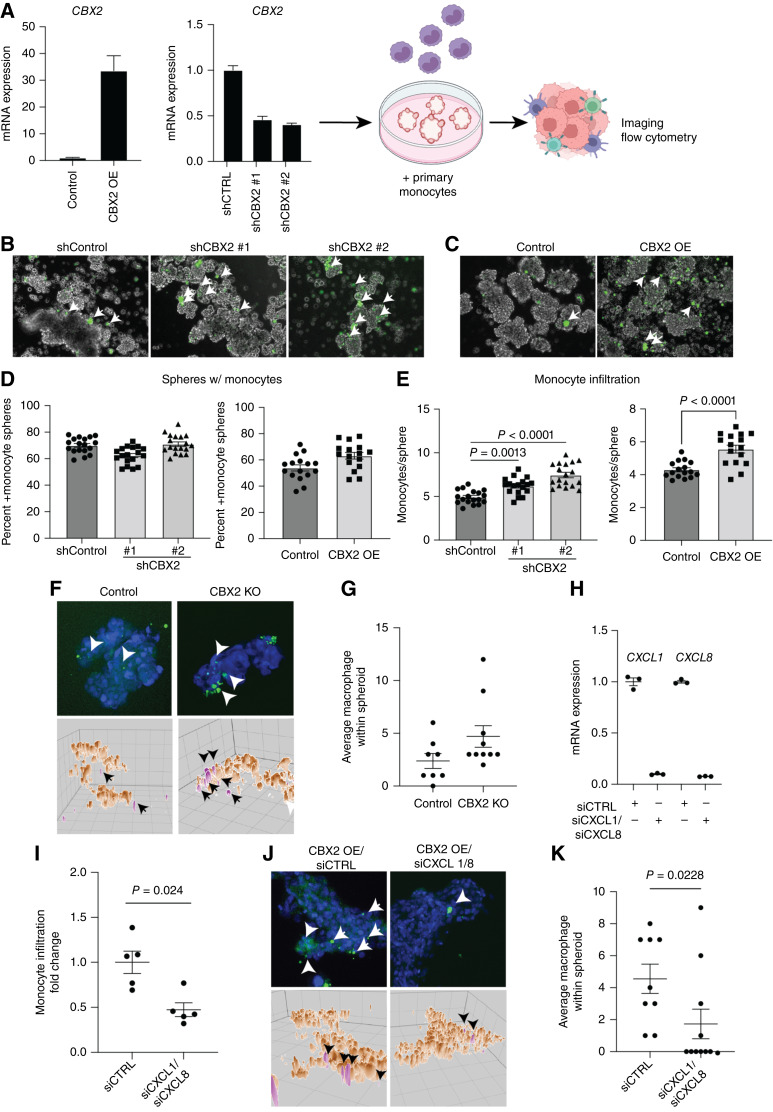
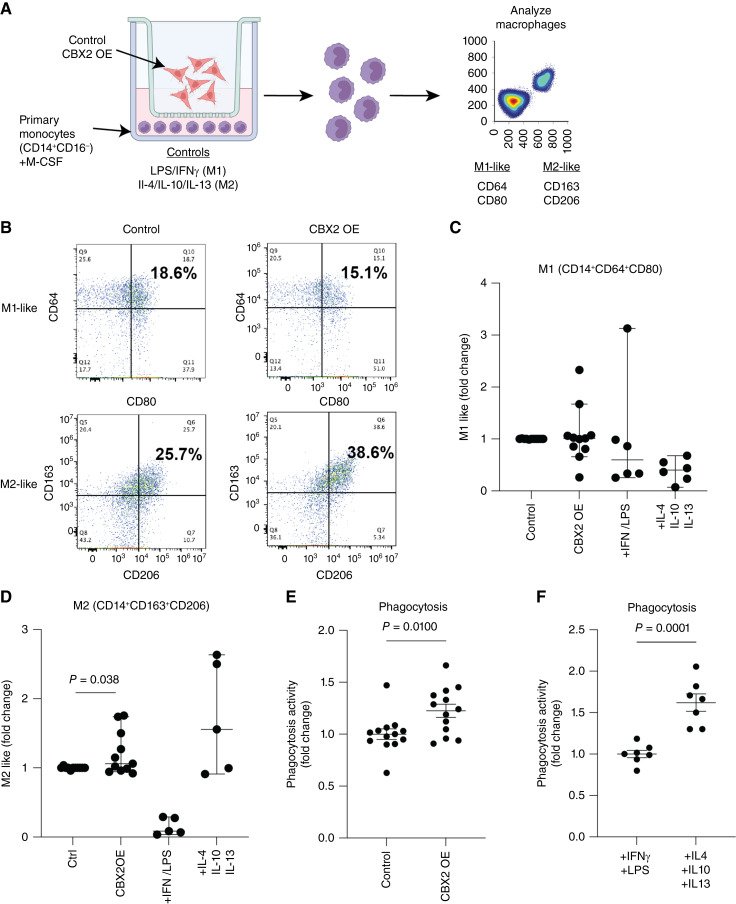
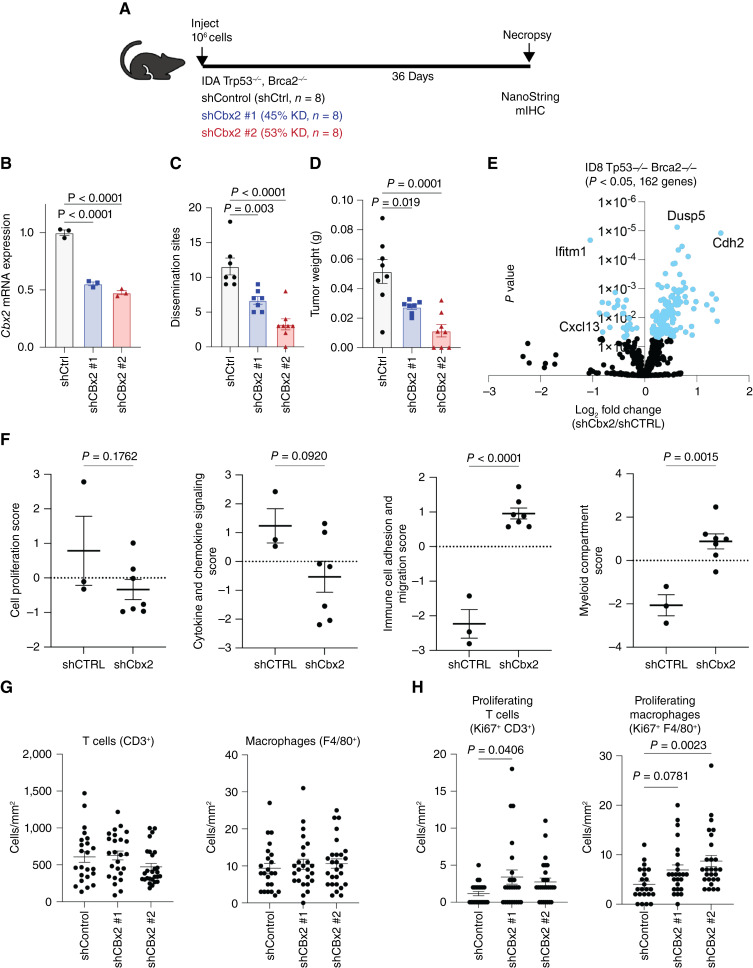
Chromobox 2 (CBX2), an epigenetic reader and component of polycomb repressor complex 1, is highly expressed in >75% of high-grade serous carcinoma. Increased CBX2 expression is associated with poorer survival, whereas CBX2 knockdown leads to improved chemotherapy sensitivity. In a high-grade serous carcinoma immune-competent murine model, knockdown of CBX2 decreased tumor progression. We sought to explore the impact of modulation of CBX2 on the tumor immune microenvironment (TIME), understanding that the TIME plays a critical role in disease progression and development of therapy resistance. Exploration of existing datasets demonstrated that elevated CBX2 expression significantly correlated with specific immune cell types in the TIME. RNA sequencing and pathway analysis of differentially expressed genes demonstrated immune signature enrichment. Confocal microscopy and co-culture experiments found that modulation of CBX2 leads to increased recruitment and infiltration of macrophages. Flow cytometry of macrophages cultured with CBX2-overexpressing cells showed increased M2-like macrophages and decreased phagocytosis activity. Cbx2 knockdown in the Trp53-null, Brca2-null ID8 syngeneic murine model (ID8 Trp53-/-Brca2-/-) led to decreased tumor progression compared with the control. NanoString immuno-oncology panel analysis suggested that knockdown in Cbx2 shifts immune cell composition, with an increase in macrophages. Multispectral immunohistochemistry (mIHC) further confirmed an increase in macrophage infiltration. Increased CBX2 expression leads to recruitment and polarization of protumor macrophages, and targeting CBX2 may serve to modulate the TIME to enhance the efficacy of immune therapies.

Significance: CBX2 expression correlates with the TIME. CBX2 modulation shifts the macrophage population, potentially leading to an immunosuppressive microenvironment, highlighting CBX2 as a target to improve efficacy of immunotherapy.


Conflict of interest statement

T. Danhorn reports grants from NIH during the conduct of the study. B.G. Bitler reports grants from NCI/NIH, ACS, DOD, and OCRA during the conduct of the study. L.W. Brubaker reports grant from OCRA during the conduct of the study and consulting work with AstraZeneca outside the submitted work, as well as a patent to CBX2 inhibitor pending. No disclosures were reported by the other authors.

Figures

Figure 1
Figure 1
CBX2 regulates immune transcriptional profiles. A, Volcano plot of differential gene expression based on shCBX2 vs. shCTRL in the PEO1 cell line. Immunoblot against CBX2 in PEO1 shCTRL and shCBX2 cells. Loading control, β-actin. B, Volcano plot of differential gene expression based on CBX2 KO vs. CTRL in the OVCAR4 cell line. Immunoblot against CBX2 in OVCAR4 CTRL and CBX2 KO. Loading control, β-actin. Asterisks indicate cell lines used for RNA-seq. C, Volcano plot of differential gene expression based on CBX2 OE vs. CTRL in the OVCAR cell line. Immunoblot against CBX2 in OVCAR4 control (CTRL) and CBX2 OE. Loading control, β-actin. D, Overlap of OVCAR4 CBX2 CRISPR knockout vs. OVCAR4 CBX2 OE. Inverse expression top hits: EMT and inflammatory response. E, Evaluation of hallmark pathways identified TNFα signaling via NF-κB inflammatory responses, and IL2 STAT5 signaling pathways. Direct relationship between CBX2 status and CXCL1 and CXCL8 (IL8) noted (black arrows).
Figure 2
Figure 2
CBX2 regulates immune-related pathways in a tumor cell–intrinsic fashion. A, Carcinoma EcoTyper epithelial states (S1–6) compared with CBX2 expression (top panel) and cytokine–cytokine receptor interaction pathway. B, Correlation (x-axis, rho) of CBX2 mRNA expression in 303 HGSC tumors with imputed cell type. Adjusted P value shown on y-axis. Imputation pipeline (e.g., CIBERSORT and TIDE) utilized follows underscore in title of plot (details included in Supplementary Table S4). C, Scatter plot of CBX2 mRNA expression and macrophage M2_TIDE. D, Scatter plot of CBX2 mRNA expression and MDSC_TIDE. E, Scatter plot of CBX2 mRNA expression and Macrophage M0_CIBERSORT. F, Scatter plot of CBX2 mRNA expression and T cell CD4+ effector memory_XCELL. G, An annotated tissue microarray was used to perform mIHC evaluating CBX2 expression and immune cell types. Plot demonstrating the relationship between % stromal CD68+/pStat3+ and CBX2 H-score. Statistical tests, unpaired t test (C) and Pearson correlation (D–G).
Figure 3
Figure 3
Modulation of CBX2 leads to shift in macrophage recruitment. A, OVCAR4 CBX2 OE and knockdown confirmation by qPCR. Diagram of protocol with direct co-culture of spheroids with primary monocytes. B, Confocal microscopy with infiltration of monocytes (green) increased with knockdown of CBX2. C, Confocal microscopy with infiltration of monocytes increased with overexpression of CBX2. D, Plots demonstrating the percentage of spheres with monocytes in shCBX2 or overexpression constructs. E, Plots demonstrating the number of spheres with CellTracker-positive monocytes in shCBX2 and overexpression. F, OVCAR4 (control) and CBX2 KO cells co-cultured with fluorescence-tagged primary monocytes (green, white arrowheads). Blue = nuclei. Images (top) are maximum projections of confocal z-stack and form-filling rendering [brown, cancer cells; pink, monocytes (black arrowheads)]. 50-micron grid. G, Quantification of F. H, qPCR of CXCL1 and CXCL8 in siControl (siCTRL) and siCXCL1/siCXCL8. Internal control, HPRT. I, Flow cytometric analysis of digested co-culture spheroids to measure monocyte infiltration. J, Same as F, but with siControl and siCXCL1/8 in cells overexpressing CBX2. K, Quantification of J. Error bars, SEM. Statistical test, unpaired t test and multicomparison ANOVA.
Figure 4
Figure 4
Overexpression of CBX2 leads to an increase in M2-like macrophage activity. A, Diagram of co-culture experimental setup with OVCAR4 CBX2 OE exposed to primary monocytes (from eight unique donors), then analyzed by flow utilizing M1- and M2-like markers. B, Flow cytometry analysis of CBX2 OE compared with control, increase in M2-like macrophages (CD163 and CD206). C and D, Plots of the fold change of M1- and M2-like receptors in control, CBX2 OE, +LPS/INFγ, and IL4/IL10/IL13, in which IL4/IL10/IL13 serves as the control for M2-like stimulation. E, Functional phagocytosis assay of monocytes co-cultured with control OVCAR4 compared with CBX2 OE. F, Functional phagocytosis assay, +LPS (M1 stimulatory) compared with +IL4, +IL10, and +IL13 (M2 stimulatory). Error bars, SEM. Statistical test, unpaired t test. Note: Each dot represents a unique PBMC donor.
Figure 5
Figure 5
Knockdown of Cbx2 in a syngeneic mouse model of HGSC leads to shift in composition of the TIME. A, Diagram of ID8 syngeneic mouse model. B, RT-PCR analysis confirming Cbx2 knockdown in ID8 Trp53−/−Brca2−/− cells (internal control, 18S), C, Tumor dissemination sites and (D) total tumor weight of knockdown vs. control tumors. E, NanoString transcriptomic differential expression of shCbx2 compared with control, derived from solid tumors. F, NanoString pathway scores for cell proliferation, cytokine signaling score, immune cell and migration score, and myeloid comparison score between control and shCbx2. G, Comparison of CD3+ (T cells) and F480 (macrophages) without Ki67 positivity and (H) with Ki67 positivity in control vs. shCbx2. Error bars, SEM. Statistical test, unpaired t test and multicomparison ANOVA.

References

    1. Bowtell DDL. The genesis and evolution of high-grade serous ovarian cancer. Nat Rev Cancer 2010;10:803–8. - PubMed
    1. McPherson A, Roth A, Laks E, Masud T, Bashashati A, Zhang AW, et al. . Divergent modes of clonal spread and intraperitoneal mixing in high-grade serous ovarian cancer. Nat Genet 2016;48:758–67. - PubMed
    1. Siegel RL, Miller KD, Wagle NS, Jemal A. Cancer statistics, 2023. CA Cancer J Clin 2023;73:17–48. - PubMed
    1. Jayson GC, Kohn EC, Kitchener HC, Ledermann JA. Ovarian cancer. Lancet 2014;384:1376–88. - PubMed
    1. Agarwal R, Kaye SB. Ovarian cancer: strategies for overcoming resistance to chemotherapy. Nat Rev Cancer 2003;3:502–16. - PubMed

Publication types

MeSH terms