

Identification of SLC7A11-AS1/SLC7A11 pair as a ferroptosis-related therapeutic target for hepatocellular carcinoma
- PMID: 38984939
- PMCID: PMC11234646
- DOI: 10.1111/jcmm.18496
Identification of SLC7A11-AS1/SLC7A11 pair as a ferroptosis-related therapeutic target for hepatocellular carcinoma
Abstract
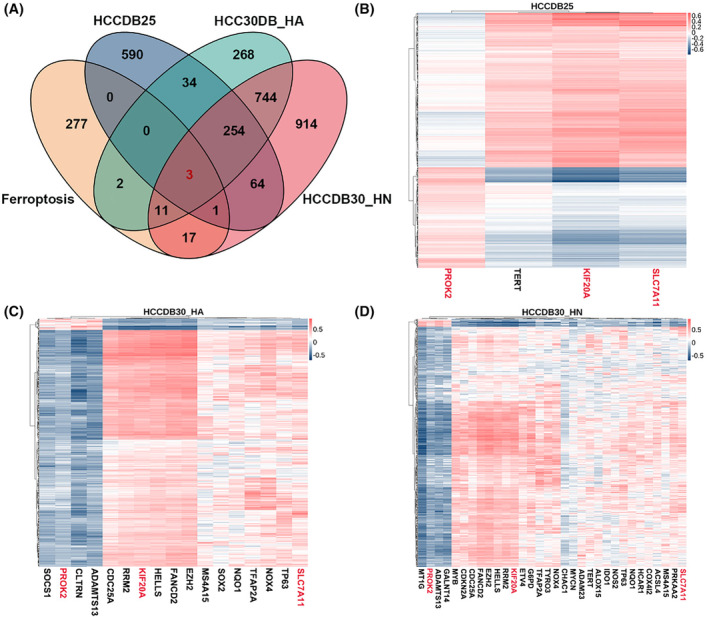
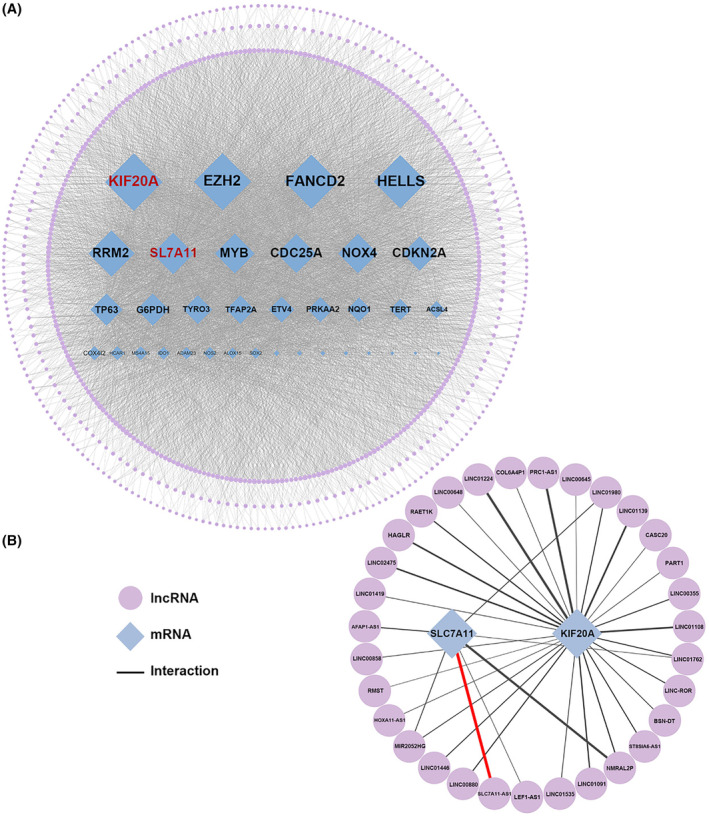
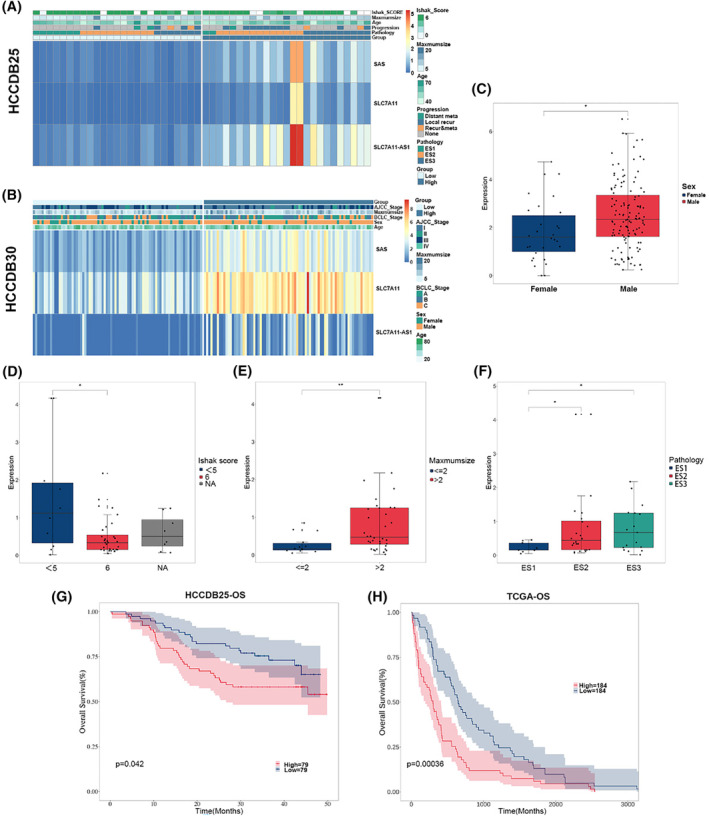
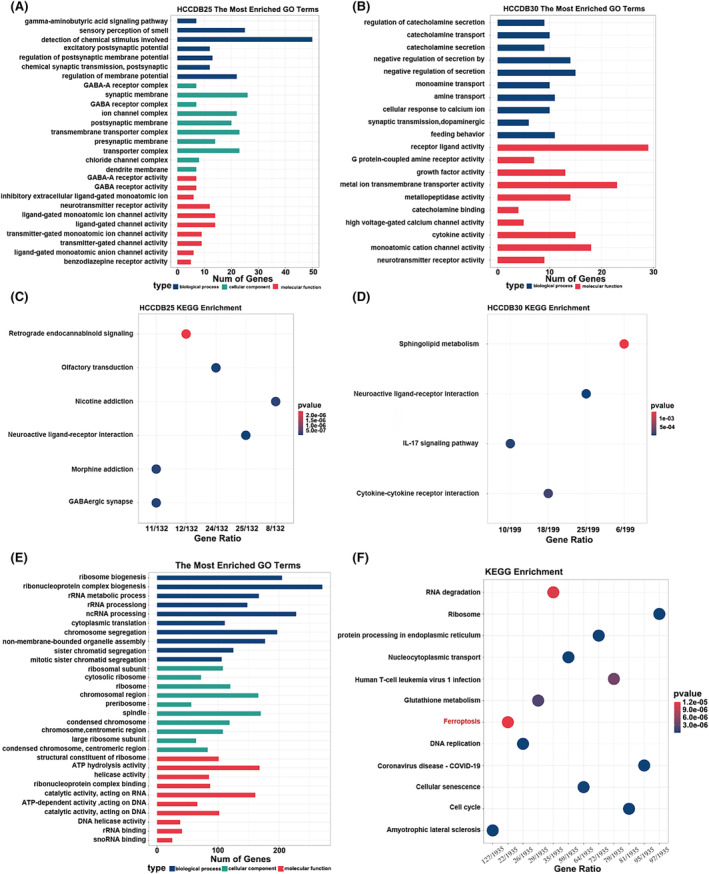
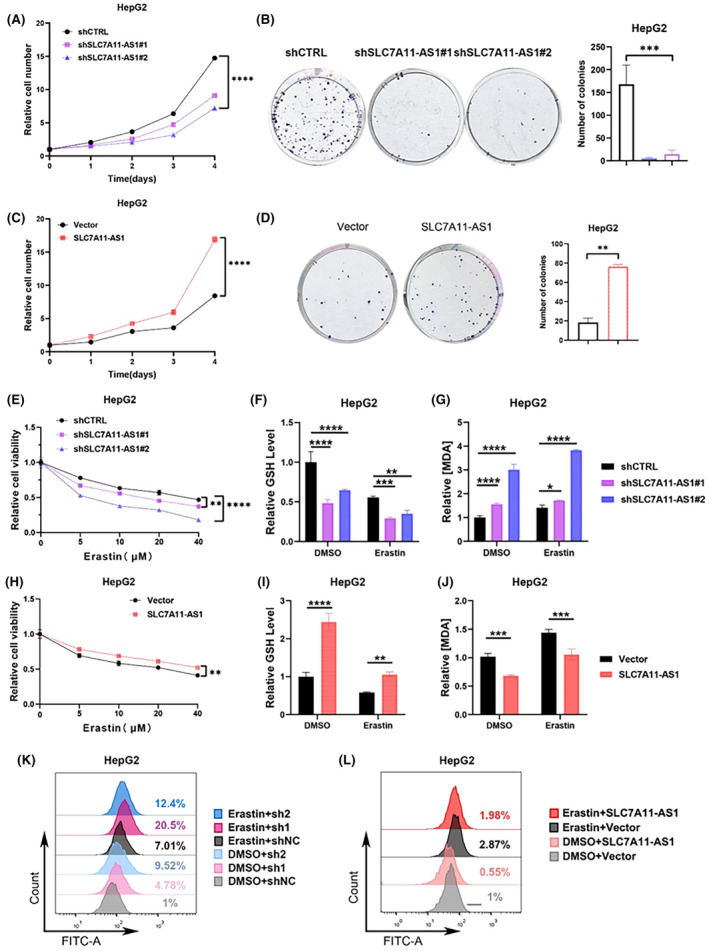
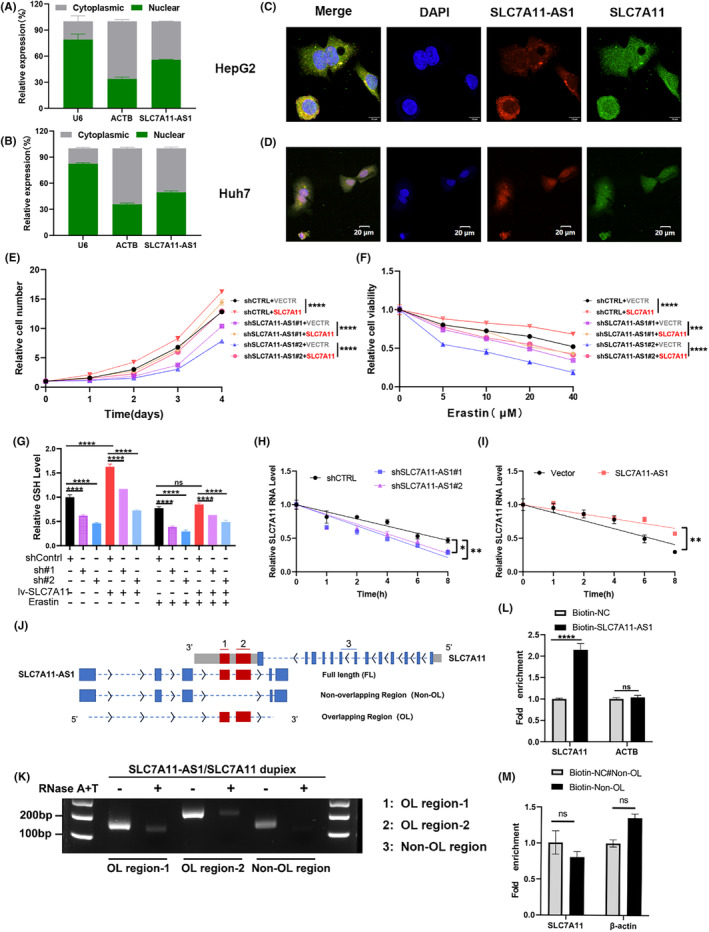
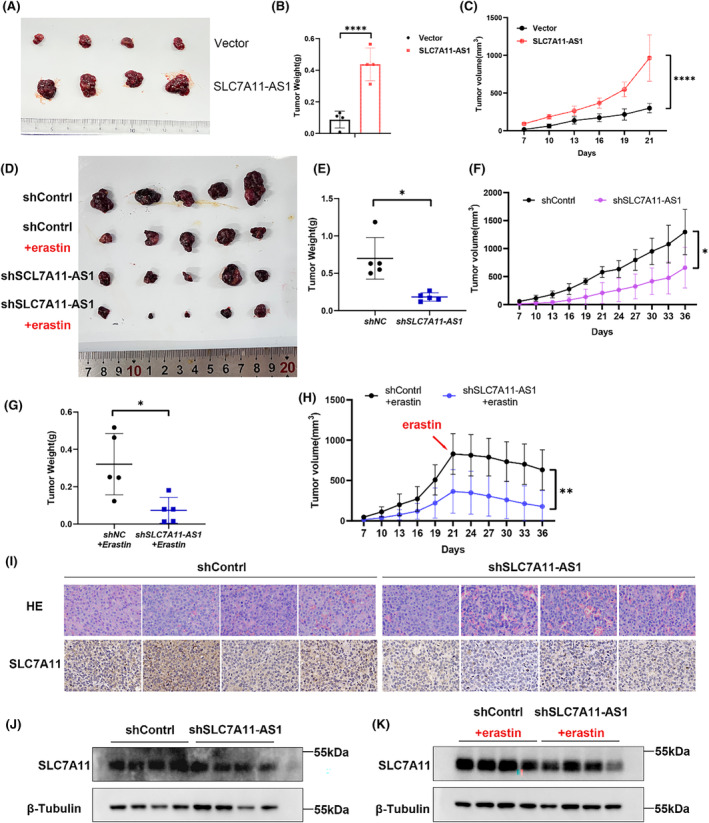
Hepatocellular carcinoma (HCC), a prevalent malignancy worldwide, poses significant challenges in terms of prognosis, necessitating innovative therapeutic approaches. Ferroptosis offers notable advantages over apoptosis, holding promise as a novel therapeutic approach for HCC complexities. Moreover, while the interaction between long non-coding RNAs (lncRNAs) and mRNAs is pivotal in various physiological and pathological processes, their involvement in ferroptosis remains relatively unexplored. In this study, we constructed a ferroptosis-related lncRNA-mRNA correlation network in HCC using Pearson correlation analysis. Notably, the SLC7A11-AS1/SLC7A11 pair, exhibiting high correlation, was identified. Bioinformatics analysis revealed a significant correlation between the expression levels of this pair and key clinical characteristics of HCC patients, including gender, pathology, Ishak scores and tumour size. And poor prognosis was associated with high expression of this pair. Functional experiments demonstrated that SLC7A11-AS1, by binding to the 3'UTR region of SLC7A11 mRNA, enhanced its stability, thereby promoting HCC cell growth and resistance to erastin- induced ferroptosis. Additionally, in vivo studies confirmed that SLC7A11-AS1 knockdown potentiated the inhibitory effects of erastin on tumour growth. Overall, our findings suggest that targeting the SLC7A11-AS1/SLC7A11 pair holds promise as a potential therapeutic strategy for HCC patients.
Keywords: SLC7A11; SLC7A11‐AS1; ferroptosis; hepatocellular carcinoma; lncRNA‐mRNA correlation network.
© 2024 The Author(s). Journal of Cellular and Molecular Medicine published by Foundation for Cellular and Molecular Medicine and John Wiley & Sons Ltd.
Conflict of interest statement
The authors declare that they have no known competing financial interests or personal relationships that could have appeared to influence the work reported in this paper.
Figures
Similar articles
-
PART1 facilitates tumorigenesis and inhibits ferroptosis by regulating the miR-490-3p/SLC7A11 axis in hepatocellular carcinoma.Aging (Albany NY). 2024 Jul 5;16(14):11339-11358. doi: 10.18632/aging.206009. Epub 2024 Jul 5. Aging (Albany NY). 2024. PMID: 39029955 Free PMC article.
-
RNA binding protein DAZAP1 promotes HCC progression and regulates ferroptosis by interacting with SLC7A11 mRNA.Exp Cell Res. 2021 Feb 1;399(1):112453. doi: 10.1016/j.yexcr.2020.112453. Epub 2020 Dec 29. Exp Cell Res. 2021. PMID: 33358859
-
Decreased lncRNA HNF4A-AS1 facilitates resistance to sorafenib-induced ferroptosis of hepatocellular carcinoma by reprogramming lipid metabolism.Theranostics. 2024 Oct 21;14(18):7088-7110. doi: 10.7150/thno.99197. eCollection 2024. Theranostics. 2024. PMID: 39629121 Free PMC article.
-
Upregulation of lncRNA NIFK-AS1 in hepatocellular carcinoma by m6A methylation promotes disease progression and sorafenib resistance.Hum Cell. 2021 Nov;34(6):1800-1811. doi: 10.1007/s13577-021-00587-z. Epub 2021 Aug 10. Hum Cell. 2021. PMID: 34374933 Review.
-
IFNγ-mediated repression of system xc- drives vulnerability to induced ferroptosis in hepatocellular carcinoma cells.J Leukoc Biol. 2021 Aug;110(2):301-314. doi: 10.1002/JLB.3MA1220-815RRR. J Leukoc Biol. 2021. PMID: 34318944 Review.
Cited by
-
Regulating ferroptosis by non-coding RNAs in hepatocellular carcinoma.Biol Direct. 2024 Sep 12;19(1):80. doi: 10.1186/s13062-024-00530-w. Biol Direct. 2024. PMID: 39267124 Free PMC article. Review.
-
The role of non-coding RNA in ferroptosis of liver cancer and its impact on lipid peroxidation.Front Immunol. 2025 Mar 26;16:1555518. doi: 10.3389/fimmu.2025.1555518. eCollection 2025. Front Immunol. 2025. PMID: 40207231 Free PMC article. Review.
-
Ferroptosis rewired: ncRNA gatekeepers as pharmacological targets in hepatocellular carcinoma.Naunyn Schmiedebergs Arch Pharmacol. 2025 Jul 7. doi: 10.1007/s00210-025-04404-4. Online ahead of print. Naunyn Schmiedebergs Arch Pharmacol. 2025. PMID: 40622592 Review.
-
Research progress of ferroptosis pathway and its related molecular ubiquitination modification in liver cancer.Front Oncol. 2025 Mar 21;15:1502673. doi: 10.3389/fonc.2025.1502673. eCollection 2025. Front Oncol. 2025. PMID: 40190567 Free PMC article. Review.
References
-
- Forner A, Reig M, Bruix J. Hepatocellular carcinoma. Lancet. 2018;391:1301‐1314. - PubMed
-
- Holohan C, van Schaeybroeck S, Longley DB, Johnston PG. Cancer drug resistance: an evolving paradigm. Nat Rev Cancer. 2013;13:714‐726. - PubMed
-
- Okada H, Mak TW. Pathways of apoptotic and non‐apoptotic death in tumour cells. Nat Rev Cancer. 2004;4:592‐603. - PubMed
-
- Louandre C, Ezzoukhry Z, Godin C, et al. Iron‐dependent cell death of hepatocellular carcinoma cells exposed to sorafenib. Int J Cancer. 2013;133:1732‐1742. - PubMed
MeSH terms
Substances
LinkOut - more resources
Full Text Sources
Medical
Molecular Biology Databases
