. 2024 Sep 10;5(5):zqae030.
doi: 10.1093/function/zqae030.

PAR1-mediated Non-periodical Synchronized Calcium Oscillations in Human Mesangial Cells

Affiliations

PAR1-mediated Non-periodical Synchronized Calcium Oscillations in Human Mesangial Cells

Mariia Stefanenko et al. Function (Oxf). .

Abstract

Mesangial cells offer structural support to the glomerular tuft and regulate glomerular capillary flow through their contractile capabilities. These cells undergo phenotypic changes, such as proliferation and mesangial expansion, resulting in abnormal glomerular tuft formation and reduced capillary loops. Such adaptation to the changing environment is commonly associated with various glomerular diseases, including diabetic nephropathy and glomerulonephritis. Thrombin-induced mesangial remodeling was found in diabetic patients, and expression of the corresponding protease-activated receptors (PARs) in the renal mesangium was reported. However, the functional PAR-mediated signaling in mesangial cells was not examined. This study investigated protease-activated mechanisms regulating mesangial cell calcium waves that may play an essential role in the mesangial proliferation or constriction of the arteriolar cells. Our results indicate that coagulation proteases such as thrombin induce synchronized oscillations in cytoplasmic Ca2+ concentration of mesangial cells. The oscillations required PAR1 G-protein coupled receptors-related activation, but not a PAR4, and were further mediated presumably through store-operated calcium entry and transient receptor potential canonical 3 (TRPC3) channel activity. Understanding thrombin signaling pathways and their relation to mesangial cells, contractile or synthetic (proliferative) phenotype may play a role in the development of chronic kidney disease and requires further investigation.

Keywords: SOC entry; TRPC channels; chronic kidney disease; glomerulus; thrombin.


Conflict of interest statement

The authors declare no conflict of financial interests.

Figures

Graphical Abstract
Graphical Abstract
Figure 1.
Figure 1.
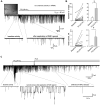
Functional basal activity of STIM1/Orai1, TRPC3, and TRPC6. (A) Representative trace showing inhibition of store-operated calcium entry (SOCE) and TRPC3 baseline activity in human renal mesangial cells (HRMCs) by the acute application of pyrazole derivative Pyr6 (15 µm) (holding potential is −60 mV). (B) The total number of events (top, single channel openings) and total current (bottom, calculated as an integral for the 100 s intervals before and after STIM1/Orai1+TRPC3 inhibition). Shown individual data points (left) and summary graphs (right). Data were analyzed using a one-way RM ANOVA (*P < 0.05). (C) Representative trace showing partial inhibition of baseline activity by TRPC6 channel blocker BI-749327 (1 µm) and strong inhibition of baseline activity by pyrazole derivative Pyr6 (15 µm) in HRMCs (holding potential is −60 mV). Expanded fragments show baseline activity, inhibition of TRPC6 channel after application of BI-749327, and inhibition of STIM1/Orai1+TRPC3 currents after application of Pyr6, respectively.
Figure 2.
Figure 2.
PAR1 response in cultured HRMCs. (A) Representative confocal imaging of intracellular [Ca2+]i concentration (Fluo-8H, AM fluorescence) before and after acute application of the PAR1 selective agonist TFLLR-NH2 (50 n m). The scale bar is 100 µm. (B) Peak values of PAR1 [Ca2+]i release (store release, first peak) fitted by Hill’s equation with half maximal effective concentration (EC50) 3.0 ± 0.8 n m.
Figure 3.
Figure 3.
PAR1 signaling promotes intracellular Ca2+ [Ca2+]i oscillations in human renal mesangial cells. (A) Confocal imaging experiment (Fluo-8H, AM fluorescence) show a small dose (5 n m) of PAR1 (TFLLR-NH2) agonist peptide promotes fast [Ca2+]i response (black line/single-peak line). The preincubation of cells with the specific PAR1 inhibitor (RWJ 56110, 10 µm) eliminated PAR1-mediated [Ca2+]i release (flat line). (B) Confocal imaging experiment shows a saturated concentration of TFLLR-NH2 (1 µm, see dose response in Figure 2) promotes synchronized damped Ca2+ oscillations (black line/multiple-peak line). The oscillations disappeared in a zero Ca2+ extracellular solution (single-peak line). (C) Summary for confocal experiments shown mean (bars) and individual cell (data points) of maximum [Ca2+]i amplitudes for first (store release, first peak, white bar/closed circle) and second (extracellular influx, second peak, gray bar/open circle) peaks in response to TFLLR-NH2 (1 µm). One way ANOVA, **P < 0.001 between different Ca2+ extracellular solution concentrations (2 or 0 m m of Ca2+).
Figure 4.
Figure 4.
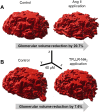
The contraction of the glomerular mesangial matrix in response to Ang II and PAR1 agonist acute applications. (A) Fast confocal 3D imaging shows changes in glomerular volume in response to acute application of Ang II (60 µm). (B) Fast confocal 3D imaging shows changes in glomerular volume in response to acute application of PAR1 agonist peptide TFLLR-NH2 (10 µm). The volume changes were calculated using the Imaris Image Analysis Software package.
Figure 5.
Figure 5.
The activation of protease-activated receptor 1 (PAR1) is required for thrombin-mediated intracellular Ca2+ [Ca2+]i oscillations in human renal mesangial cells. (A) Confocal imaging experiment (Fluo-8H, AM fluorescence) shows [Ca2+]i oscillations in response to application of thrombin receptor agonist peptide (5 µm) (black line). The preincubation of cells with the specific PAR1 inhibitor (RWJ 56110, 10 µm) significantly inhibit 1st peak (store release, white bar) and eliminate 2nd peak (extracellular influx, gray bar) of [Ca2+]i response to thrombin in HRMCs (red line). (B) Summary for confocal experiments shown mean (bars) and individual cell (data points) of maximum [Ca2+]i amplitudes for first (store release, 1st peak, white bar) and second (extracellular influx, 2nd peak, gray bar) peaks in response to thrombin receptor agonist peptide (5 µm) with or without the presence of PAR1 antagonist RWJ 56110. One way ANOVA, ** p<0.001 between control and RWJ 56110 treated groups.
Figure 6.
Figure 6.
The activation of protease-activated receptor 4 or 2 (PAR4 or PAR2) is not required for thrombin-mediated intracellular Ca2+ [Ca2+]i oscillations in human renal mesangial cells. (A) Confocal imaging experiment (Fluo-8H, AM fluorescence) shows the presence of PAR4-mediated [Ca2+]i in HMRCs. Cells preincubated with the specific PAR1 inhibitor (RWJ 56110, 10 µm) were not responsive to PAR1 agonist peptide TFLLR-NH2 (10 n m), but produced robust transient in response to PAR4 agonist peptide AY-NH2 (200 µm). (B) Confocal imaging experiment (Fluo-8H, AM fluorescence) shows the absence of synchronized [Ca2+]i oscillations in response to PAR4 agonist peptide AY-NH2 (200 µm) (black line). The preincubation of cells with the specific PAR4 inhibitor (tcY-NH2, 50 µm) inhibits the response entirely. Note the presence of non-synchronized spontaneous [Ca2+]i sparks in individual cells in both records. (C) Summary for confocal experiments shown mean (bars) and individual cell (data points) of maximum [Ca2+]i amplitudes in response to thrombin receptor agonist peptide (5 µm) with the presence of the specific PAR4 inhibitor (tcY-NH2, 50 µm). (D) The example of synchronized non-periodical oscillations in individual cells after acute application of thrombin receptor agonist peptide in the presence of vehicle (DMSO, black line) or PAR2 agonist (AZ 3451, 100 n m, red line). (E) Summary for confocal experiments shown in D. Mean (bars) and individual cell (data points) of maximum [Ca2+]i amplitudes in response to thrombin receptor agonist peptide (5 µm) with the presence of the specific PAR2 inhibitor (AZ 3451, 100 n m).
Figure 7.
Figure 7.
Pharmacological inhibition of PAR1-mediated oscillations in human renal mesangial cells. (A) Summary for confocal experiments shown mean (bars) and individual cell (data points) of the normalized maximum [Ca2+]i amplitudes during the pharmacological blockade of SOCE (STIM1/Orai1) entry (Pyr6 5 µm), ionotropic TRPC6 and TRPC3 channels (GSK 2833503A 20 µm) influx, and both STIM1/Orai1 + TRPC6/3 (Pyr6 15 µm + GSK 20 µm). (B) Summary for confocal experiments shown mean (bars) and individual cell (data points) of the normalized maximum [Ca2+]i amplitudes during the pharmacological blockade of STIM1/Orai1 + TRPC3 (Pyr6 15 µm), ionotropic TRPC6 only (BI-749327, 1 µm), and STIM1/Orai1 + TRPC6/3 (Pyr6 30 µm + GSK 20 µm). Graphs show the [Ca2+]i maximum amplitude normalized to mean vehicle response (see Supplemental Figure S1 for not normalized to vehicle values). White/closed circles and gray/open circles bars/data points indicate store release (first peak) and extracellular influx (second peak). Two-way ANOVA with Dunnett’s post hoc test, vehicle versus drugs application, &P < 0.01 (for first peak), *P < 0.0001 (for second peak). Two-way ANOVA with Tukey post hoc test, Pyr6 5 µm or GSK alone versus Pyr6 15 µm or drug combination, #P < 0.0001 (for second peak).
Figure 8.
Figure 8.
G-protein-coupled receptors PAR1 signaling activate TRPC3 and STIM1/Orai1 channels in human renal mesangial cells (HRMCs). (A) Representative electrophysiological recording of channels activity in HRMCs before and after application of PAR1 agonist peptide TFLLR-NH2 (1 µm). The top left corner shows a photomicrograph of the electrophysiological experiment. The single-channel trace insets show expanded recording intervals. (B) The total number of events (top, single channel openings) and total current (bottom, calculated as an integral for the 100 s intervals before and after PAR1 activation) changes in response to TFLLR- NH2 (1 µm) application. Shown individual data points (left) and summary graphs (right). One-way RM-ANOVA, *P < 0.05. (C) Representative trace showing the activation of PAR1 by the specific agonist peptide TFLLR-NH2 (1 µm) and inhibition of PAR1-mediated STIM1/Orai1+TRPC3 channels activity by pyrazole derivative Pyr6 (15 µm). Expanded fragments show baseline activity, increased current activity after application of TFLLR-NH2, and inhibition of currents after application of Pyr6, respectively. All traces were recorded at −60 mV holding potential.
Figure 9.
Figure 9.
Saturated PAR1 agonist concentrations, in addition to SR/ER calcium release, activate ionotropic calcium influx from STIM1/Orai1 and TRPC3 channels, mediating intracellular calcium oscillations.

Similar articles

Cited by

References

    1. Ebefors K, Bergwall L, Nystrom J. The Glomerulus according to the mesangium. Front Med (Lausanne). 2021;8:740527. - PMC - PubMed
    1. Thomas HY, Ford Versypt AN. Pathophysiology of mesangial expansion in diabetic nephropathy: mesangial structure, glomerular biomechanics, and biochemical signaling and regulation. J Biol Eng. 2022;16(1):19. - PMC - PubMed
    1. Schlondorff D, Banas B. The mesangial cell revisited: no cell is an island. J Am Soc Nephrol. 2009;20(6):1179–1187. - PubMed
    1. Wetzel RK, Sweadner KJ. Phospholemman expression in extraglomerular mesangium and afferent arteriole of the juxtaglomerular apparatus. Am J Physiol Renal Physiol. 2003;285(1):F121–129. - PubMed
    1. Ren Y, Carretero OA, Garvin JL. Role of mesangial cells and gap junctions in tubuloglomerular feedback. Kidney Int. 2002;62(2):525–531. - PubMed

LinkOut - more resources