. 2024 Jul 11;5(4):zqae019.
doi: 10.1093/function/zqae019.

The P2X7 Receptor is a Master Regulator of Microparticle and Mitochondria Exchange in Mouse Microglia

Affiliations

The P2X7 Receptor is a Master Regulator of Microparticle and Mitochondria Exchange in Mouse Microglia

Simonetta Falzoni et al. Function (Oxf). .

Abstract

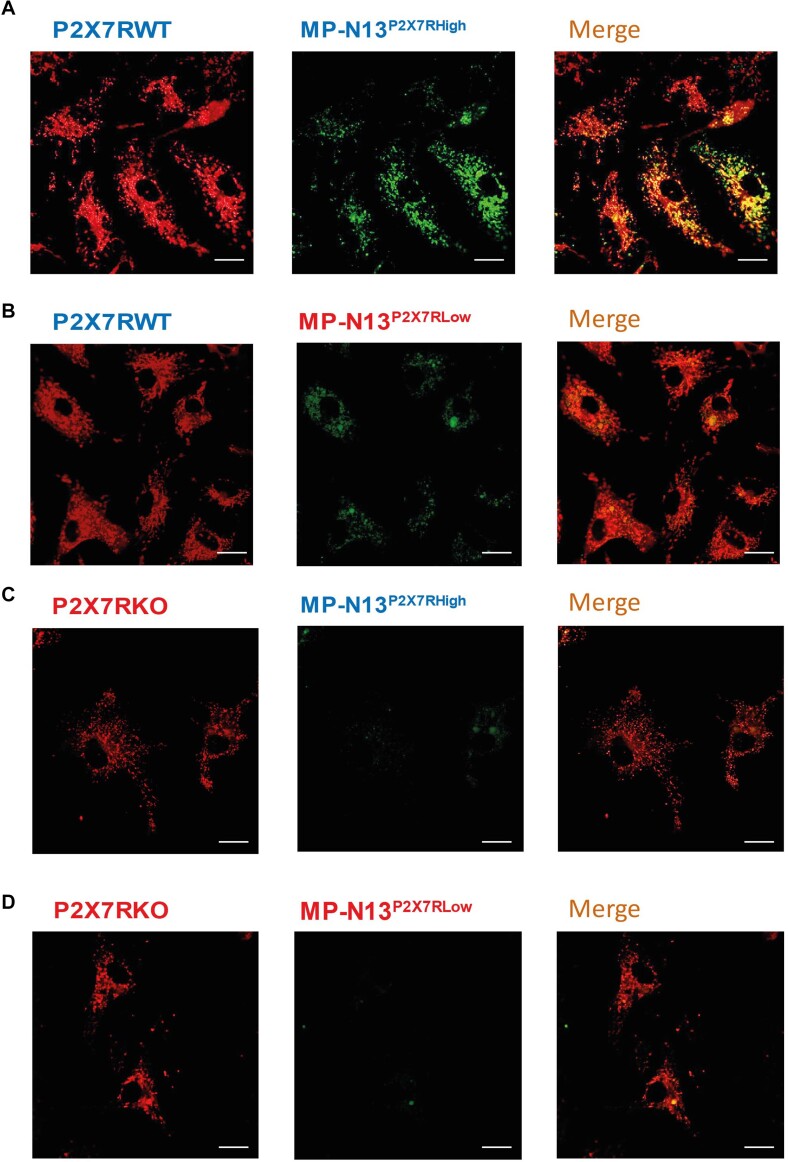
Microparticles (MPs) are secreted by all cells, where they play a key role in intercellular communication, differentiation, inflammation, and cell energy transfer. P2X7 receptor (P2X7R) activation by extracellular ATP (eATP) causes a large MP release and affects their contents in a cell-specific fashion. We investigated MP release and functional impact in microglial cells from P2X7R-WT or P2X7R-KO mice, as well as mouse microglial cell lines characterized for high (N13-P2X7RHigh) or low (N13-P2X7RLow) P2X7R expression. P2X7R stimulation promoted release of a mixed MP population enriched with naked mitochondria. Released mitochondria were taken up and incorporated into the mitochondrial network of the recipient cells in a P2X7R-dependent fashion. NLRP3 and the P2X7R itself were also delivered to the recipient cells. Microparticle transfer increased the energy level of the recipient cells and conferred a pro-inflammatory phenotype. These data show that the P2X7R is a master regulator of intercellular organelle and MP trafficking in immune cells.

Keywords: P2X7 receptor; inflammation; microglia; microparticles; mitochondria.


Conflict of interest statement

FDV is a member of the Scientific Advisory Board of Biosceptre Ltd (Australia), a biotech Company involved in the development of anti-P2X7 antibodies, and a Consultant with Breye Therapeutics ApS (Denmark). The other authors declare no conflict of interest. FDV is an inventor and owner of the following patent:

(1) Chimeric proteins for measuring ATP concentrations in the pericellular space and related screening method. 2005. European Patent Office number RM2005A000252-SG/IC.

FDV, SF, and MT are inventors and owners of the following patent:

(2) Ratiometric probe for the measurement of the extracellular ATP concentration. 2023. Filed, allowance pending.

Figures

Graphical Abstract
Graphical Abstract
Figure 1.
Figure 1.
N13 microglial cells release MPs in a P2X7R-dependent fashion. Five ×105 N13-P2X7RHigh (A) or N13-P2X7RLow (C) cells were loaded with the cytoplasmic marker calcein/AM (1 μg/mL) in RPMI complete culture medium for 20 min, then rinsed, re-suspended in the same medium, and challenged with 0.4 m m eATP for 15 min to trigger MP (arrow) release [(B, eATP-stimulated N13-P2X7RHigh; D, eATP-stimulated N13-P2X7RLow)]. (E-H) Cells were loaded with CSFE (5 μm) and incubated with increasing concentrations of eATP (E) or BzATP (F) for 60 min. (G) cells were treated with 0.3 m m oxidized ATP (oxo) for 1 h at 37°C prior to stimulation with either eATP or BzATP. (H) Time course of MP release in the presence or absence of either 0.4 m m eATP or 0.2 m m BzATP. To measure MP fluorescence, cell supernatants were withdrawn, centrifuged at 10 000 × g (4°C) for 1 h to concentrate the MPs, and the pellet re-suspended in 500 μL of sucrose medium. Fluorescence was measured in a fluorimeter cuvette at the 488/520 nm wavelength pair. Data are means ± SEM of three to four experiments each performed in triplicate. ** = < 0.01; *** = < 0.001; **** = < 0.0001 by Student t-test (E-G), or two-way ANOVA (H). Fluorescence images were acquired with a Nikon Eclipse TE 300 inverted fluorescence microscope equipped with a 40× objective and fluorescein filters. Bar = 10 μm.
Figure 2.
Figure 2.
Released MPs contain mitochondria. N13-P2X7RHigh (A, B) cells (105) were seeded onto 13-mm-diameter round glass coverslip and stained with the mitochondrial selective dye MitoTracker Green FM (200 n m) for 15 min at 37°C. The coverslips were then placed on the heated (37°C) stage of a Nikon inverted microscope as described in the legend to Figure 1, and either left unchallenged (A) or stimulated with 0.4 m m eATP for 5 min (B). Yellow arrows indicate MitoTracker Green FM-stained MPs. In panels C-F, supernatants from resting (C, D) or 0.4 m m eATP-stimulated (E, F) N13-P2X7High were stained with calcein/AM (C, E) or MitoTracker Red FM (D, F) and analyzed with a Zeiss LSM510 confocal microscope equipped with a 63× oil immersion plan-apochromat objective. (G) Calcein/AM- or MitoTracker Red FM-positive MPs released from resting or eATP-stimulated N13-P2X7High released over a 60-min timespan were quantitated. (H) Microparticles released over a 24 h incubation period from eATP (0.4 m m)-challenged N13-P2X7RHigh cells co-labeled MitoTracker Red FM (200 n m) and calcein/AM (1 μm), were isolated as described in Materials and Methods and analyzed by confocal microscopy with rodhamine (upper) or fluorescein (middle) filters, and merged (lower). Microparticles isolated from N13-P2X7RHigh were analyzed by TEM without (I) or with (J) immunogold labeling with an antibody against the specific mitochondrial protein TOM20. Microparticles isolated from resting (K) or 0.4 m m eATP-stimulated (L-N) N13-P2X7RHigh were stained with TMRM and analyzed by confocal microscopy. 2.5 μm FCCP (M), or 200 n m rotenone (N) were also added. Bars = 20 μm (A-F), 10 μm (H, K-N). Data are means ± SEM from three independent experiments each performed in triplicate. ****  P < 0.0001 by unpaired t test.
Figure 3.
Figure 3.
Microparticle-P2X7RHigh compared to MP-P2X7RLow express higher levels of NLRP3, P2X7R and mitochondrial markers. N13-P2X7RHigh and N13-P2X7RLow cells were plated in 75 cm2 culture flasks and stimulated with 0.4 m m eATP or 0.2 m m BzATP for 24 h. At the end of this incubation, MPs were isolated and processed for Western Blotting analysis (A, B) as described in Materials and Methods. Carbonic anhydrase was used as a loading control. Densitometry (C-H) was performed with ImageJ software. mRNA was isolated from control or eATP-stimulated (0.4 m m) MPs (P2X7R, I), (NLRP3, J), and from MPs released during a 24-h incubation. CTRL: control resting cells. (K) Oxygen consumption by MP-P2X7RHigh in the absence or presence of FCCP or oligomycin. Control (CTRL): O2 consumption in the absence of MPs. (L) Intracellular ATP (iATP) content of MP-P2X7RHigh and MP-P2X7RLow. ATP was measured as described in Materials and Methods. Data are means ± SEM from three to four independent experiments. * P < 0.05; ** P < 0.01; *** P < 0.001; ****  P < 0.0001 by unpaired t test.
Figure 4.
Figure 4.
Released mitochondria are taken up by target N13 microglial cells in a P2X7R-dependent fashion. (A) Unlabeled N13-P2X7RHigh or N13-P2X7RLow were let adhere to 24-well dishes, rinsed, and further incubated in complete RPMI medium for 24 h with MitoTracker Green FM-labeled MP-P2X7RHigh or MP-P2X7RLow previously isolated from MitoTracker Green FM-labeled source N13 cells (see Materials and Methods). At the end of this incubation, the monolayers were rinsed to remove extracellular MPs, fresh medium was added, and the cells analyzed by confocal microscopy as described in the legend to Figure 1. (B) N13-P2X7RHigh (upper panel) or N13-P2X7RLow (lower panel) were loaded with MitoTracker Red FM (400 n m) at 37°C for 20 min, then thoroughly rinsed and further incubated at 37°C in complete RPMI medium for 24 h with MP-P2X7RHigh released from MitoTracker Green-stained N13-P2X7RHigh. At the end of this incubation period cells were analyzed by confocal microscopy. (C) Intracellular ATP content of N13-P2X7RHigh or N13-P2X7RLow after 3 or 24 h (1 d) of co-incubation with MP-P2X7RHigh. (D) WB of control or MP-P2X7RHigh-pulsed N13-P2X7RHigh or N13-P2X7RLow cell lysates. Actin was used as loading control. (E-G) Densitometric analysis. Isolation of MP-P2X7RHigh and co-incubation with either N13-P2X7RHigh or N13-P2X7RLow were performed as described in Materials and Methods. (A) Bar = 20 μm; B, bar = 10 μm. * P < 0.05; ** P < 0.01; *** P < 0.001; ****  P < 0.0001 by unpaired t test.
Figure 5.
Figure 5.
Released mitochondria are taken up by primary microglia in a P2X7R-dependent fashion. Mitotracker Red-labelled microglial cells from P2X7R-WT or P2X7R-KO mice were let adhere to 24-well dishes, rinsed, and further incubated in complete RPMI medium for 24 h with MitoTracker Green FM-labeled MP-P2X7RHigh or MP-P2X7RLow previously isolated from MitoTracker Green FM-labeled source N13 cells (Materials and Methods). At the end of this incubation, the monolayers were rinsed to remove extracellular MPs, fresh medium was added, and the cells analyzed by confocal microscopy as described in the legend to Figure 1. Bars = 5 µm.
Figure 6.
Figure 6.
Fusion of MP-P2X7RHigh with the recipient cells restores eATP-mediated plasma membrane permeabilization and increases the proliferation rate in a P2X7R-dependent fashion. Fluorescence (A-D, upper panels) or phase contrast (A-D, lower panels) images of eATP-stimulated lucifer yellow uptake of control (A) or MP-P2X7RHigh-challenged (B) N13-P2X7RHigh, or control (C) or MP-P2X7RHigh-challenged (D) N13-P2X7RLow. Cells were incubated in complete RPMI medium at 37°C in a CO2 incubator in the absence or presence of MP-P2X7RHigh for 24 h, then rinsed, further incubated in complete RPMI at 37°C, and challenged with 3 m m eATP in the presence of 1 mg/mL lucifer yellow. At the end of this incubation, the monolayers were thoroughly rinsed, incubated in fresh complete RPMI medium and analyzed by fluorescence microscopy with a IMT-2 Olympus phase/fluorescence microscope equipped with 20× objective. (E) Lucifer yellow fluorescence was quantitated as described in Materials and Methods. N13-P2X7RHigh (F) or N13-P2X7RLow (G) were seeded at 37°C in a CO2 incubator in 24-well plastic dishes in complete RPMI medium. After an overnight incubation, a suspension of either MP-P2X7RHigh or MP-P2X7RLow was added to each given cell type, and incubation carried out at 37°C in a CO2 incubator for further 72 h. Cell number was quantitated by crystal violet (see Materials and Methods). Bars = 50 μm. * P < 0.05; ** P < 0.01; *** P < 0.001; ****  P < 0.0001 by unpaired t test.
Figure 7.
Figure 7.
Microparticle fusion with the recipient cells enhances MGC formation in a P2X7R-dependent fashion. N13-P2X7RHigh were incubated in 24-well plastic dishes at 37°C in complete RPMI medium for 48 h as such (A) or in the presence of either MP-P2X7RLow (B) or MP-P2X7RHigh (C). Time course of MGC formation shown as fusion index in N13-P2X7RHigh monolayers incubated in the presence of MP-P2X7RLow, MP-P2X7RHigh, or left unchallenged (D). N13-P2X7RLow were incubated in 24-well plastic dishes at 37°C in complete RPMI medium for 48 h as such (E) or in the presence of either MP-P2X7RLow (F) or MP-P2X7RHigh (G). Time course of MGC formation in N13-P2X7RLow monolayers incubated in the presence of MP-P2X7RLow, MP-P2X7RHigh, or left unchallenged (H). Fusion index was calculated as follows: (number of nuclei within MGC/total number of nuclei) × 100. All pictures were taken with an Olympus microscope, as described in the legend to Figure 6.Bars = 10 µm. ** P < 0.01; *** P < 0.001; ****  P < 0.0001 by unpaired t test.

References

    1. van Niel G, D'Angelo G, Raposo G. Shedding light on the cell biology of extracellular vesicles. Nat Rev Mol Cell Biol. 2018;19(4):213–228. - PubMed
    1. Hough KP, Trevor JL, Strenkowski JG et al. Exosomal transfer of mitochondria from airway myeloid-derived regulatory cells to T cells. Redox Biol. 2018;18: 54–64. - PMC - PubMed
    1. D'Souza A, Burch A, Dave KM et al. Microvesicles transfer mitochondria and increase mitochondrial function in brain endothelial cells. J Control Release. 2021;338: 505–526. - PMC - PubMed
    1. MacKenzie A, Wilson HL, Kiss-Toth E, Dower SK, North RA, Surprenant A. Rapid secretion of interleukin-1beta by microvesicle shedding. Immunity. 2001;15(5):825–835. - PubMed
    1. Bianco F, Pravettoni E, Colombo A et al. Astrocyte-derived ATP induces vesicle shedding and IL-1 beta release from microglia. J Immunol. 2005;174(11):7268–7277. - PubMed

MeSH terms

Substances

LinkOut - more resources